Abstract
American mandarin orange production has remained stable year after year. According to the latest data for 2024, the total annual mandarin orange production in the United States will be 904kt, the highest figure compared to historical data. In the United States, the warm climate of the South is ideal for mandarin orange farming, with Florida and California known as major production areas. Technological innovation and increased agricultural efficiency have resulted in improved quality and a stable supply. Due in part to growing health awareness among consumers, American mandarins have become highly popular both at home and abroad.
Tangerine production volume
Between 2008 and 2024, annual U.S. mandarin and tree nut production fluctuates. At its peak in 2021, the US as a whole produced 1.19 mt, but current production is down to 75.7% of that peak. This decline is likely due to changes in climatic conditions and agricultural practices. In particular, climate change is having an increasing impact on agriculture, which is affecting production volumes. Other factors include changes in consumer tastes and market competition. On the other hand, technological innovation and sustainable agricultural practices have improved productivity, helping to maintain a certain degree of stability. These factors combine to keep U.S. mandarin and nut production fluctuating but generally staying within a stable range.
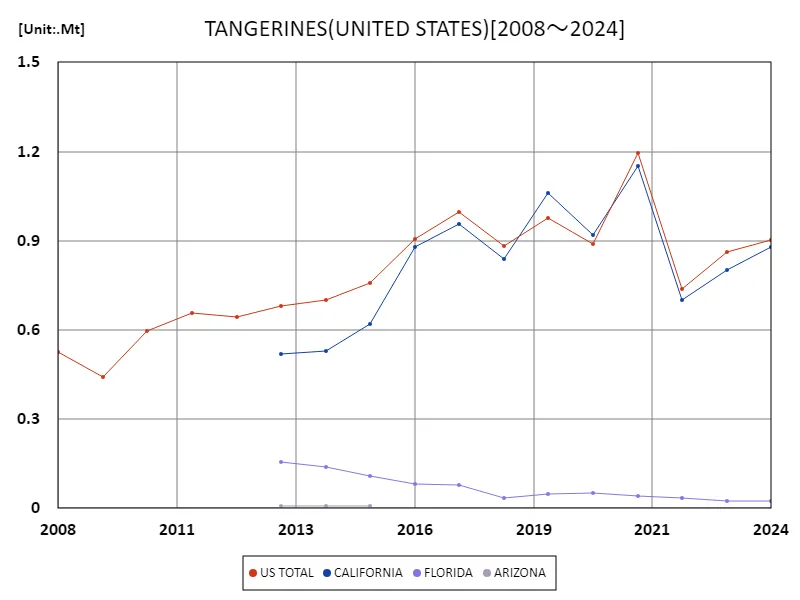
The maximum is 1.19Mt[2021] of US TOTAL, and the current value is about 75.7%
Tangerine production (50 US states)
Annual U.S. mandarin and tree nut production in California fluctuates from 2013 to 2024. Notably, production peaked at 1.15mt in 2021, but current production is down to 76.4% of that peak. This decline is likely due to several factors. The main factors are changes in climatic conditions, the effects of natural disasters, and efficiency improvements due to advances in agricultural technology. California is known for its climate, which is ideal for growing fruit, and is a region where technological innovation and sustainable agricultural efforts are taking place at a rapid pace. This allows us to improve productivity and maintain quality, while at the same time placing emphasis on environmental considerations. Changes in market demand and increased international competition are also affecting production volumes. California’s tangerine and nut production is influenced by these factors, but remains relatively stable and aims for sustainable growth.
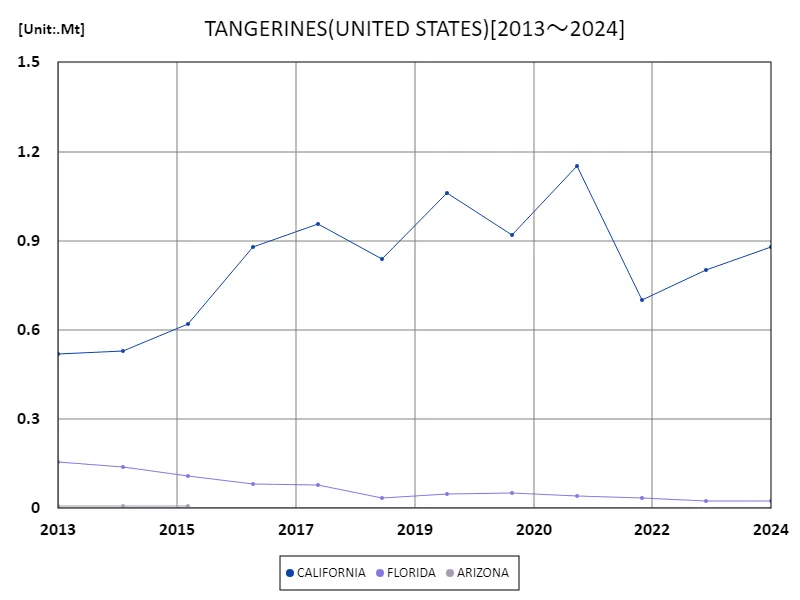
The maximum is 1.15Mt[2021] of CALIFORNIA, and the current value is about 76.4%
Tangerine production (latest year, 50 US states)
The 2024 data on annual U.S. mandarin and nut production highlights several notable features. California recorded the highest overall speed of 880kt, with an overall average of 452kt for a total of 904kt. This data shows that California is the leading producer in the United States. Additionally, the overall average of 452kt suggests that production varies from state to state, with production concentrated in certain regions. With a total production of 904kt, U.S. mandarin and nut production has remained relatively stable, supported by climatic conditions and advances in agricultural technology. Additionally, it is important that sustainable agricultural practices are implemented while responding to changes in consumer demand and the market. Looking into the future, the effects of climate change and market competition may further affect production, but it is hoped that technological innovation and the promotion of sustainable agriculture will help maintain a stable supply.
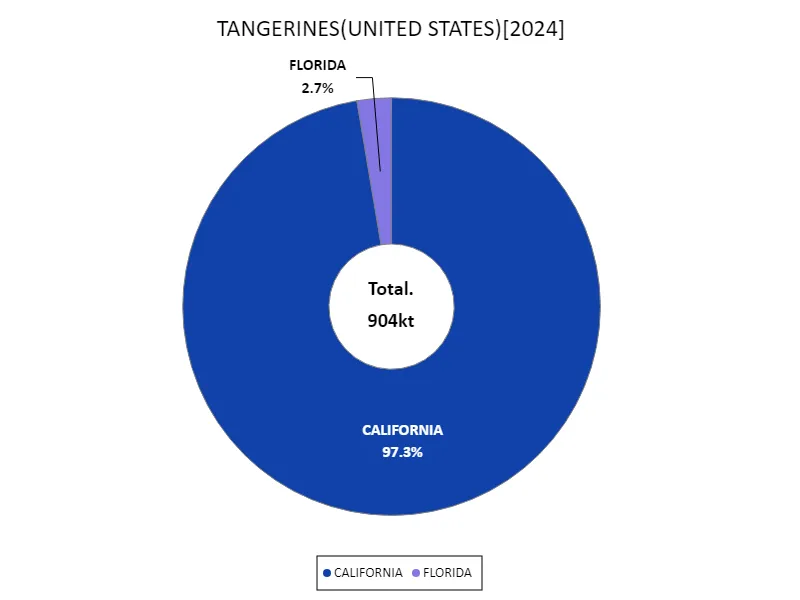
The maximum is 880kt of CALIFORNIA, the average is 452kt, and the total is 904kt
Main data
| TANGERINES(ALL CLASSES, ALL PRODUCTION PRACTICES, UTILIZED, PRODUCTION, UNITED STATES) [kt] | |||
|---|---|---|---|
| US TOTAL | CALIFORNIA | FLORIDA | |
| 2024 | 904 | 880 | 24 |
| 2023 | 863 | 800 | 23 |
| 2022 | 736 | 700 | 36 |
| 2021 | 1194 | 1152 | 42 |
| 2020 | 888 | 920 | 50 |
| 2019 | 977 | 1060 | 47 |
| 2018 | 881 | 840 | 36 |
| 2017 | 997 | 956 | 77 |
| 2016 | 907 | 880 | 81 |
| 2015 | 758 | 620 | 109 |
| 2014 | 702 | 528 | 140 |
| 2013 | 682 | 520 | 156 |
| 2012 | 644 | ||
| 2011 | 657 | ||
| 2010 | 596 | ||
| 2009 | 443 | ||
| 2008 | 527 | ||


Comments