
Abstract
Annual U.S. lemon production totals 836 kilotons in 2024, the most recent year available. This is an example of the sustained growth that has taken place over the past few decades. America’s climate conditions and advances in agricultural technology have contributed to increased lemon productivity. California is a major production area, with a warm climate and abundant water resources that make it ideal for lemon cultivation. Another factor is the increasing demand for lemon products due to growing health consciousness among consumers. Farmers’ hard work and innovation are putting the American lemon industry on a sustainable growth path.
Lemon production
U.S. annual lemon production (tons) fluctuated from 2008 to 2024, peaking at 1.06 megatons (mt) in 2022. Then, in 2024, production falls by 79%, to about 836 kilotonnes. This trend is due to several factors. For example, this is due to the unstable weather caused by climate change and improved productivity due to advances in agricultural technology. Furthermore, while the demand for lemon products is increasing due to consumers becoming more health-conscious, agricultural sustainability and water resource management are becoming issues. The U.S. lemon industry continues to respond to these fluctuations and strives to maintain stable production volumes.

The maximum is 1.06Mt[2022] of US TOTAL, and the current value is about 79%
Lemon production (50 US states)
The annual lemon production (tons) in California, USA varies from 2013 to 2024. It recorded a peak of 1.01 megatonnes (mt) in 2022, but by 2024 it had fallen to about 0.80 mt, or 79.4% of this figure. There are several possible factors behind this decline. Firstly, fluctuating climatic conditions and poor weather could be affecting yields. Additionally, improvements in agricultural techniques and sustainable agricultural practices are contributing to stabilizing production volumes. Additionally, growing health consciousness among consumers is increasing the demand for lemon products, which is also impacting production volume. Taking advantage of its mild climate and abundant water resources, California has established itself as a major lemon producing region. However, sustainable agriculture and water resource management remain challenges for the state. Farmers and industry participants across the state continue to work hard to maintain stable lemon production while meeting these challenges.

The maximum is 1.01Mt[2022] of CALIFORNIA, and the current value is about 79.4%
Lemon production (latest year, 50 US states)
Looking at the annual lemon production in the United States in 2024, California was the leading overall producer, recording a production of 800 kilotonnes (kt). This figure accounts for almost the entire total of 836kt. The American lemon industry has grown by taking advantage of California’s warm climate and abundant water resources. On the other hand, the average annual production figure of 418kt indicates year-to-year fluctuations in production. This is due to changes in climatic conditions and advances in agricultural technology. In particular, the importance of sustainable agriculture has increased in recent years, and managing water resources and reducing the environmental impact have become issues. As consumers become more health conscious, the demand for lemon products is also increasing, which is putting pressure on production. The American lemon industry aims to achieve sustainable growth by balancing these factors.
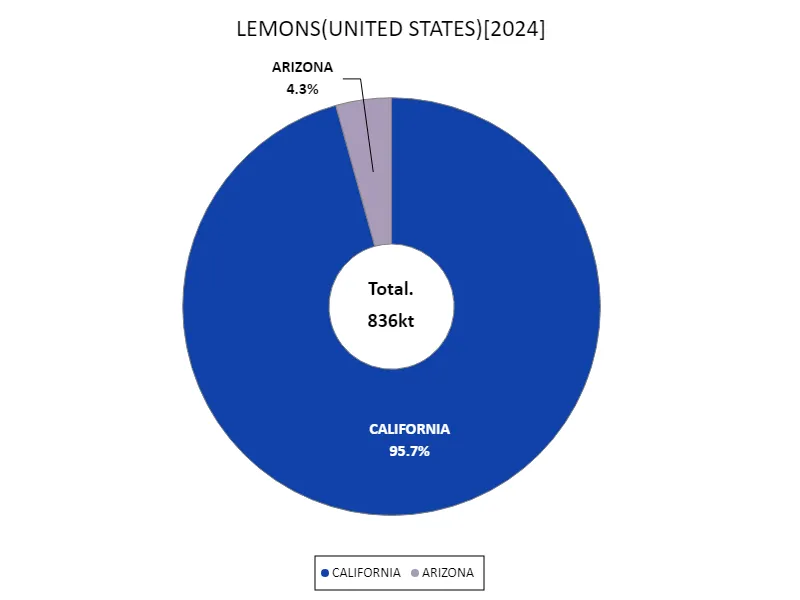
The maximum is 800kt of CALIFORNIA, the average is 418kt, and the total is 836kt
Main data
| LEMONS(ALL CLASSES, ALL PRODUCTION PRACTICES, UTILIZED, PRODUCTION, UNITED STATES) [kt] | |||
|---|---|---|---|
| US TOTAL | CALIFORNIA | ARIZONA | |
| 2024 | 836 | 800 | 36 |
| 2023 | 966 | 880 | 60 |
| 2022 | 1058 | 1008 | 50 |
| 2021 | 886 | 856 | 30 |
| 2020 | 816 | 840 | 76 |
| 2019 | 856 | 840 | 52 |
| 2018 | 870 | 820 | 64 |
| 2017 | 912 | 840 | 72 |
| 2016 | 904 | 840 | 64 |
| 2015 | 888 | 800 | 80 |
| 2014 | 871 | 752 | 72 |
| 2013 | 912 | 840 | 72 |
| 2012 | 850 | ||
| 2011 | 920 | ||
| 2010 | 882 | ||
| 2009 | 912 | ||
| 2008 | 619 | ||


Comments