Abstract
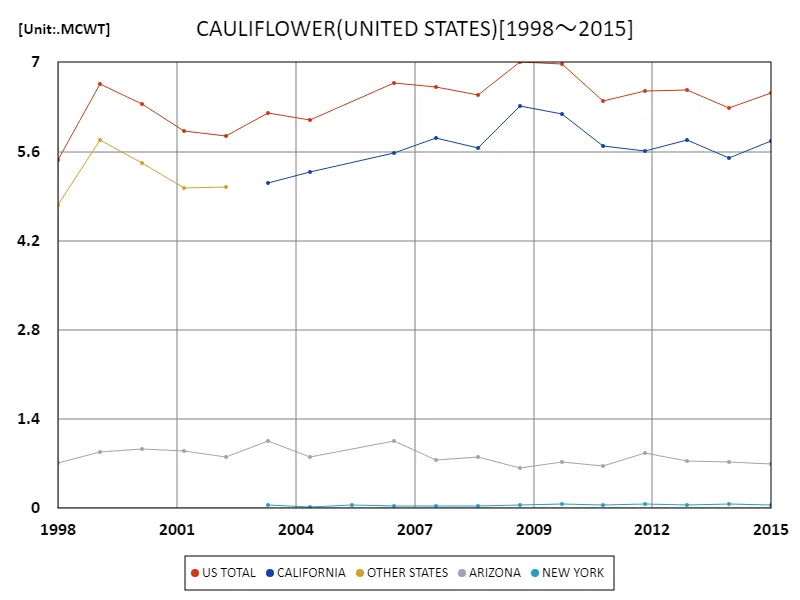
Annual U.S. cauliflower production has increased steadily over the past few years. According to the latest data for 2023, national crop cauliflower production reached 8.29 million centimeter weights (cwt). This increase is driven by advances in agricultural technology and improved production efficiency. Cauliflower in particular is becoming increasingly popular among consumers as part of a healthy diet, and increased demand is also a factor in expanding production. The diversity of growing conditions in different regions of the United States allows for a consistent year-round supply of cauliflower. In the future, the spread of sustainable agricultural practices and production adjustments in response to fluctuations in market demand will continue to contribute to the development of the U.S. cauliflower industry.
Cauliflower production
Between 1998 and 2023, the annual production of cauliflower in the United States fluctuated. At its peak in 2019, the U.S. recorded 10.1 million centimeter weights (cwt), but is now at 8.29 mcwt, or 82.2% of that amount. This decline is due to several factors. For example, changes in climatic conditions and improved productivity due to advances in agricultural technology are having an impact. Additionally, changes in market demand and consumer preferences also affect production volumes. Cauliflower is highly nutritious and is included in many meal plans, but there are challenges with ensuring stable demand. In the future, it will be important to promote sustainable agricultural practices and adjust production according to demand. The U.S. cauliflower industry must take these factors into consideration to maintain a stable supply and meet market needs.


The maximum is 7MCWT[2009] of US TOTAL, and the current value is about 93%
Cauliflower production (50 US states)
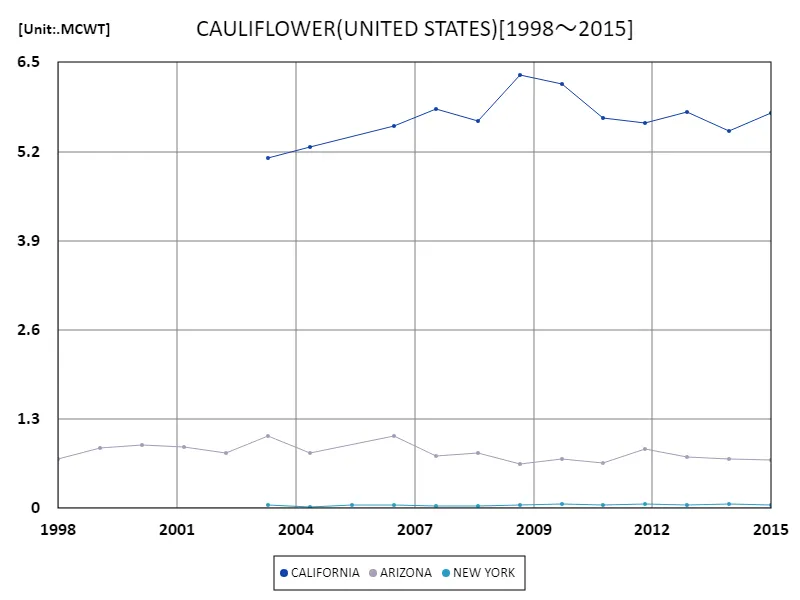
Looking at data from 1998 to 2023, California is the leading producer of cauliflower in the United States, recording the highest production in 2019 at 8.92 million centimeter-weight (cwt). However, the figure is now at 82% of its peak. This decline is due to several factors. For example, climate change is making growing conditions more unstable, water resource constraints, and labor issues are having an impact. Additionally, market conditions, with fluctuating demand for cauliflower, are also impacting production. California agriculture has become more efficient through technological innovation, but promoting sustainable agricultural practices will become even more important in the future. With growing concerns about food safety and the environment, California’s cauliflower industry must rise to the challenge and pursue sustainable production.


The maximum is 6.31MCWT[2009] of CALIFORNIA, and the current value is about 91.4%
Cauliflower production (latest year, 50 US states)
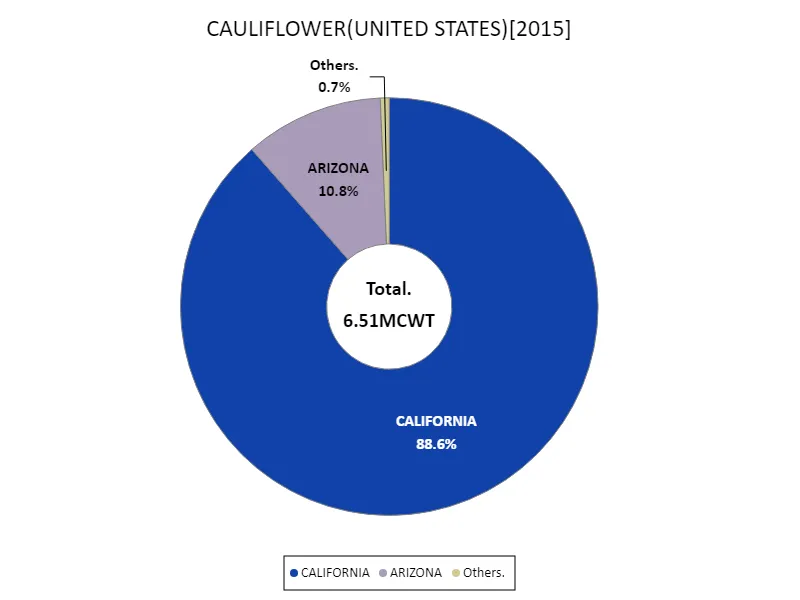
Analyzing annual U.S. cauliflower production from 2023 data, the highest overall production was in California at 7.32 million centimeter-weight (cwt). The national average production was 4.14mcwt, with total production being 8.29mcwt. The data shows that California accounts for the majority of total production, but other states also produce substantially. Over the past few years, U.S. cauliflower production has remained relatively stable, with supply and demand tending to remain in balance. Advances in agricultural technology and improved cultivation methods have contributed to increased productivity. Additionally, cauliflower has been positioned as a popular healthy vegetable among consumers, which supports the stability of demand. On the other hand, factors such as changing climatic conditions and labor challenges are cited as factors affecting production volumes. Water resource constraints in particular are a serious problem in states such as California, making sustainable water management an urgent issue. In the future, it will be necessary to promote more sustainable agricultural practices and establish production systems that can flexibly respond to changes in market demand. The U.S. cauliflower industry must address these challenges while maintaining supply stability and meeting consumer expectations.


The maximum is 5.77MCWT of CALIFORNIA, the average is 2.17MCWT, and the total is 6.51MCWT
Main data
| CAULIFLOWER(ALL CLASSES, ALL PRODUCTION PRACTICES, FRESH MARKET, PRODUCTION, UNITED STATES) [MCWT] | ||||
|---|---|---|---|---|
| US TOTAL | CALIFORNIA | ARIZONA | NEW YORK | |
| 2015 | 6.51 | 5.77 | 0.7 | 0.05 |
| 2014 | 6.29 | 5.51 | 0.72 | 0.06 |
| 2013 | 6.57 | 5.78 | 0.74 | 0.05 |
| 2012 | 6.54 | 5.61 | 0.86 | 0.07 |
| 2011 | 6.4 | 5.69 | 0.66 | 0.05 |
| 2010 | 6.97 | 6.19 | 0.72 | 0.07 |
| 2009 | 7 | 6.31 | 0.64 | 0.05 |
| 2008 | 6.49 | 5.65 | 0.8 | 0.03 |
| 2007 | 6.62 | 5.82 | 0.76 | 0.04 |
| 2006 | 6.68 | 5.58 | 1.06 | 0.04 |
| 2005 | 0.05 | |||
| 2004 | 6.09 | 5.27 | 0.8 | 0.02 |
| 2003 | 6.21 | 5.11 | 1.05 | 0.05 |
| 2002 | 5.84 | 0.81 | ||
| 2001 | 5.92 | 0.9 | ||
| 2000 | 6.35 | 0.92 | ||
| 1999 | 6.67 | 0.88 | ||
| 1998 | 5.47 | 0.71 | ||


Comments