Abstract
Annual asparagus production in the United States is at its highest in recent history at 601,000 cental weight (cwt) in 2023. Asparagus production is affected by advances in agricultural technology and fluctuations in demand. In particular, the production of cultivated asparagus is affected by regionally varying climatic conditions and agricultural policies. In the United States, California is the main producing region, but it is also grown in Washington state and parts of the Gulf Coast. On the demand side, growing health consciousness and the growth of the restaurant industry are affecting production volume, and sustained demand is expected to continue in the future. In the future, adopting sustainable agricultural practices and adapting to the effects of climate change will be key challenges in asparagus production.
Asparagus production volume
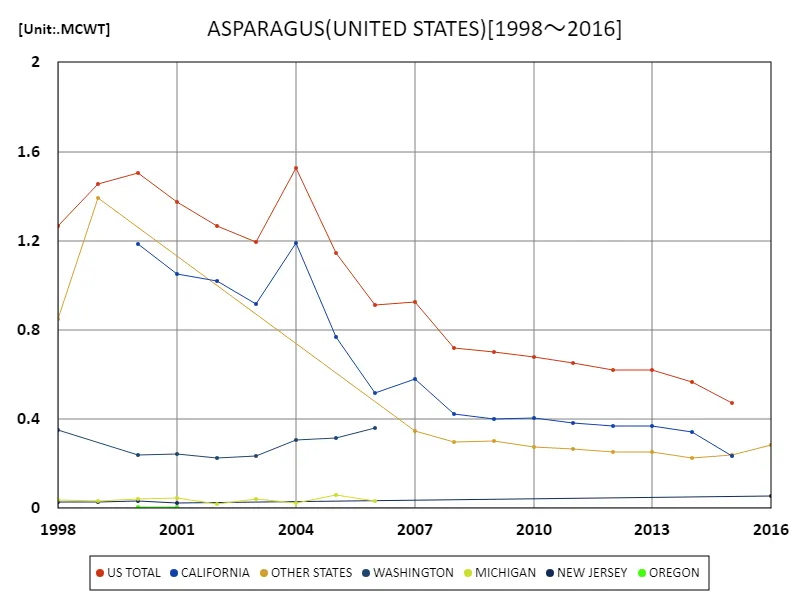
Between 1998 and 2023, the annual production of asparagus in the United States fluctuated. It peaked at 2.27 million cental weights (mcwt) in 2000, but has since shown a slight downward trend and is currently 26.5% lower than its peak level. This variation is due to multiple factors, including advances in agricultural techniques, changing climatic conditions, and fluctuating market demand. California is a major producer, and cultivation areas are expanding both within and outside the state. Asparagus is supported by growing health consciousness and increasing demand from restaurants, and the stability of demand is having a major impact on trends in production volume. In the future, emphasis on sustainable agriculture and adaptation to climate change will be an issue, and efforts to stabilize production volumes will be required.


The maximum is 1.52MCWT[2004] of US TOTAL, and the current value is about 31.1%
Asparagus production (50 US states)
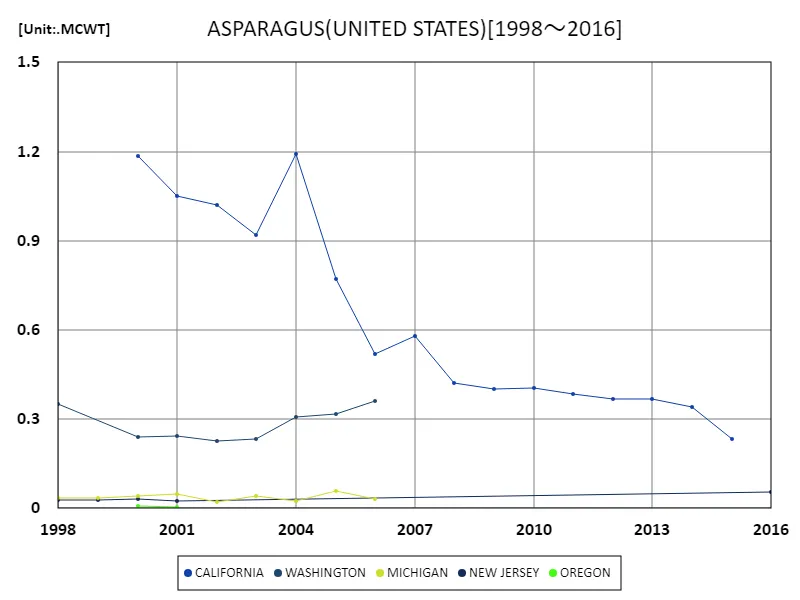
Between 1998 and 2023, annual asparagus production in California fluctuated. It peaked at 1.19 million cental weights (mcwt) in 2004 but has since declined slightly. Current production is 6.29% below its peak. This variation is influenced by advances in agricultural techniques, changing climatic conditions, labour availability, etc. California is the major asparagus-producing region in the United States, and the state’s diverse climate and soil conditions are key to its cultivation. Increasing health consciousness among consumers and changes in demand in the food industry are affecting production volumes, and producers continue to work hard to adapt to fluctuations in demand. In the future, it is expected that an emphasis on sustainable agriculture and technological innovation will contribute to stabilizing California’s asparagus production.


The maximum is 1.19MCWT[2004] of CALIFORNIA, and the current value is about 19.7%
Asparagus production (latest year, 50 US states)
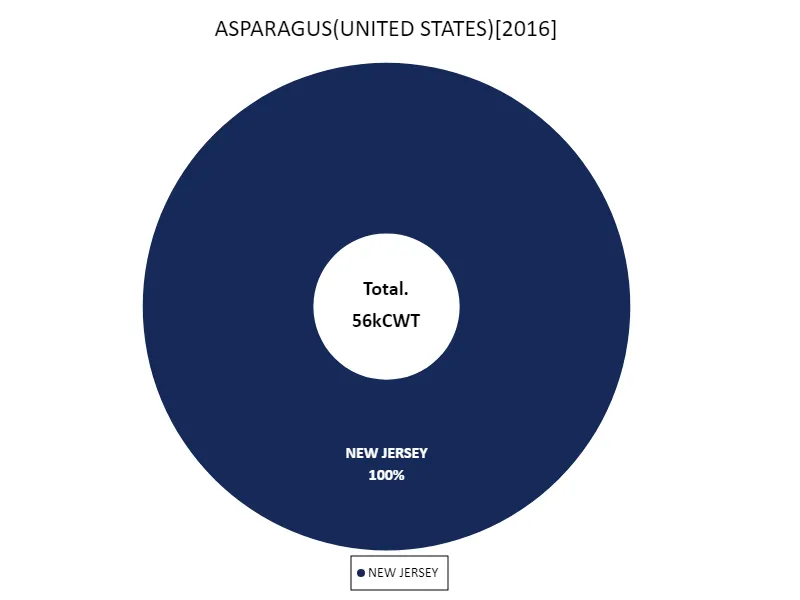
Looking at the annual asparagus production in the United States, Michigan recorded the largest production in 2023 (296,000 cental weights). The overall average production is 178,000 cental weights, with a total production of 357,000 cental weights. These figures show that asparagus production varies from region to region. Despite Michigan’s cold climate, the state has achieved high productivity through the use of certain agricultural techniques and varietal selection. Overall U.S. production remains stable, with supply adjusting according to demand. Increasing health consciousness among consumers and diversifying food cultures are supporting the demand for asparagus. In the future, adopting sustainable agricultural practices and responding to the effects of climate change will be key factors influencing asparagus production. Producers are sensitive to changes in the market and continue to make efforts to maintain production while maintaining quality and safety.


The maximum is 56kCWT of NEW JERSEY, the average is 56kCWT, and the total is 56kCWT
Main data
| ASPARAGUS(ALL CLASSES, ALL PRODUCTION PRACTICES, FRESH MARKET, PRODUCTION, UNITED STATES) [kCWT] | ||
|---|---|---|
| OTHER STATES | NEW JERSEY | |
| 2016 | 282 | 56 |
| 2015 | 240 | |
| 2014 | 227 | |
| 2013 | 252 | |
| 2012 | 252 | |
| 2011 | 266 | |
| 2010 | 276 | |
| 2009 | 303 | |
| 2008 | 297 | |
| 2007 | 347 | |
| 2006 | ||
| 2005 | ||
| 2004 | ||
| 2003 | ||
| 2002 | ||
| 2001 | 26 | |
| 2000 | 32 | |
| 1999 | 1393 | 28 |
| 1998 | 849 | 27 |


Comments