Abstract
In the U.S., sugarcane and sugarbeet are key crops for sugar production. Over the years, sugarcane, primarily cultivated in Louisiana and Florida, has seen steady yield improvements due to advances in farming technology and plant breeding. For 2022, Louisiana led with a yield of 58.7 USD/t, showcasing the region’s favorable climate and refined cultivation techniques. Sugarbeet, grown mainly in northern states like Minnesota and North Dakota, also plays a significant role in sugar output. Yield trends for both crops have been influenced by factors like weather patterns, pest management, and market demand. Sustainable farming practices are expected to drive future yield increases.
Average price (sugar cane)
From 1978 to 2022, U.S. sugarcane production has shown notable regional and temporal variations. Hawaii reached its peak yield in 2011 at 60.7 USD/t, but by 2022, it had declined to 67.1% of that peak level, reflecting shifts in land use, labor costs, and market dynamics. While Hawaii once led the U.S. in sugarcane production, states like Louisiana and Florida now dominate due to their favorable climates and modern agricultural practices. Louisiana, in particular, has seen steady improvements in yield efficiency. The overall trend shows U.S. sugarcane production adapting to both economic and environmental pressures, with advancements in technology aiding sustainability and productivity.
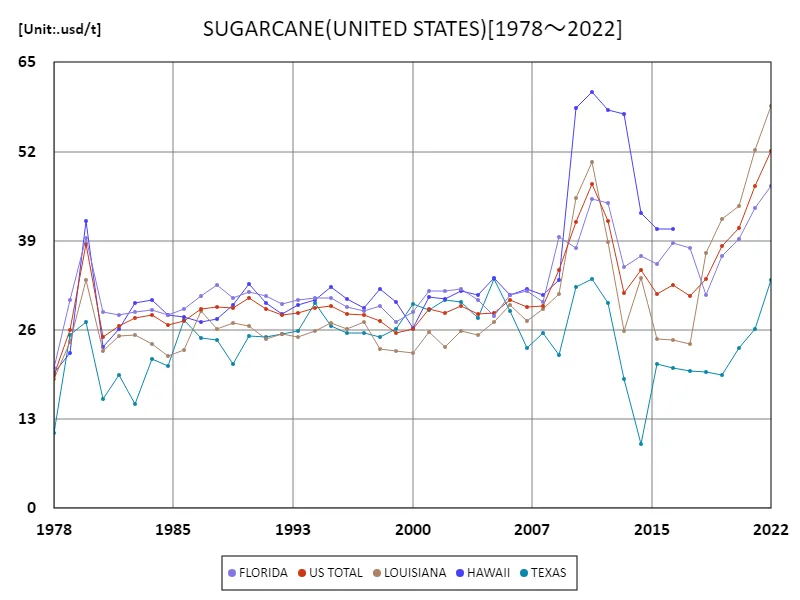

The maximum is 60.7usd/t[2011] of HAWAII, and the current value is about 67.1%
Average price (sugar cane, latest year)
In 2022, Louisiana reached its peak sugarcane yield at 58.7 USD/t, marking a significant milestone in U.S. sugarcane production. Louisiana’s consistent performance is attributed to optimal growing conditions, advanced farming techniques, and investments in sustainable agriculture. Unlike regions like Hawaii, which have seen declines, Louisiana remains at 100% of its peak production, maintaining its dominance in the U.S. sugar industry. The state’s focus on improving pest management, water usage, and crop resilience has positioned it as a leader, reflecting broader trends in enhancing agricultural efficiency amidst climate and economic challenges.
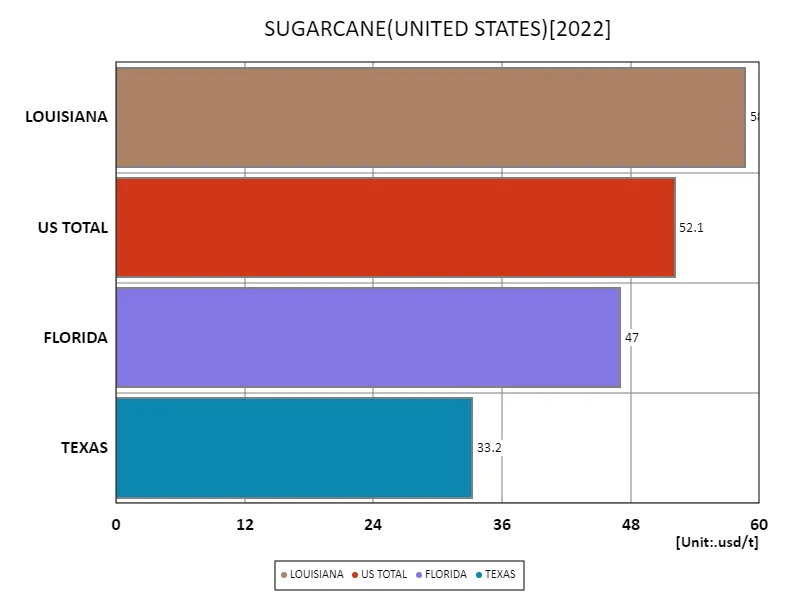

The maximum is 58.7usd/t of LOUISIANA, the average is 47.8usd/t, and the total is 191usd/t
Average price (Sugarbeets)
In 1909, Michigan led the U.S. in sugar beet production, recording the highest yield at 87.7 USD/ton, with a national average of 70.1 USD/ton and a total of 793 USD/ton. This early 20th-century period marked a significant rise in sugar beet farming, driven by growing domestic demand for sugar. Michigan’s favorable soil and climate conditions contributed to its leadership in production. Over time, advancements in farming practices, mechanization, and hybrid crop development improved yields across the country. While Michigan’s dominance has waned, the U.S. continues to be a major global producer of sugar beets, with modern trends emphasizing sustainability and efficiency.
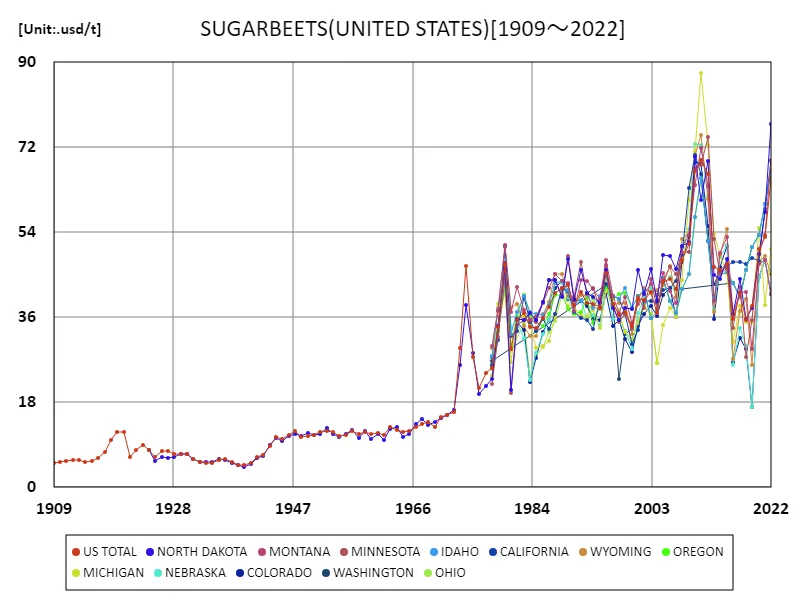

The maximum is 87.7usd/t[2011] of MICHIGAN, and the current value is about 57.6%
Average price (Sugarbeats, latest year)
In 2022, North Dakota led U.S. sugar beet production with a yield of 76.9 USD/t, while the national average stood at 58.3 USD/t, totaling 700 USD/t. Sugar beet farming has long been a vital part of U.S. agriculture, particularly in northern states like North Dakota and Minnesota, where cool climates favor growth. Over the years, improvements in seed technology, pest control, and irrigation have driven yield increases. North Dakota’s top performance reflects the state’s commitment to modern farming techniques and crop management. As sustainability and efficiency become priorities, U.S. sugar beet production continues to adapt to economic and environmental challenges.
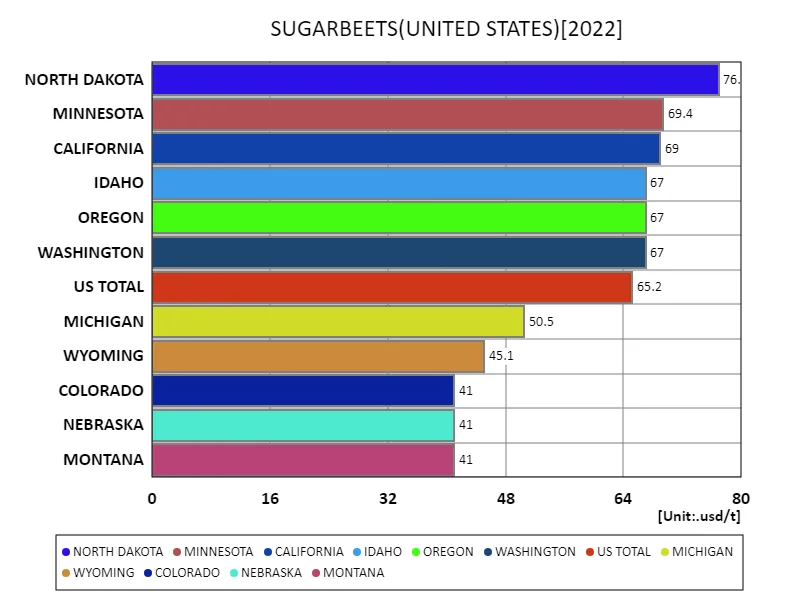

The maximum is 76.9usd/t of NORTH DAKOTA, the average is 58.3usd/t, and the total is 700usd/t
Main data
| SUGARCANE(ALL CLASSES, ALL PRODUCTION PRACTICES, SUGAR, PRICE RECEIVED, UNITED STATES) [usd/t] | ||||
|---|---|---|---|---|
| LOUISIANA | US TOTAL | FLORIDA | TEXAS | |
| 2022 | 58.7 | 52.1 | 47 | 33.2 |
| 2021 | 52.2 | 46.9 | 43.8 | 26.2 |
| 2020 | 44 | 40.9 | 39.3 | 23.3 |
| 2019 | 42.1 | 38.3 | 36.7 | 19.5 |
| 2018 | 37.2 | 33.4 | 31.1 | 19.8 |
| 2017 | 23.9 | 31 | 37.9 | 20 |
| 2016 | 24.6 | 32.6 | 38.7 | 20.5 |
| 2015 | 24.7 | 31.2 | 35.6 | 21.1 |
| 2014 | 33.6 | 34.7 | 36.8 | 9.41 |
| 2013 | 25.9 | 31.4 | 35.1 | 18.8 |
| 2012 | 38.8 | 41.9 | 44.5 | 29.9 |
| 2011 | 50.4 | 47.2 | 45.1 | 33.4 |
| 2010 | 45.2 | 41.7 | 38 | 32.2 |
| 2009 | 31.3 | 34.8 | 39.5 | 22.3 |
| 2008 | 29.1 | 29.5 | 30.1 | 25.5 |
| 2007 | 27.3 | 29.4 | 31.6 | 23.4 |
| 2006 | 29.6 | 30.4 | 31.1 | 28.7 |
| 2005 | 27.1 | 28.4 | 28 | 33.4 |
| 2004 | 25.3 | 28.3 | 30.3 | 27.7 |
| 2003 | 25.8 | 29.5 | 31.9 | 30.1 |
| 2002 | 23.5 | 28.4 | 31.7 | 30.3 |
| 2001 | 25.7 | 29 | 31.7 | 28.9 |
| 2000 | 22.7 | 26.1 | 28.6 | 29.8 |
| 1999 | 22.9 | 25.6 | 27.2 | 26.1 |
| 1998 | 23.2 | 27.3 | 29.5 | 24.9 |
| 1997 | 27.1 | 28.1 | 28.7 | 25.6 |
| 1996 | 26.2 | 28.3 | 29.4 | 25.5 |
| 1995 | 27 | 29.5 | 30.6 | 26.6 |
| 1994 | 25.9 | 29.2 | 30.6 | 29.9 |
| 1993 | 25 | 28.5 | 30.4 | 25.8 |
| 1992 | 25.4 | 28.1 | 29.8 | 25.4 |
| 1991 | 24.7 | 29 | 31 | 25 |
| 1990 | 26.6 | 30.7 | 31.5 | 25.1 |
| 1989 | 27 | 29.2 | 30.7 | 21 |
| 1988 | 26.2 | 29.4 | 32.6 | 24.6 |
| 1987 | 28.7 | 29.1 | 30.9 | 24.8 |
| 1986 | 23.1 | 27.3 | 29 | 27.5 |
| 1985 | 22.2 | 26.7 | 28.2 | 20.7 |
| 1984 | 23.9 | 28.2 | 28.9 | 21.7 |
| 1983 | 25.3 | 27.8 | 28.6 | 15.2 |
| 1982 | 25.1 | 26.5 | 28.2 | 19.5 |
| 1981 | 22.9 | 24.9 | 28.6 | 15.9 |
| 1980 | 33.2 | 38.5 | 39.4 | 27.1 |
| 1979 | 24.2 | 26 | 30.3 | 25.2 |
| 1978 | 18.9 | 19.5 | 20.5 | 11 |


Comments