Abstract
The annual tobacco and hops harvest in the United States varies widely from state to state. The Southern states are the major producers of tobacco, especially North Carolina and Kentucky. These states have a long history of growing tobacco as a major agricultural crop and tend to produce high yields. Hops production, on the other hand, is concentrated primarily in Washington, Oregon, and Idaho. The climatic conditions in these states are ideal for growing hops, with Washington state being the largest producer. While tobacco prices are stable, hops are often affected by fluctuations in beer demand, and the recent boom in craft beer has led to increased demand and increased production. Both are highly dependent on local climatic conditions and market demand.
Average price (tobacco)
American tobacco production underwent major changes between 1919 and 2012. In particular, Massachusetts reached the peak of its annual harvest in 1997, garnering attention for its high price of $9.50 per pound. However, Massachusetts’ current harvest is down to 65.3 percent of its peak, reflecting changes in the tobacco industry overall. In the early to mid-20th century, the southern states of the United States, especially North Carolina and Kentucky, established themselves as major tobacco growing areas, and production in these states increased. This was due to an increase in demand for tobacco and improvements in agricultural techniques. On the other hand, from the late 1990s to the 2000s, tobacco production has been on the decline due to increased concern about health issues, stricter regulations, and a decrease in smoking rates. Former major producers, particularly in Massachusetts, have also experienced significant declines in production. In recent years, while tobacco farmers have been seeking to diversify their income, agricultural efficiency and environmental considerations have also become important issues. Overall, tobacco production in the United States is down from past peaks, but production still continues in some areas.
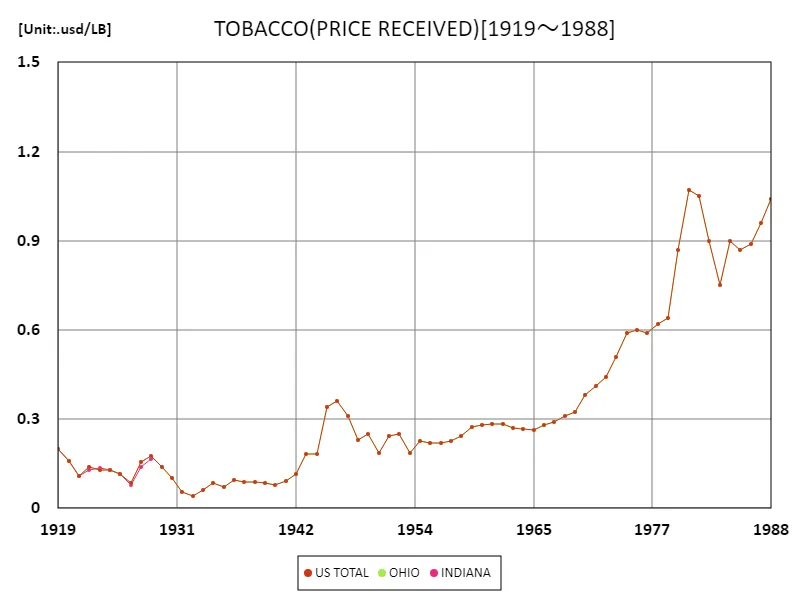

The maximum is 1.07usd/LB[1980] of US TOTAL, and the current value is about 97.2%
Average price (Tobacco, latest year)
According to data from 2012, Connecticut recorded the peak annual harvest in US tobacco production, with a price of $6.6 per pound. Connecticut’s harvest during this time was 100% of its peak, indicating that the state’s tobacco industry was in its heyday. Connecticut has traditionally produced high-quality tobacco, and its geography and climate are well suited to the industry, leading to high yields and prices. During this period in particular, demand for tobacco was stable, so production was maximized. However, the tobacco industry is experiencing a decline in overall demand due to increased awareness of health risks and stricter regulations. As a result, Connecticut’s tobacco production may decline in the long term, but as of 2012 it peaked, making it an important indicator of the strength and sustainability of the state’s tobacco industry.
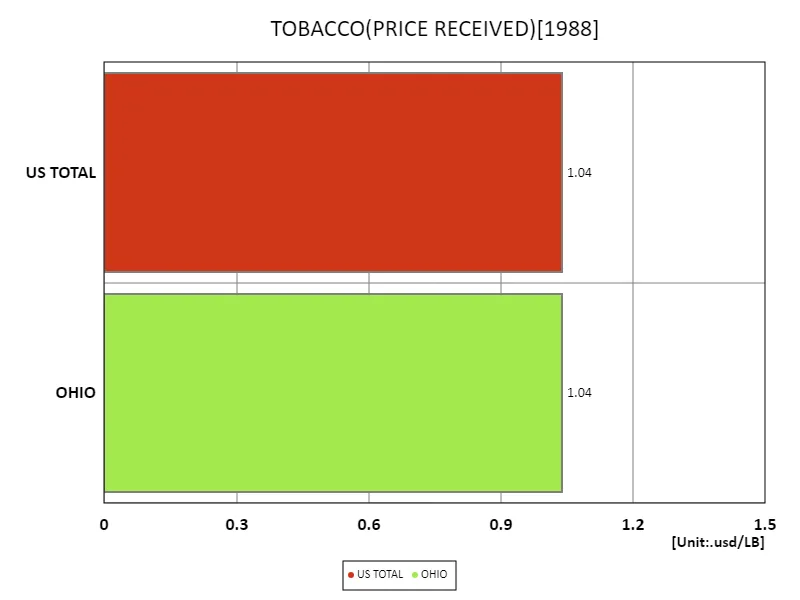

The maximum is 1.04usd/LB of US TOTAL, the average is 1.04usd/LB, and the total is 2.08usd/LB
Average price (hops)
Data from 1915 shows that Oregon played a prominent role in American hop production, with the annual harvest valued at $6.35 per pound. During this time, Oregon produced the largest share of the hops harvest in the United States, making it the center of the hops industry. The average price of hops at the time was $6.17/lb, with prices in Oregon even higher. This indicates that Oregon was a major producer of hops and was providing a quality product. The overall total yield was 18.5 USD/lb, indicating steady growth of the hops industry. The year 1915 was a booming period for the hops industry, with increasing demand for beer in the United States boosting hop production. Oregon’s climate and soil are ideal for growing hops, so the state quickly established itself as a major producer of hops. Today, Oregon remains a center of hop production, and its quality and quantity are highly regarded both in the United States and abroad. The 1915 data provides a valuable insight into the characteristics and trends of the hops industry at that time.
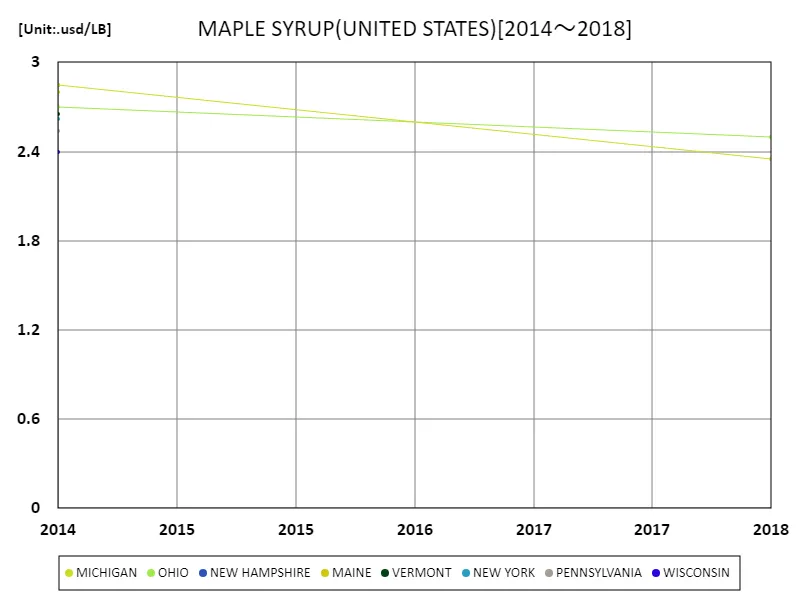

The maximum is 2.85usd/LB[2014] of MICHIGAN, and the current value is about 82.5%
Average price (hops, latest year)
Based on 2023 data, Oregon continues to play a leading role in the American hops industry, recording the highest price at $6.15 per pound for the annual harvest. This price demonstrates that Oregon maintains a strong market position with a steady supply of high-quality hops. The overall average price was $5.56/lb, which reflects the standard market price for hops across the US. Total hop yield was 22.3 usd/lb, indicating an increase in size and production across the industry. This increase is driven by rising demand, particularly due to the expansion of the craft beer market. Historically, hop production in the United States has been concentrated in the state of Oregon, where high quality and stable supply have made the product highly competitive in the market. Hop production is also diversifying, with new varieties and production techniques being introduced to help balance overall yields and prices. This allows the American hops industry to remain competitive while adapting to changing market needs.
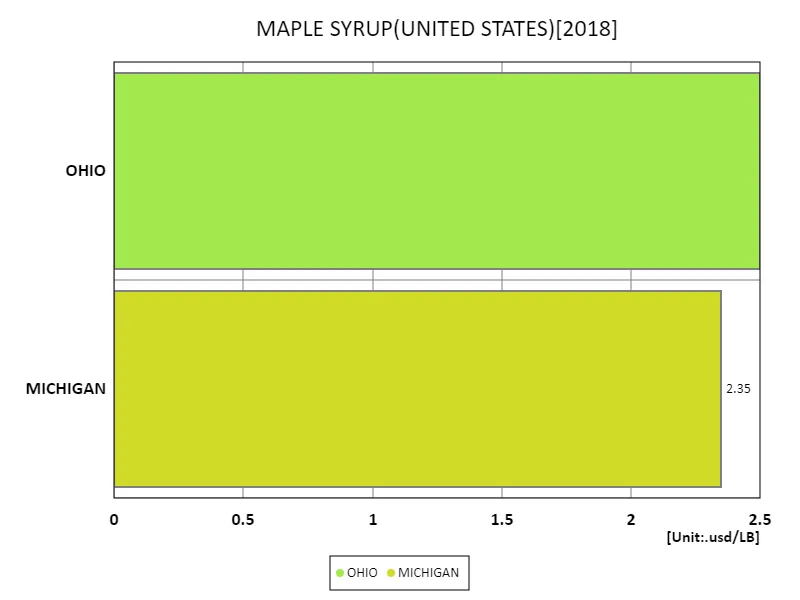

The maximum is 2.5usd/LB of OHIO, the average is 2.43usd/LB, and the total is 4.85usd/LB
Main data
| TOBACCO(CIGAR FILLER OHIO-MIAMI VALLEY, TYPE 42-44, ALL PRODUCTION PRACTICES, ALL UTILIZATION PRACTICES, PRICE RECEIVED, UNITED STATES) [usd/LB] | ||
|---|---|---|
| OHIO | US TOTAL | |
| 1988 | 1.04 | 1.04 |
| 1987 | 0.96 | 0.96 |
| 1986 | 0.89 | 0.89 |
| 1985 | 0.87 | 0.87 |
| 1984 | 0.9 | 0.9 |
| 1983 | 0.75 | 0.75 |
| 1982 | 0.9 | 0.9 |
| 1981 | 1.05 | 1.05 |
| 1980 | 1.07 | 1.07 |
| 1979 | 0.87 | 0.87 |
| 1978 | 0.64 | 0.64 |
| 1977 | 0.62 | 0.62 |
| 1976 | 0.59 | 0.59 |
| 1975 | 0.6 | 0.6 |
| 1974 | 0.59 | 0.59 |
| 1973 | 0.51 | 0.51 |
| 1972 | 0.44 | 0.44 |
| 1971 | 0.41 | 0.41 |
| 1970 | 0.38 | 0.38 |
| 1969 | 0.33 | 0.33 |
| 1968 | 0.31 | 0.31 |
| 1967 | 0.29 | 0.29 |
| 1966 | 0.28 | 0.28 |
| 1965 | 0.26 | 0.26 |
| 1964 | 0.27 | 0.27 |
| 1963 | 0.27 | 0.27 |
| 1962 | 0.28 | 0.28 |
| 1961 | 0.28 | 0.28 |
| 1960 | 0.28 | 0.28 |
| 1959 | 0.27 | 0.27 |
| 1958 | 0.24 | 0.24 |
| 1957 | 0.23 | 0.23 |
| 1956 | 0.22 | 0.22 |
| 1955 | 0.22 | 0.22 |
| 1954 | 0.23 | 0.23 |
| 1953 | 0.19 | 0.19 |
| 1952 | 0.25 | 0.25 |
| 1951 | 0.24 | 0.24 |
| 1950 | 0.19 | 0.19 |
| 1949 | 0.25 | 0.25 |
| 1948 | 0.23 | 0.23 |
| 1947 | 0.31 | 0.31 |
| 1946 | 0.36 | 0.36 |
| 1945 | 0.34 | 0.34 |
| 1944 | 0.18 | 0.18 |
| 1943 | 0.18 | 0.18 |
| 1942 | 0.12 | 0.12 |
| 1941 | 0.09 | 0.09 |
| 1940 | 0.08 | 0.08 |
| 1939 | 0.08 | 0.08 |
| 1938 | 0.09 | 0.09 |
| 1937 | 0.09 | 0.09 |
| 1936 | 0.1 | 0.1 |
| 1935 | 0.07 | 0.07 |
| 1934 | 0.09 | 0.09 |
| 1933 | 0.06 | 0.06 |
| 1932 | 0.04 | 0.04 |
| 1931 | 0.06 | 0.06 |
| 1930 | 0.1 | 0.1 |
| 1929 | 0.14 | 0.14 |
| 1928 | 0.18 | 0.18 |
| 1927 | 0.16 | 0.16 |
| 1926 | 0.09 | 0.09 |
| 1925 | 0.11 | 0.11 |
| 1924 | 0.13 | 0.13 |
| 1923 | 0.13 | 0.13 |
| 1922 | 0.14 | 0.14 |
| 1921 | 0.11 | 0.11 |
| 1920 | 0.16 | 0.16 |
| 1919 | 0.2 | 0.2 |


Comments