Abstract
The average annual prices of apricots and avocados have fluctuated significantly over the years due to various factors such as crop yield, demand, and climatic conditions. For apricots, the U.S. price per ton reached 1.14 kUSD in 2022, influenced by smaller harvests and increasing input costs. Historically, apricot prices have shown moderate stability but are prone to spikes during years of lower production due to weather extremes.In contrast, avocado prices have seen notable increases over the past decade, driven by surging global demand and limited growing regions. Countries like Mexico and the U.S. are key players in avocado production, but factors such as drought and disease continue to impact crop yields and, consequently, market prices.
Average price (Apricot)
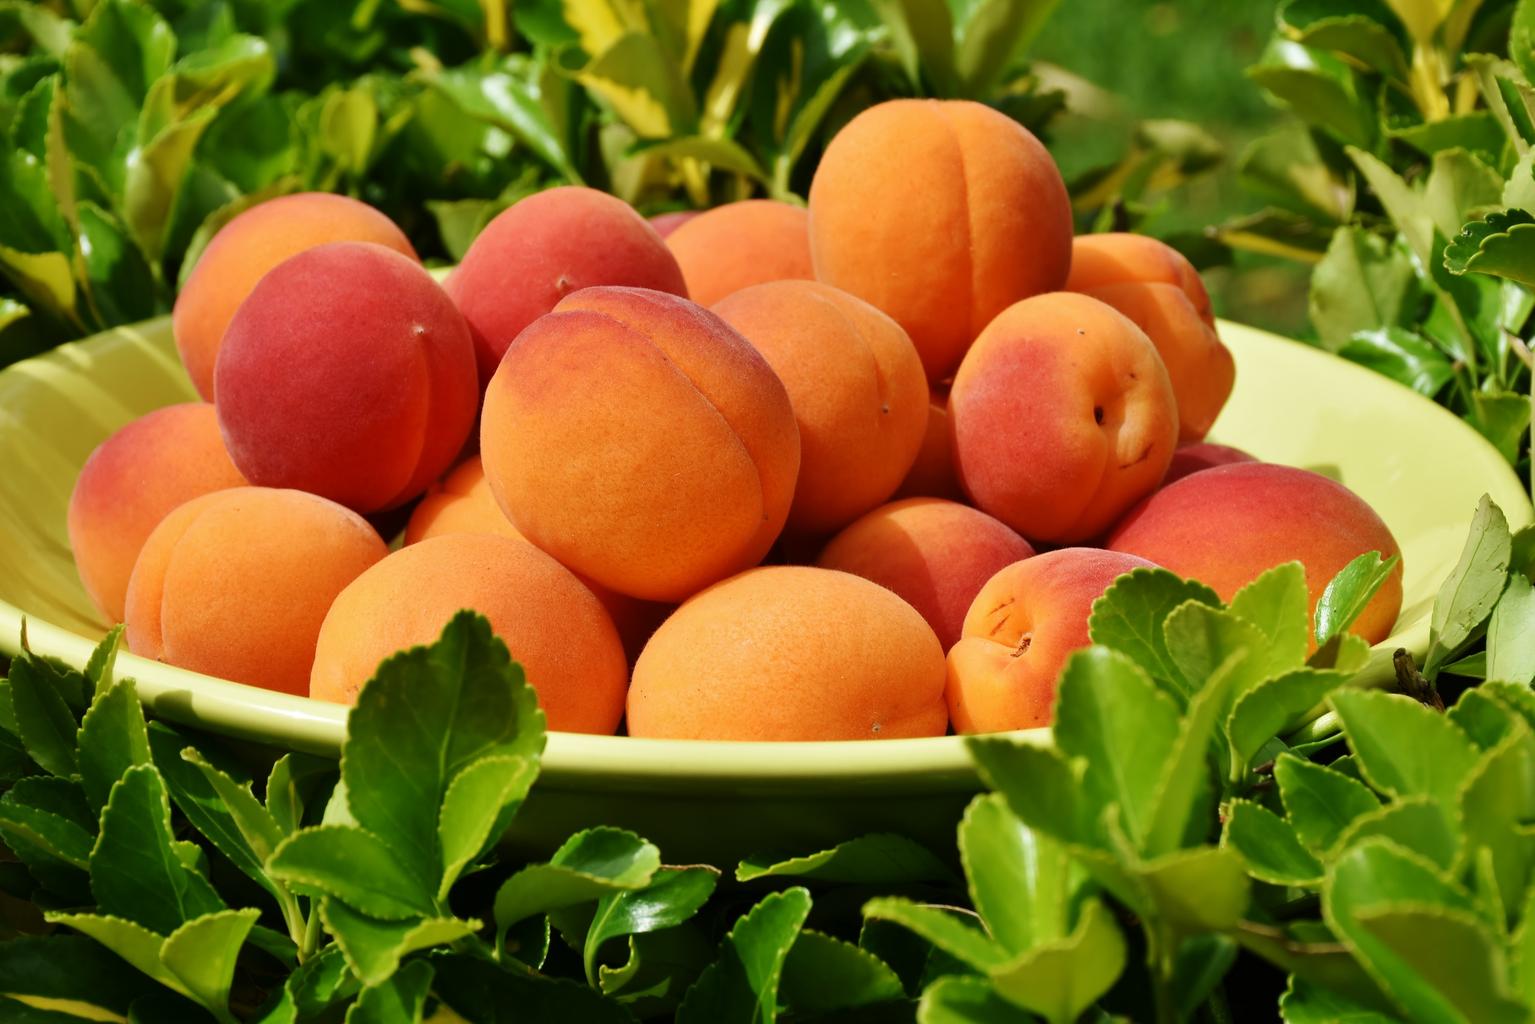
The average annual price of American apricot fruit nuts has shown considerable fluctuations from 1909 to 2022, reflecting shifts in production, climate, and market dynamics. The peak price of 1.72 kUSD per ton in 2015, recorded in California, marked a high driven by reduced yields due to drought conditions and rising production costs. As of the latest data, California’s price is now at 69.8% of this peak, indicating a downward adjustment likely due to improved supply but still elevated costs.Over time, apricot prices in the U.S. have been sensitive to environmental factors, with droughts and frost events causing price surges. As the largest producer, California’s trends largely set the national market tone, where resilience in pricing continues despite the challenges of climate variability.
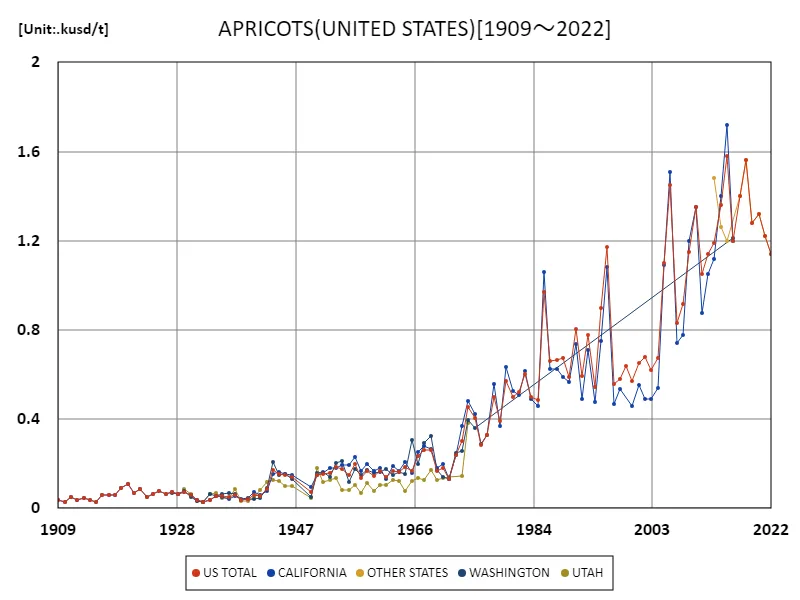

The maximum is 1.72kusd/t[2015] of CALIFORNIA, and the current value is about 69.8%
Average price (Apricot, latest year)
In 2022, the average annual price of American apricot fruit nuts in the U.S. reached a peak of 1.14 kUSD per ton, the highest recorded in available data. This price level reflects increased production costs, including labor, water, and agricultural inputs, alongside a steady demand for apricots both domestically and internationally.This peak highlights the sensitivity of apricot prices to rising operational expenses and environmental pressures affecting yield. As of 2022, with prices at 100% of this high, the industry is facing challenges balancing production costs with market demand, suggesting that continued cost pressures or yield variability could impact future prices.
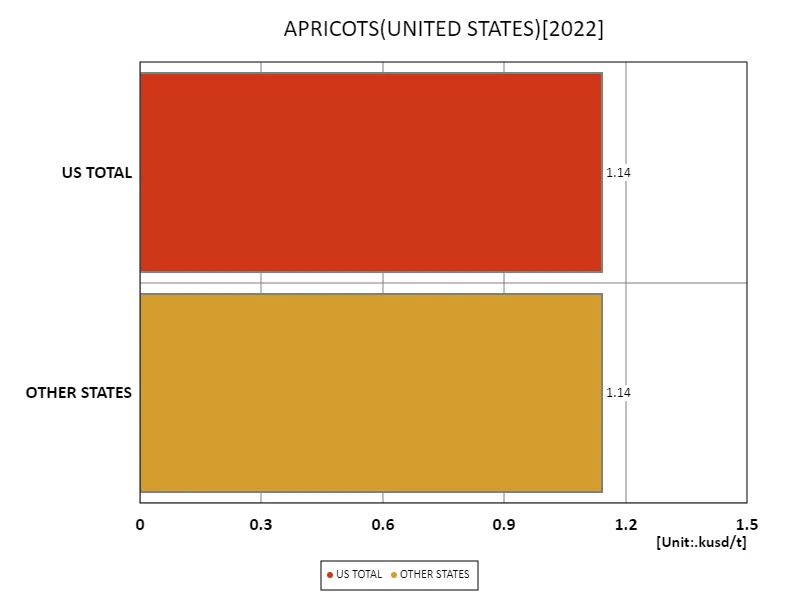

The maximum is 1.14kusd/t of US TOTAL, the average is 1.14kusd/t, and the total is 2.28kusd/t
Average price (avocado)
As of the latest data from 1924, the average annual price for American avocado fruit nuts was recorded at 3.22 kUSD per ton, marking a peak for the period. This price reflects early market conditions when avocados were still a specialty crop with limited production and high value. With an overall total market value of 8.13 kUSD per ton, avocados commanded premium prices due to their novelty and the small-scale nature of cultivation at the time.These high prices in 1924 underscore the uniqueness of avocados in the early 20th century. Since then, increased production and consumer familiarity have driven avocados into a mainstream position, altering pricing dynamics significantly in later decades.
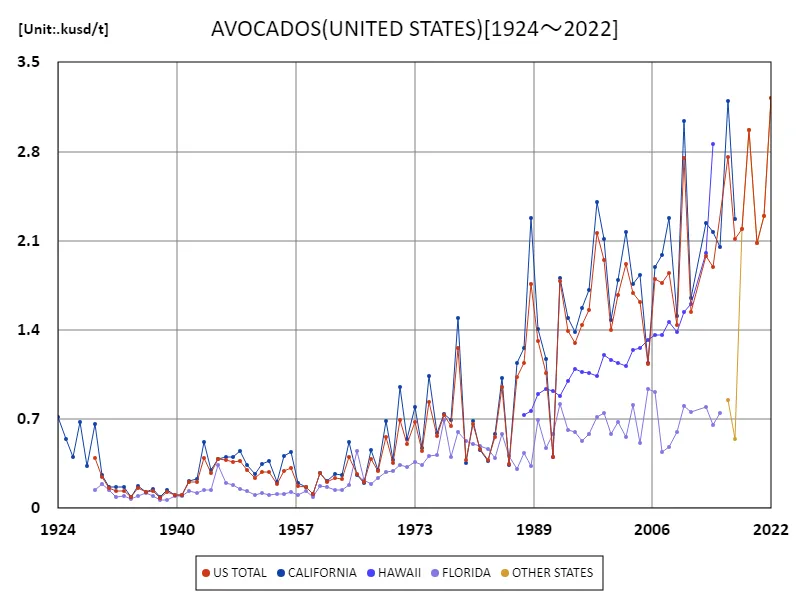

The maximum is the latest one, 3.22kusd/t of US TOTAL
Average price (avocado, latest year)
As of 2022, the U.S. achieved a peak price of 3.22 kUSD per ton for avocados across all classes, with an overall market value totaling 6.44 kUSD per ton. This price reflects heightened demand for avocados both domestically and globally, alongside rising production costs and the impact of climatic challenges on supply. Avocados, once a niche crop, have become a staple, especially with trends favoring health-conscious diets, leading to consistently strong demand.However, production faces challenges such as water scarcity and high labor costs, particularly in major growing areas like California. These factors contribute to maintaining elevated prices, which may persist as demand continues to outpace supply capabilities.
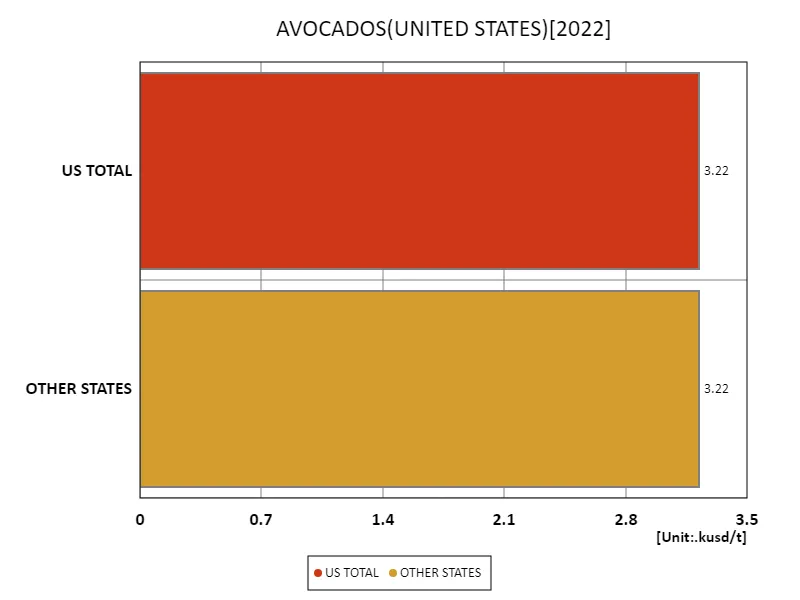

The maximum is 3.22kusd/t of US TOTAL, the average is 3.22kusd/t, and the total is 6.44kusd/t
Main data
| APRICOTS(ALL CLASSES, ALL PRODUCTION PRACTICES, FRESH MARKET, PRICE RECEIVED, UNITED STATES) [kusd/t] | ||
|---|---|---|
| US TOTAL | OTHER STATES | |
| 2022 | 1.14 | 1.14 |
| 2021 | 1.22 | 1.22 |
| 2020 | 1.32 | 1.32 |
| 2019 | 1.28 | 1.28 |
| 2018 | 1.56 | 1.56 |
| 2017 | 1.4 | 1.4 |
| 2016 | 1.2 | |
| 2015 | 1.58 | 1.2 |
| 2014 | 1.36 | 1.26 |
| 2013 | 1.19 | 1.48 |
| 2012 | 1.14 | |
| 2011 | 1.05 | |
| 2010 | 1.35 | |
| 2009 | 1.15 | |
| 2008 | 0.92 | |
| 2007 | 0.83 | |
| 2006 | 1.45 | |
| 2005 | 1.1 | |
| 2004 | 0.67 | |
| 2003 | 0.62 | |
| 2002 | 0.68 | |
| 2001 | 0.65 | |
| 2000 | 0.57 | |
| 1999 | 0.64 | |
| 1998 | 0.58 | |
| 1997 | 0.56 | |
| 1996 | 1.17 | |
| 1995 | 0.9 | |
| 1994 | 0.55 | |
| 1993 | 0.78 | |
| 1992 | 0.59 | |
| 1991 | 0.8 | |
| 1990 | 0.59 | |
| 1989 | 0.68 | |
| 1988 | 0.67 | |
| 1987 | 0.66 | |
| 1986 | 0.97 | |
| 1985 | 0.49 | |
| 1984 | 0.5 | |
| 1983 | 0.6 | |
| 1982 | 0.52 | |
| 1981 | 0.5 | |
| 1980 | 0.57 | |
| 1979 | 0.39 | |
| 1978 | 0.5 | |
| 1977 | 0.33 | |
| 1976 | 0.29 | |
| 1975 | 0.41 | |
| 1974 | 0.46 | |
| 1973 | 0.3 | |
| 1972 | 0.24 | |
| 1971 | 0.13 | |
| 1970 | 0.18 | |
| 1969 | 0.17 | |
| 1968 | 0.26 | |
| 1967 | 0.26 | |
| 1966 | 0.23 | |
| 1965 | 0.17 | |
| 1964 | 0.18 | |
| 1963 | 0.16 | |
| 1962 | 0.17 | |
| 1961 | 0.14 | |
| 1960 | 0.17 | |
| 1959 | 0.15 | |
| 1958 | 0.17 | |
| 1957 | 0.14 | |
| 1956 | 0.2 | |
| 1955 | 0.15 | |
| 1954 | 0.18 | |
| 1953 | 0.19 | |
| 1952 | 0.16 | |
| 1951 | 0.15 | |
| 1950 | 0.15 | |
| 1949 | 0.07 | |
| 1946 | 0.14 | |
| 1945 | 0.15 | |
| 1944 | 0.16 | |
| 1943 | 0.17 | |
| 1942 | 0.09 | |
| 1941 | 0.05 | |
| 1940 | 0.06 | |
| 1939 | 0.04 | |
| 1938 | 0.04 | |
| 1937 | 0.06 | |
| 1936 | 0.05 | |
| 1935 | 0.05 | |
| 1934 | 0.06 | |
| 1933 | 0.04 | |
| 1932 | 0.03 | |
| 1931 | 0.04 | |
| 1930 | 0.06 | |
| 1929 | 0.07 | |
| 1928 | 0.06 | |
| 1927 | 0.07 | |
| 1926 | 0.06 | |
| 1925 | 0.08 | |
| 1924 | 0.06 | |
| 1923 | 0.05 | |
| 1922 | 0.09 | |
| 1921 | 0.07 | |
| 1920 | 0.11 | |
| 1919 | 0.09 | |
| 1918 | 0.06 | |
| 1917 | 0.06 | |
| 1916 | 0.06 | |
| 1915 | 0.03 | |
| 1914 | 0.04 | |
| 1913 | 0.04 | |
| 1912 | 0.04 | |
| 1911 | 0.05 | |
| 1910 | 0.03 | |
| 1909 | 0.04 | |


Comments