Abstract
The average annual price of peach and nectarine fruit nuts in the United States varies widely depending on crop supply, weather conditions and market demand. According to 2022 data, the price of cultivated peaches in other states is up to $1.74k USD/ton, which reflects the price trend over the past few years. Peach and nectarine prices are often driven by the yield and quality of the crop in major growing regions such as California. Prices tend to spike, especially during droughts and extreme weather events. Changing consumer tastes and import/export policies also affect prices. Overall, stable supply keeps prices down, but the market is prone to price fluctuations based on weather conditions and market trends.
Average price (Peach)
From 1996 to 2022, American peach prices exhibited notable fluctuations. The peak price of $3.20 per ton was recorded in Massachusetts in 2012, reflecting high demand or limited supply. Since then, prices have generally declined, with Massachusetts currently at 86.6% of its 2012 peak. This trend suggests market adjustments and potentially increased production or competition. Despite regional variations, the overall pattern indicates a stabilizing market, influenced by factors such as supply chain changes and shifts in consumer preferences.
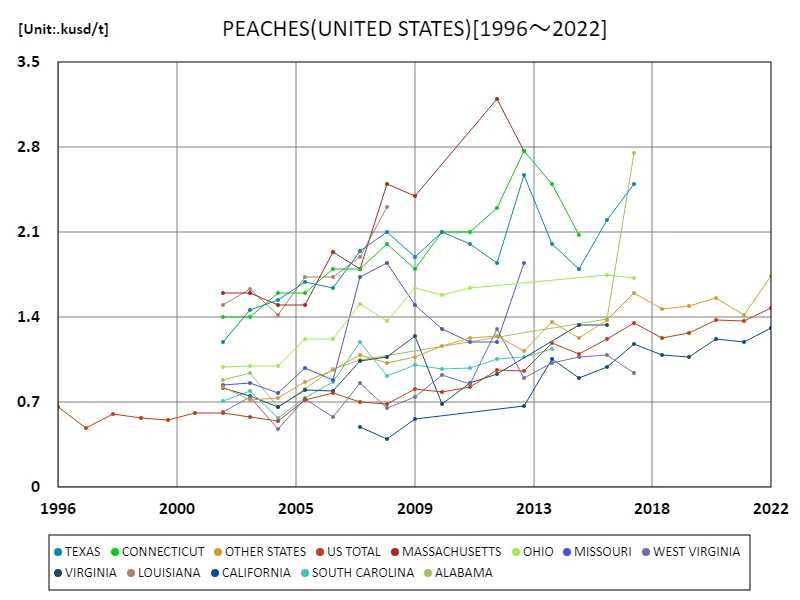

The maximum is 3.2kusd/t[2012] of MASSACHUSETTS, and the current value is about 86.6%
Average price (Peach, latest year)
In 2022, American peach fruit nut prices peaked at $2.10 per ton in New Jersey, where they remain at this high level. This stability suggests a robust market condition and effective supply chain management in the region. The peak price reflects strong demand or limited supply, positioning New Jersey as a significant player in the peach nut market. The absence of prior years’ data limits trend analysis, but current stability indicates a favorable environment for producers and suggests potential future growth if demand persists.
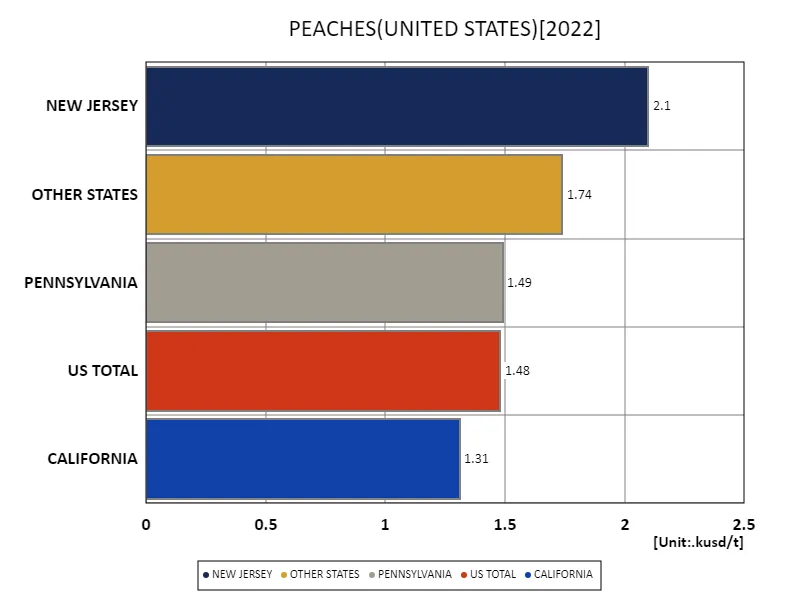

The maximum is 2.1kusd/t of NEW JERSEY, the average is 1.62kusd/t, and the total is 8.12kusd/t
Average price (nectarine)
In 1999, the average price of American nectarine fruit nuts was $1.30 per ton, matching the highest overall rate. The total price for nectarines reached $2.60 per ton, indicating a significant market value. This consistency suggests a stable market environment for nectarines at that time. With limited data beyond 1999, it’s challenging to assess long-term trends, but the stable pricing reflects strong market conditions and steady demand. The pricing dynamics indicate that nectarines were valued competitively within the fruit nut market during this period.
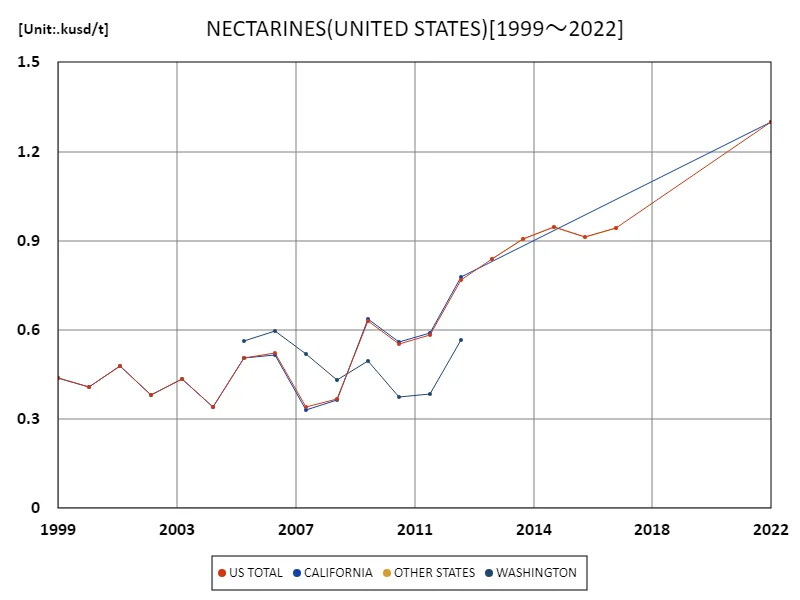

The maximum is the latest one, 1.3kusd/t of US TOTAL
Average price (Nectarine, latest year)
In 2022, nectarine prices in the U.S. reached a high of $1.30 per ton, aligning with the average price for this period. The total value for nectarines was $2.60 per ton, reflecting a consistent market rate. This stability indicates a steady demand and balanced supply in the U.S. nectarines market. The uniformity between the peak and average prices suggests minimal volatility and a well-regulated market environment. Overall, these figures highlight a stable and established market for nectarines in the U.S. in 2022.
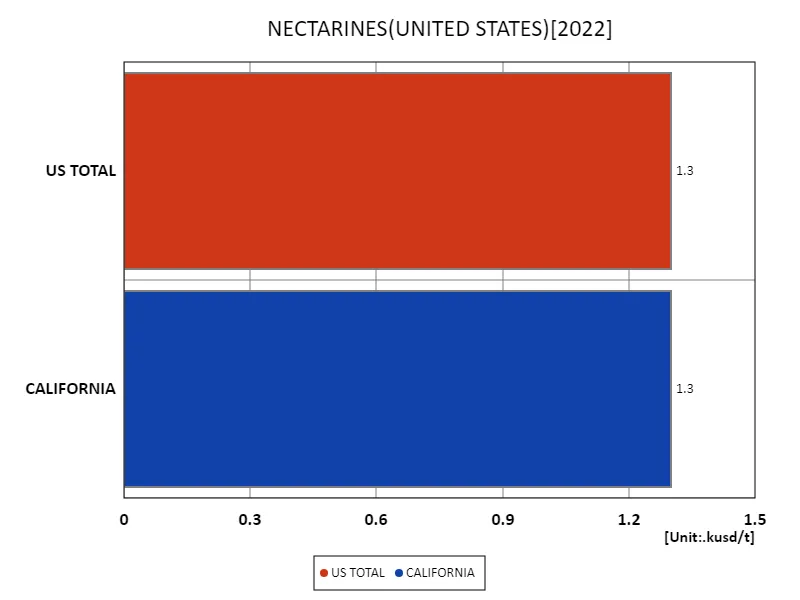

The maximum is 1.3kusd/t of US TOTAL, the average is 1.3kusd/t, and the total is 2.6kusd/t
Main data
| PEACHES(ALL CLASSES, ALL PRODUCTION PRACTICES, FRESH MARKET, PRICE RECEIVED, UNITED STATES) [kusd/t] | |||||
|---|---|---|---|---|---|
| NEW JERSEY | OTHER STATES | PENNSYLVANIA | US TOTAL | CALIFORNIA | |
| 2022 | 2.1 | 1.74 | 1.49 | 1.48 | 1.31 |
| 2021 | 2.61 | 1.42 | 1.58 | 1.37 | 1.2 |
| 2020 | 2.85 | 1.56 | 1.82 | 1.38 | 1.22 |
| 2019 | 1.49 | 1.39 | 1.27 | 1.07 | |
| 2018 | 1.47 | 1.35 | 1.23 | 1.09 | |
| 2017 | 1.6 | 1.35 | 1.18 | ||
| 2016 | 1.38 | 1.24 | 1.22 | 0.99 | |
| 2015 | 1.23 | 1.1 | 0.9 | ||
| 2014 | 1.36 | 1.19 | 1.06 | ||
| 2013 | 1.12 | 0.96 | 0.67 | ||
| 2012 | 1.25 | 0.97 | |||
| 2011 | 1.23 | 0.83 | |||
| 2010 | 1.16 | 0.79 | |||
| 2009 | 1.07 | 0.81 | 0.56 | ||
| 2008 | 1.02 | 0.68 | 0.4 | ||
| 2007 | 1.09 | 0.71 | 0.5 | ||
| 2006 | 0.97 | 0.78 | |||
| 2005 | 0.87 | 0.72 | |||
| 2004 | 0.73 | 0.55 | |||
| 2003 | 0.72 | 0.58 | |||
| 2002 | 0.83 | 0.61 | |||
| 2001 | 0.61 | ||||
| 2000 | 0.55 | ||||
| 1999 | 0.57 | ||||
| 1998 | 0.6 | ||||
| 1997 | 0.49 | ||||
| 1996 | 0.66 | ||||


Comments