Abstract
The average annual prices of grapes and pear fruit nuts in the United States show different characteristics. For grapes, the latest data for 2022 recorded a high yield of 1.66 kusd/t, reflecting strong demand for high-quality cultivated grapes. On the other hand, the price of pears has remained lower, highlighting the imbalance of supply and demand in agricultural product pricing. The production volume of these fruits varies depending on the region and climatic conditions, which also affects the price. Looking at trends over the past few years, grape prices have remained stable due to constant demand, providing a steady source of income for growers. Pear prices, on the other hand, tend to be more volatile and susceptible to fluctuations in harvest volume and market demand. Price trends for these fruit trees reflect the health of the overall agricultural economy and shifts in consumer preferences, and will be an important indicator for future agricultural policies and market forecasts.
Average price (grapes)
From 2002 to 2022, the average annual price of grape fruit nuts in the United States shows notable regional variations. In North Carolina in particular, prices hit an all-time high of 3.1 kusd/t in 2010, but have since fallen to 55.8% of the peak. There are several factors behind this price fluctuation. First, grape-growing conditions in North Carolina are more susceptible to the effects of climate and soil than in other major grape-producing regions, which means prices are particularly susceptible to fluctuations. The high prices in 2010 are thought to be the result of weather conditions and the market supply and demand balance at the time, but in recent years, prices have been falling due to the effects of climate change and changes in production efficiency. Furthermore, while prices in the overall American grape market are stabilizing due to a diversification of varieties and improvements in production techniques, there are still notable price fluctuations from region to region. North Carolina’s price declines are likely due to region-specific production issues and increased market competition, and are distinct from other major producing regions. Such price fluctuations will affect future production strategies and market forecasts, indicating the importance of sustainable agricultural management and market responsiveness.
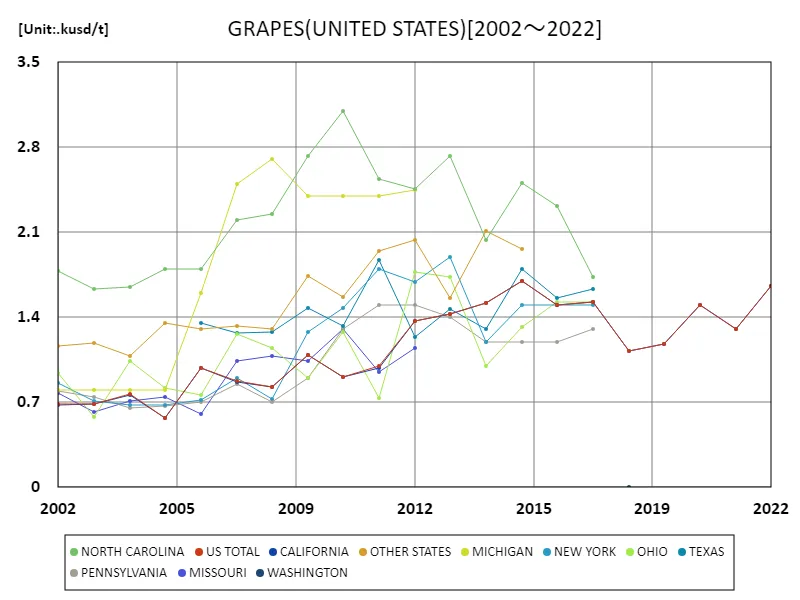

The maximum is 3.1kusd/t[2010] of NORTH CAROLINA, and the current value is about 55.8%
Average price (grapes, latest year)
According to 2022 data, the annual average price of grape fruit nuts in the United States was highest in California at 1.66 kusd/t. The reason why California is able to maintain these prices is largely due to the fact that it is the largest grape-producing state in the United States. California has climate and soil conditions suitable for grape cultivation, and produces a wide variety of grape varieties that are highly regarded for both quality and quantity. Looking at price trends in recent years, California prices at 100% of their peak would indicate that 2022 prices were at their highest levels for that year. This is thought to be the result of increased demand for grapes, which has had an impact on production costs and maintaining quality. In particular, as demand for wine grapes increases, high-quality grapes are being valued and prices are rising. Additionally, California’s scale of production and technological innovation have made it possible to maintain high prices. Producers strive to improve quality and adopt sustainable cultivation methods, which allows them to offer stable prices. As a result, California grape prices remain high due to a combination of stable demand and high quality.
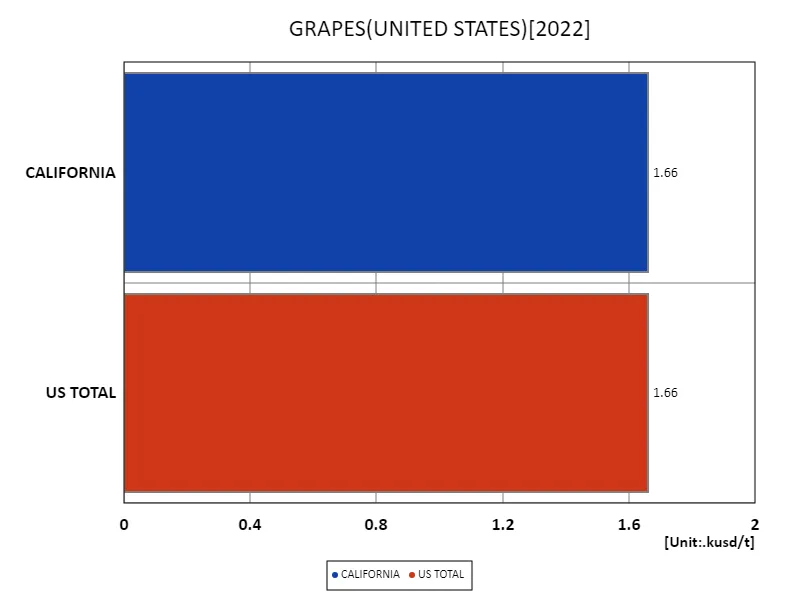

The maximum is 1.66kusd/t of CALIFORNIA, the average is 1.66kusd/t, and the total is 3.32kusd/t
Average price (Pear)
According to 1996 data, the average annual price of pears in the United States was 1.03 kUSD/t in the rest of the states, 839 kUSD/t overall, and 3.98 kUSD/t in total. This data shows price distribution and trends in the U.S. pear market. The price of pears is the highest in other states at 1.03 kusd/t, which may reflect the quality and characteristics of pears produced in these states or the high demand. On the other hand, the overall average price was 839 USD/t and the total price was 3.98 K USD/t, indicating that prices were relatively stable overall. In 1996, pear prices were heavily influenced by the balance between supply and demand. Pear production in the United States occurs primarily in the Western and Midwestern states, where climate and soil conditions are factors that affect price. Also, price differences can occur depending on the quality and variety of pears. In particular, price differences between pear-producing regions depend on local production conditions and market demand, with higher prices being due to higher quality pears and limited supply. Overall, the 1996 data indicate market price stability for pears and regional variations, with market trends and growing conditions having a direct impact on prices.
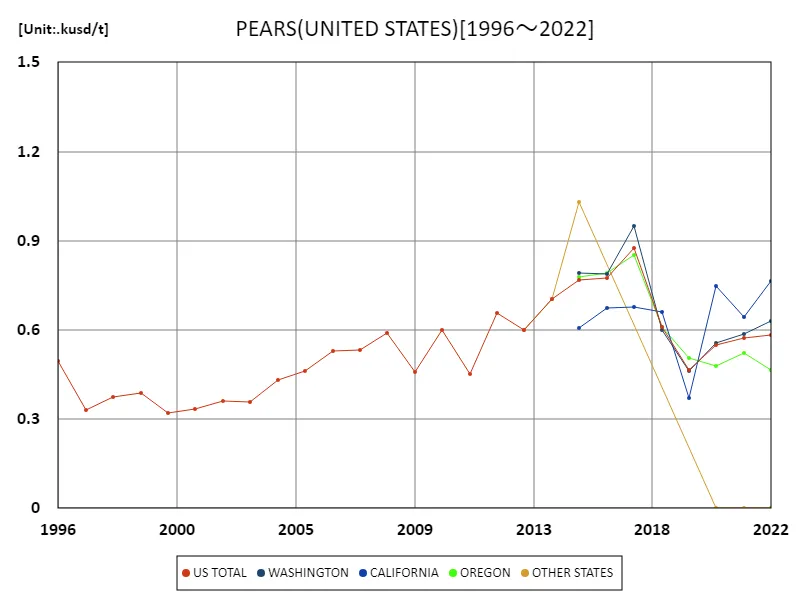

The maximum is the latest one, 1.03kusd/t of OTHER STATES
Average price (Pear, latest year)
According to 2022 data, the average annual price of pears in the United States is 612 USD/t, with California recording the highest price at 765 USD/t. The overall total price is 2.45kusd/t. These prices reflect the diversity of the pear market and regional price differences. The reason why California has the highest pear prices is because the state is a major pear growing region and produces high-quality pears. California’s climate and soil conditions are ideal for growing pears, which in turn commands a high price. Another factor that causes price differences is the variety and quality of pears that vary from region to region. The overall average price of 612 USD/ton indicates the stability of pear prices across the country. As the average prices indicate, the U.S. pear market is relatively stable and, although there are variations in prices based on specific regions and varieties, there are no major fluctuations. The combined price of 2.45 kusd/t reflects the inclusion of multiple varieties and producing regions and is indicative of price trends across the market. Overall, pear prices exist at a diverse price range as they are influenced by local growing conditions and demand, but 2022 data indicates that the U.S. pear market is maturing and quality and growing conditions will influence prices.
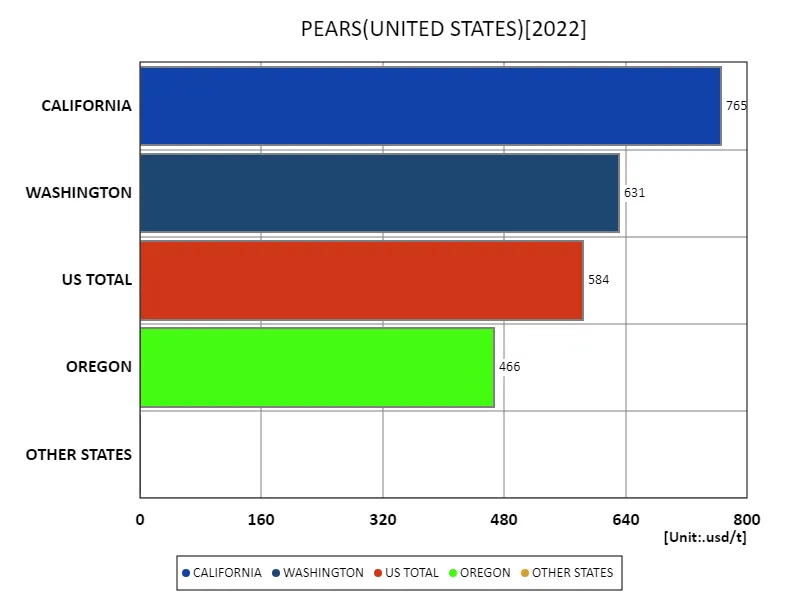

The maximum is 765usd/t of CALIFORNIA, the average is 612usd/t, and the total is 2.45kusd/t
Main data
| GRAPES(ALL CLASSES, ALL PRODUCTION PRACTICES, FRESH MARKET, PRICE RECEIVED, UNITED STATES) [kusd/t] | |||||||
|---|---|---|---|---|---|---|---|
| NORTH CAROLINA | TEXAS | OHIO | US TOTAL | CALIFORNIA | NEW YORK | PENNSYLVANIA | |
| 2022 | 1.66 | 1.66 | |||||
| 2021 | 1.3 | 1.3 | |||||
| 2020 | 1.5 | 1.5 | |||||
| 2019 | 1.18 | 1.18 | |||||
| 2018 | 1.12 | 1.12 | |||||
| 2017 | 1.73 | 1.63 | 1.53 | 1.53 | 1.53 | 1.5 | 1.3 |
| 2016 | 2.32 | 1.56 | 1.53 | 1.5 | 1.5 | 1.5 | 1.2 |
| 2015 | 2.51 | 1.8 | 1.32 | 1.7 | 1.7 | 1.5 | 1.2 |
| 2014 | 2.04 | 1.3 | 1 | 1.52 | 1.52 | 1.2 | 1.2 |
| 2013 | 2.73 | 1.47 | 1.73 | 1.43 | 1.43 | 1.9 | 1.4 |
| 2012 | 2.46 | 1.24 | 1.77 | 1.37 | 1.37 | 1.69 | 1.5 |
| 2011 | 2.54 | 1.87 | 0.74 | 1 | 0.99 | 1.8 | 1.5 |
| 2010 | 3.1 | 1.33 | 1.28 | 0.91 | 0.91 | 1.48 | 1.3 |
| 2009 | 2.73 | 1.48 | 0.9 | 1.09 | 1.09 | 1.28 | 0.9 |
| 2008 | 2.25 | 1.28 | 1.15 | 0.83 | 0.83 | 0.73 | 0.7 |
| 2007 | 2.2 | 1.27 | 1.26 | 0.87 | 0.87 | 0.9 | 0.85 |
| 2006 | 1.8 | 1.35 | 0.76 | 0.99 | 0.99 | 0.72 | 0.7 |
| 2005 | 1.8 | 0.82 | 0.57 | 0.57 | 0.68 | 0.67 | |
| 2004 | 1.65 | 1.04 | 0.77 | 0.76 | 0.68 | 0.65 | |
| 2003 | 1.63 | 0.58 | 0.69 | 0.68 | 0.71 | 0.74 | |
| 2002 | 1.78 | 0.94 | 0.69 | 0.68 | 0.86 | 0.79 | |


Comments