Abstract
The annual average price of tomatoes and sweet corn in the U.S. is a key indicator that is affected by fluctuations in agricultural markets, weather conditions and supply chains. According to 2023 data, the average annual price of tomatoes in Florida is 55.1 usd/cwt, indicating that the state is a major producer of tomatoes. Tomato prices tend to fluctuate greatly as they are greatly influenced by the season, production volume, and weather. Meanwhile, sweet corn prices are similarly affected by supply and demand, particularly crop yields and weather conditions. Sweet corn is mainly produced in the summer and is difficult to obtain a stable supply of, so prices can fluctuate. Corn prices can also change in conjunction with ethanol production and feed demand. Overall, these price fluctuations directly affect producers’ revenues and consumers’ price burdens. It is important to keep a close eye on these price movements when understanding market trends and considering agricultural policies and investment strategies.
Average price (tomato)
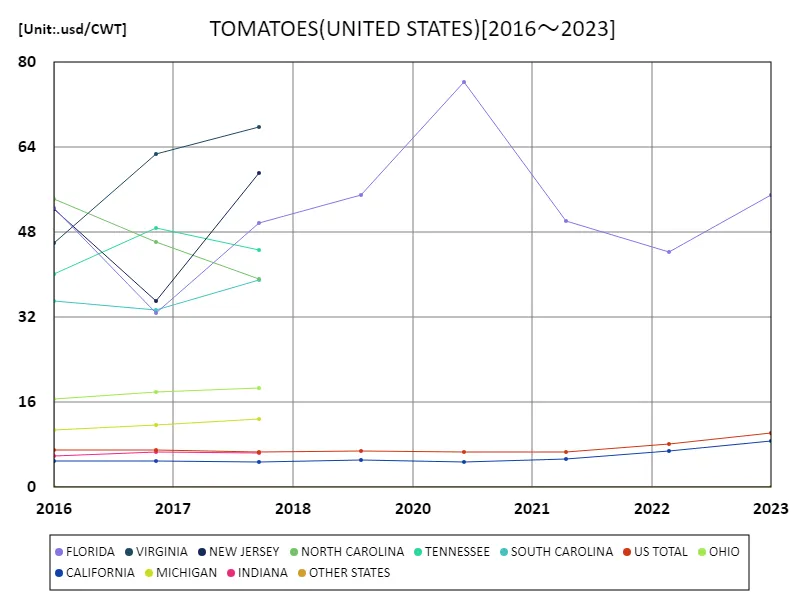
US tomato prices have shown notable fluctuations between 2016 and 2023. What stands out in particular is that in 2020, tomato prices in Florida peaked at $76.3/cwt. The high prices are likely the result of a confluence of factors, including supply chain disruptions caused by the COVID-19 pandemic, weather conditions and a surge in demand. Prices have since gradually decreased and are currently at around 55.1 USD/cwt, 72.2% of the peak level. This price decline is related to stabilizing supplies, recovery in production volumes and fluctuations in market demand. It is also believed that climate change and advances in agricultural technology are influencing long-term price fluctuations. Historical trends in tomato prices show that they are often heavily influenced by supply shortages and fluctuations in demand, with extreme weather conditions and policy changes having a particularly pronounced impact on prices. Therefore, in order to predict future price trends, it will be necessary to keep a close eye on these factors and respond flexibly to the market.


The maximum is 76.3usd/CWT[2020] of FLORIDA, and the current value is about 72.2%
Average price (Tomato, latest year)
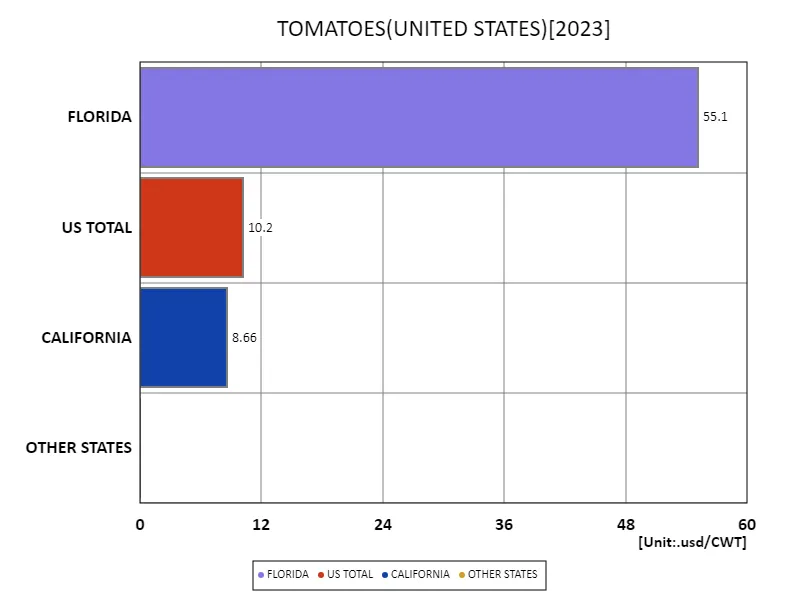
The annual average price of tomatoes in the United States in 2023 was recorded in Florida at 55.1 usd/cwt, the peak price for that year. Florida’s ability to maintain these prices reflects its status as a major tomato producing region and a steady supply of high-quality tomatoes. The fact that Florida prices are at 100% of their peak means that there has been little fluctuation in prices, suggesting that a stable market environment is being maintained. This price stability could be due to balanced supply, improved agricultural techniques, or a match between market demand and supply. Tomato prices typically depend on many factors, including weather conditions, production volume and transportation costs, so maintaining stable prices reflects a healthy market. Additionally, seasonal and harvest factors also play a role in why prices remain high in Florida. A deeper understanding of the relationship between tomato production and prices is important in predicting future market trends.


The maximum is 55.1usd/CWT of FLORIDA, the average is 24.7usd/CWT, and the total is 74usd/CWT
Average price (sweet corn)
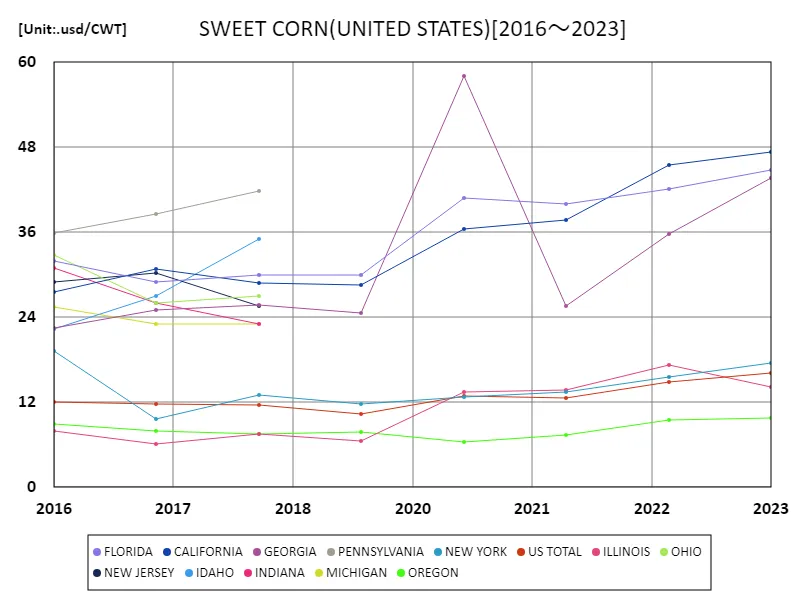
Looking back at sweet corn price trends in the United States in 2016, Georgia recorded the highest price at 58 USD/cwt. This indicates that the state had unique conditions and high demand for sweet corn production. Meanwhile, the national average price is 18.2 USD/cwt, which is significantly lower than prices in Georgia. This price difference reflects regional differences in production costs and supply-demand balances. The overall price total of $345/cwt illustrates the range and variability of prices across the sweet corn market. Pricing is heavily influenced by seasonal and weather conditions, changes in harvest yields and the market supply and demand balance. Sweet corn in particular has a relatively short growing season, so seasonal fluctuations directly affect prices. These data indicate that the sweet corn market is sensitive to regional price differences and supply fluctuations. To predict future price trends, it is important to have a deep understanding of these factors and maintain a stable supply and demand balance.


The maximum is 58usd/CWT[2020] of GEORGIA, and the current value is about 75.2%
Average price (sweet corn, latest year)
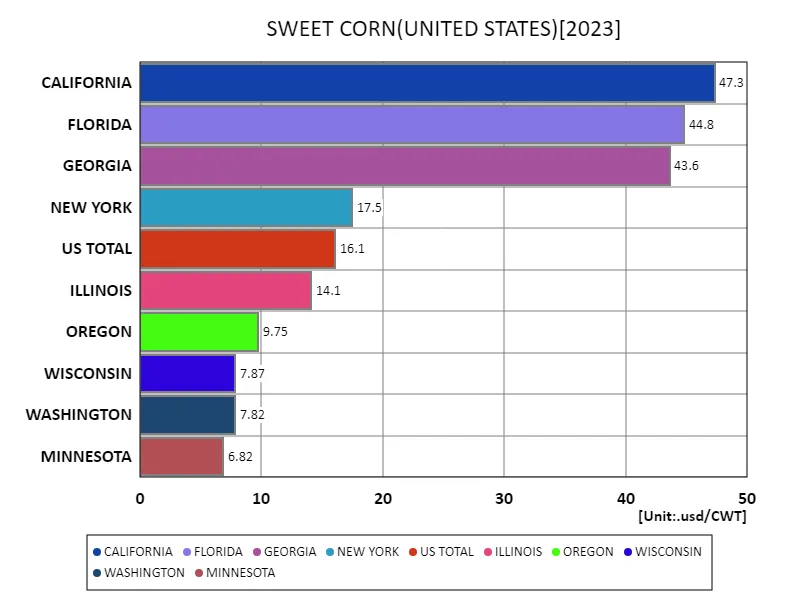
Looking at sweet corn price trends in the United States in 2023, California recorded the highest price at 47.3 USD/cwt. California is a major sweet corn producer, and its advantageous climatic conditions and production techniques may be supporting high prices. Meanwhile, the national average price is 21.6 USD/cwt, which indicates an overall balance between supply and demand and represents a relatively stable price range. The total price figure of $216/cwt reflects the magnitude of price range and fluctuations across the sweet corn market. Price fluctuations are greatly influenced by weather conditions, harvest yields, and local supply situations. California’s high prices could be due to supply constraints and high-quality sweet corn, especially in high-demand markets. In addition, sweet corn is highly seasonal and prices often fluctuate significantly depending on the harvest season, so prices tend to rise when a stable supply is difficult to achieve. As such, sweet corn prices are affected by region and time of year, so taking these factors into account will allow for a more accurate market analysis.


The maximum is 47.3usd/CWT of CALIFORNIA, the average is 21.6usd/CWT, and the total is 216usd/CWT
Main data
| TOMATOES(ALL CLASSES, ALL PRODUCTION PRACTICES, ALL UTILIZATION PRACTICES, PRICE RECEIVED, UNITED STATES) [usd/CWT] | ||||||||||
|---|---|---|---|---|---|---|---|---|---|---|
| VIRGINIA | NEW JERSEY | FLORIDA | TENNESSEE | NORTH CAROLINA | SOUTH CAROLINA | OHIO | MICHIGAN | US TOTAL | INDIANA | |
| 2023 | 55.1 | 10.2 | ||||||||
| 2022 | 44.3 | 8.1 | ||||||||
| 2021 | 50.2 | 6.63 | ||||||||
| 2020 | 76.3 | 6.64 | ||||||||
| 2019 | 55.1 | 6.8 | ||||||||
| 2018 | 67.9 | 59.2 | 49.7 | 44.6 | 39.2 | 39 | 18.6 | 12.9 | 6.73 | 6.38 |
| 2017 | 62.8 | 35 | 32.8 | 48.8 | 46.2 | 33.3 | 18 | 11.7 | 6.99 | 6.63 |
| 2016 | 46 | 52.3 | 52.5 | 40.1 | 54.2 | 35 | 16.6 | 10.7 | 7.1 | 5.95 |


Comments