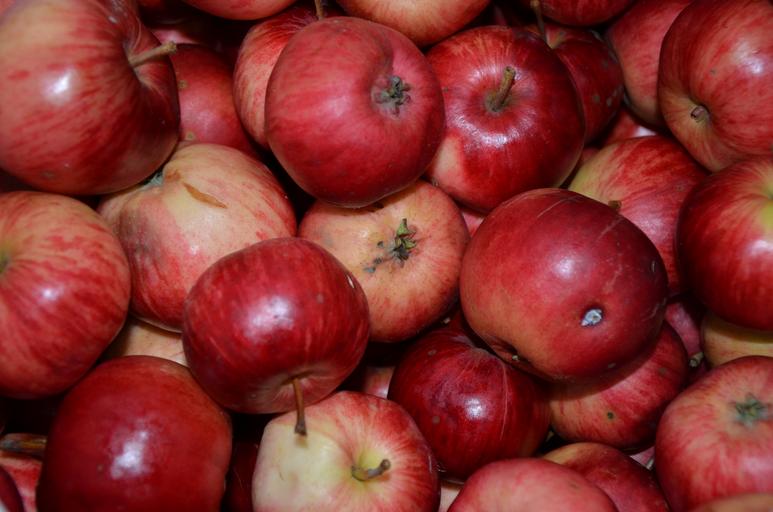
Apples are widely grown around the world, with China being the largest producer. The United States, Poland and India are also major producers. There are many varieties of apples, each with a different taste and texture depending on the climatic conditions and cultivation techniques. Not only is it eaten raw as a fruit, but it is also widely used as juice and processed products. It is highly nutritious, especially rich in vitamin C and dietary fiber, and is expected to have health benefits.
Production volume(2022)
| Total | ex. | 1 | 2 | 3 | 4 | 5 | 6 | 7 | 8 | 9 | 10 | |
|---|---|---|---|---|---|---|---|---|---|---|---|---|
| Apple | World | United States | China | Turkey | United States | Poland | India | Russia | Italy | Iran | France | Chile |
| Mt % |
95.8 100 |
4.43 4.62 |
47.6 49.6 |
4.82 5.03 |
4.43 4.62 |
4.26 4.45 |
2.59 2.7 |
2.38 2.48 |
2.26 2.35 |
1.99 2.08 |
1.79 1.86 |
1.48 1.54 |
| Mandarin orange | World | United States | China | Turkey | Spain | Morocco | Brazil | Egypt | Iran | Italy | Japan | United States |
| Mt % |
44.2 100 |
0.664 1.5 |
27.2 61.5 |
1.87 4.22 |
1.8 4.08 |
1.36 3.08 |
1.09 2.46 |
0.989 2.24 |
0.83 1.88 |
0.801 1.81 |
0.682 1.54 |
0.664 1.5 |
| Orange | World | United States | Brazil | India | China | Mexico | Egypt | United States | Spain | Indonesia | Iran | Vietnam |
| Mt % |
76.4 100 |
3.15 4.12 |
16.9 22.2 |
10.2 13.3 |
7.71 10.1 |
4.85 6.35 |
3.39 4.44 |
3.15 4.12 |
2.82 3.69 |
2.68 3.51 |
2.32 3.04 |
1.81 2.37 |
Output(2021)
| Total | ex. | 1 | 2 | 3 | 4 | 5 | 6 | 7 | 8 | 9 | 10 | |
|---|---|---|---|---|---|---|---|---|---|---|---|---|
| Apple | World | United States | China | United States | Turkey | Russia | India | Iran | United Kingdom | Germany | South Africa | Japan |
| Mt % |
91 100 |
17.5 19.2 |
36.2 39.8 |
17.5 19.2 |
3.2 3.52 |
3.17 3.49 |
2.5 2.75 |
1.67 1.84 |
1.65 1.81 |
1.57 1.73 |
1.34 1.47 |
1.28 1.41 |
| Orange | World | United States | China | United States | India | Brazil | Mexico | Indonesia | Iran | Italy | Turkey | Egypt |
| Mt % |
109 100 |
11.5 10.6 |
29.1 26.8 |
11.5 10.6 |
9.41 8.67 |
5.89 5.42 |
4.04 3.72 |
2.43 2.24 |
2.42 2.23 |
2.25 2.07 |
2.22 2.05 |
2.12 1.95 |
Food(2021)
| Total | ex. | 1 | 2 | 3 | 4 | 5 | 6 | 7 | 8 | 9 | 10 | |
|---|---|---|---|---|---|---|---|---|---|---|---|---|
| Apple | World | United States | Poland | China | Turkey | Chile | United States | Italy | South Africa | Austria | Moldova | Netherlands |
| Mt % |
17.3 100 |
1.24 7.15 |
3.2 18.5 |
1.72 9.93 |
1.36 7.87 |
1.27 7.31 |
1.24 7.15 |
1.19 6.85 |
0.765 4.42 |
0.615 3.55 |
0.559 3.23 |
0.518 2.99 |
| Orange | World | United States | Brazil | Spain | Netherlands | South Africa | Belgium | Egypt | United States | Turkey | China | Costa Rica |
| Mt % |
33.5 100 |
1.27 3.8 |
10.1 30.3 |
3.41 10.2 |
3.37 10.1 |
1.96 5.85 |
1.92 5.75 |
1.48 4.43 |
1.27 3.8 |
1.24 3.71 |
0.906 2.71 |
0.694 2.07 |
Food per capita(2021)
| Total | ex. | 1 | 2 | 3 | 4 | 5 | 6 | 7 | 8 | 9 | 10 | |
|---|---|---|---|---|---|---|---|---|---|---|---|---|
| Apple | World | United States | United States | Russia | United Kingdom | Germany | France | Netherlands | Japan | Austria | South Africa | Canada |
| Mt % |
32.5 100 |
14.4 44.4 |
14.4 44.4 |
1.43 4.4 |
1.41 4.33 |
1.19 3.67 |
1.16 3.58 |
0.971 2.99 |
0.773 2.38 |
0.755 2.32 |
0.626 1.93 |
0.555 1.71 |
| Orange | World | United States | United States | Netherlands | Germany | Belgium | France | United Kingdom | Russia | Canada | China | Poland |
| Mt % |
37.6 100 |
8.31 22.1 |
8.31 22.1 |
4.47 11.9 |
2.56 6.82 |
2.3 6.11 |
2.16 5.75 |
1.71 4.56 |
1.6 4.25 |
1.59 4.23 |
0.848 2.26 |
0.669 1.78 |
license
CC BY 4.0

Comments