
Abstract
In 2023, Japan’s national rice harvest reached a record 7.17 million tons (Mt), supported by a cultivated area of 1.34 million hectares (mha). This marks an upward trend in harvest volume, despite fluctuating yields in past years. Historically, Japan has seen a steady decline in rice planting areas due to urbanization and shifts in dietary preferences, though there has been a focus on maximizing yield per 10a. Aomori Prefecture led the nation with a yield of 614 kg per 10a, reflecting the region’s emphasis on high-efficiency farming practices. This trend highlights a push toward enhancing productivity while maintaining a reduced cultivated area.
Konjac yam harvest volume (main data).
Japan’s rice production peaked in 1967 with a record harvest of 14.3 million tons (Mt). Since then, overall national yields have steadily declined, with the current level at 50.3% of the 1967 peak. This decrease is largely due to reduced cultivated areas, driven by urbanization and changing dietary habits. However, advancements in farming technology and crop management have allowed for increased yields per hectare, stabilizing overall output despite fewer rice fields. Efforts to optimize production in key regions, such as Aomori, have helped maintain productivity within a smaller agricultural footprint.
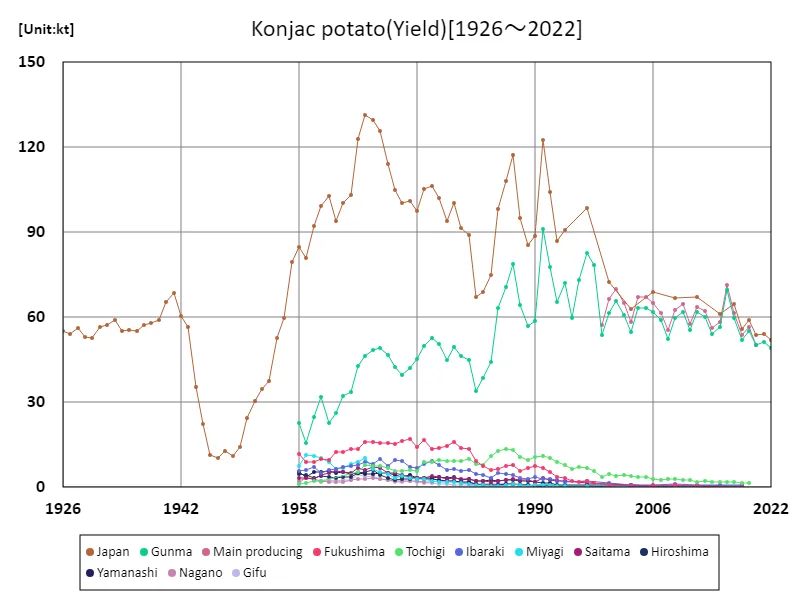
The maximum is 131kt[1967] of Japan, and the current value is about 39.5%
Konjac yam harvest volume (by prefecture).
As of 2023, Niigata Prefecture leads Japan in rice production with a total yield of 592,000 tons (kt), the highest nationwide. This highlights the region’s dominance in rice farming, supported by favorable climate and advanced agricultural techniques. Over time, Niigata has consistently been one of Japan’s top producers, reflecting its well-established rice-growing traditions. While overall national production has declined from its peak in the 1960s, Niigata’s output remains robust, emphasizing both high productivity and effective land management. Other regions are also focusing on improving yields per hectare to maintain overall national production.
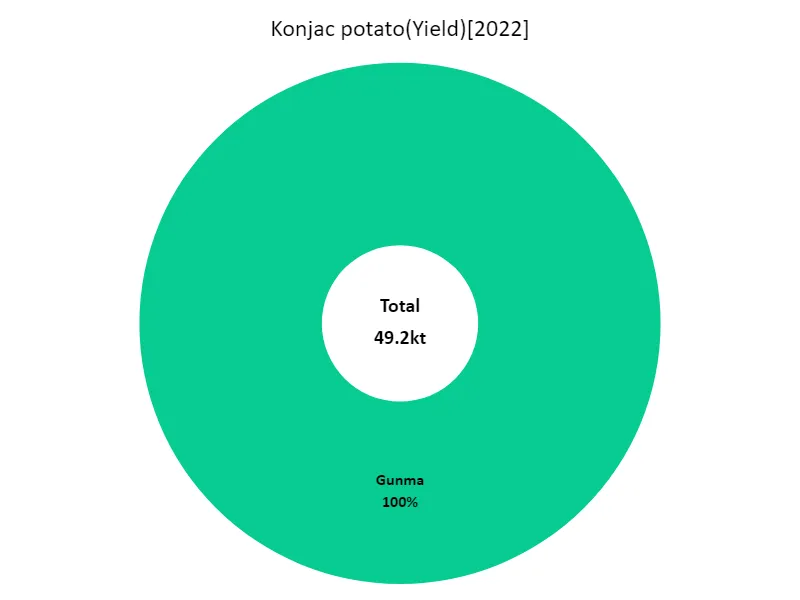
The maximum is 49.2kt of Gunma, the average is 49.2kt, and the total is 49.2kt
Konjac cultivation area (main data).
Since its peak of 3.17 million hectares (mha) in 1969, Japan’s rice cultivation area has steadily declined, reaching just 42.4% of that level in 2023. This reduction is largely due to urbanization, industrialization, and changing dietary habits, leading to a shift away from rice consumption. As Japan’s agricultural landscape has transformed, fewer hectares are dedicated to rice farming. However, the focus has shifted to improving productivity per hectare, with advanced farming technologies helping to maintain national rice production despite the smaller cultivated area. The trend reflects a balance between land use reduction and enhanced farming efficiency.
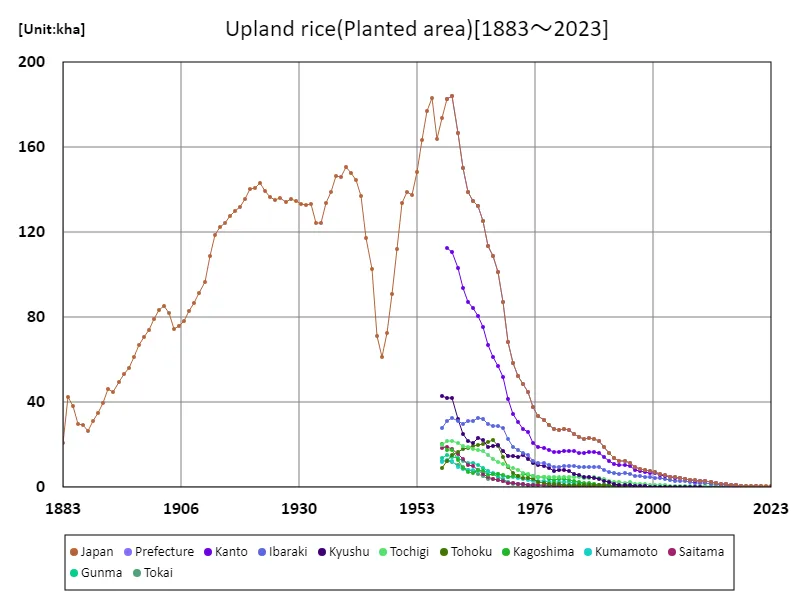
The maximum is 184kha[1960] of Japan, and the current value is about 218m%
Konjac cultivation area (by prefecture).
As of 2023, Niigata Prefecture holds the largest rice cultivation area in Japan, with 116,000 hectares (kha), reflecting its longstanding dominance in rice farming. Niigata’s vast rice fields are supported by favorable environmental conditions and advanced agricultural practices. Over time, while the overall rice cultivation area in Japan has declined due to urbanization and changing dietary preferences, Niigata has maintained its leadership position. Other regions also focus on optimizing land use and increasing yields per hectare, but Niigata remains central to Japan’s rice production, with its expansive cultivated area serving as a key contributor.
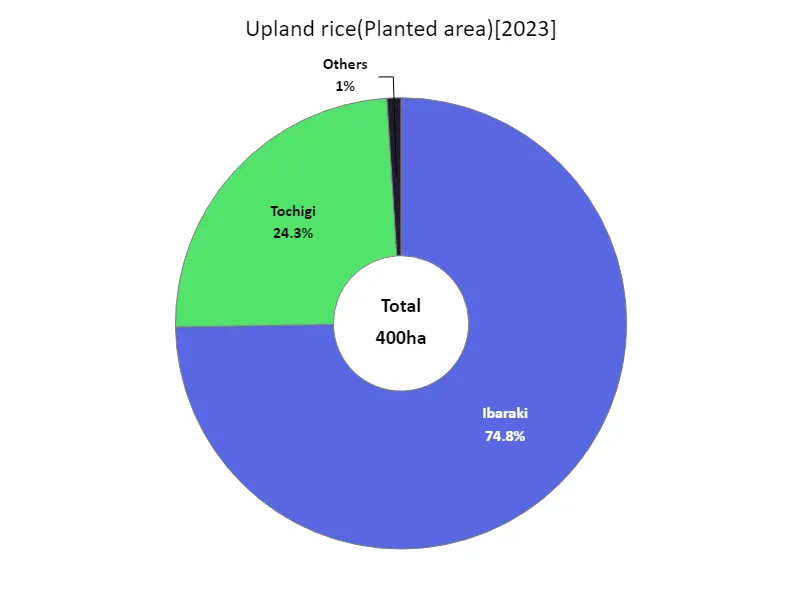
The maximum is 299ha of Ibaraki, the average is 57.1ha, and the total is 400ha
Konjac yield per 10ares (by prefecture).
In 2023, Aomori Prefecture recorded the highest rice yield per 10a in Japan at 614 kg, surpassing the national average of 511 kg. This reflects Aomori’s effective agricultural practices, including advanced farming techniques and ideal environmental conditions. The total national rice yield for the year was 24,000 tons, demonstrating a stable but smaller output compared to historical peaks. Over time, improvements in farming efficiency, despite a shrinking cultivated area, have allowed for higher yields per 10a, highlighting a trend toward maximizing productivity in key rice-growing regions like Aomori.
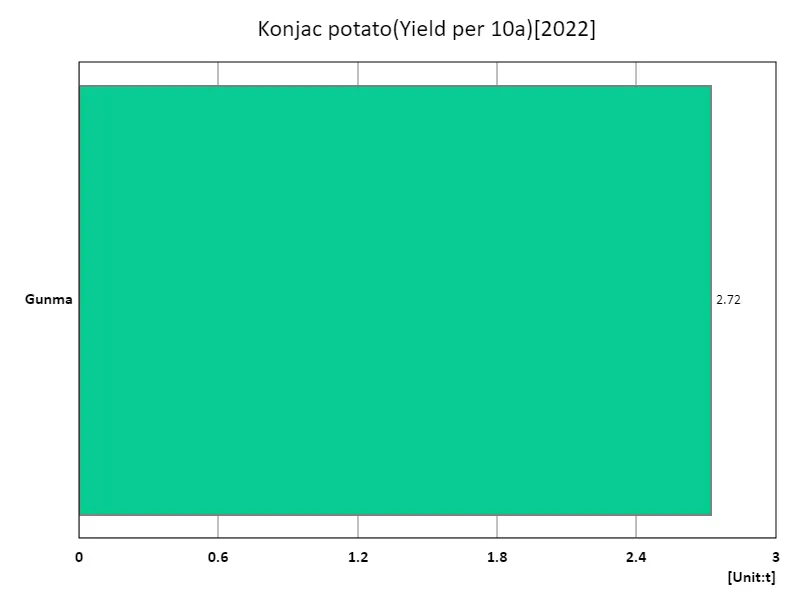
The maximum is 2.72t of Gunma, the average is 2.72t, and the total is 2.72t
Main data
| Konjac potato(Yield) [kt] | ||||||||||
|---|---|---|---|---|---|---|---|---|---|---|
| Japan | Main producing | Gunma | Tochigi | Ibaraki | Hiroshima | Fukushima | Saitama | Chiba | Nagano | |
| 2022 | 51.9 | 49.2 | ||||||||
| 2021 | 54.2 | 51.2 | ||||||||
| 2020 | 53.7 | 50.2 | 50.2 | |||||||
| 2019 | 59.1 | 56.7 | 55.3 | 1.36 | ||||||
| 2018 | 55.9 | 53.6 | 52.1 | 1.49 | 0.77 | 0.37 | 0.23 | 0.17 | 0.16 | 0.13 |
| 2017 | 64.7 | 61.5 | 59.7 | 1.82 | ||||||
| 2016 | 71.3 | 69.5 | 1.8 | |||||||
| 2015 | 61.3 | 58.3 | 56.5 | 1.79 | 0.9 | 0.35 | 0.25 | 0.47 | 0.27 | 0.23 |
| 2014 | 56.1 | 54.2 | 1.91 | |||||||
| 2013 | 62.2 | 60.1 | 2.13 | |||||||
| 2012 | 67 | 63.7 | 61.7 | 2.01 | 0.93 | 0.32 | 0.49 | 0.49 | 0.06 | 0.27 |
| 2011 | 57.8 | 55.4 | 2.4 | |||||||
| 2010 | 64.6 | 61.9 | 2.65 | |||||||
| 2009 | 66.9 | 62.7 | 59.9 | 2.76 | 1.14 | 0.43 | 0.65 | 0.48 | 0.3 | 0.29 |
| 2008 | 55.5 | 52.5 | 2.95 | |||||||
| 2007 | 61.4 | 58.9 | 2.54 | |||||||
| 2006 | 68.9 | 64.9 | 61.9 | 2.96 | 0.91 | 0.54 | 0.44 | 0.62 | 0.13 | 0.38 |
| 2005 | 67 | 63.4 | 3.62 | |||||||
| 2004 | 67.1 | 63.3 | 3.77 | |||||||
| 2003 | 63.1 | 58.5 | 54.7 | 3.84 | 0.9 | 0.66 | 0.46 | 0.79 | 0.17 | 0.32 |
| 2002 | 65.2 | 60.8 | 4.43 | |||||||
| 2001 | 69.9 | 65.8 | 4.11 | |||||||
| 2000 | 72.6 | 66.3 | 61.5 | 4.8 | 1.36 | 0.7 | 0.91 | 1.15 | 0.13 | 0.42 |
| 1999 | 57.4 | 53.6 | 3.79 | |||||||
| 1998 | 78.3 | 5.7 | 1.66 | |||||||
| 1997 | 98.7 | 82.7 | 6.79 | 2.22 | 0.75 | 2.06 | 1.63 | 0.06 | 0.42 | |
| 1996 | 73 | 7.12 | 1.93 | |||||||
| 1995 | 59.7 | 6.59 | 2.33 | |||||||
| 1994 | 90.8 | 72 | 7.94 | 1.94 | 0.93 | 3.27 | 2.17 | 0.02 | 0.37 | |
| 1993 | 87.1 | 65.3 | 8.79 | 2.55 | 0.94 | 3.65 | 2.39 | 0.51 | ||
| 1992 | 104.4 | 77.7 | 10.4 | 2.87 | 1.4 | 5.34 | 2.57 | 0.64 | ||
| 1991 | 122.5 | 91.2 | 11.2 | 3 | 1.53 | 6.73 | 3.23 | 1.1 | ||
| 1990 | 88.7 | 58.7 | 10.6 | 3.62 | 1.77 | 7.41 | 1.83 | 0.82 | ||
| 1989 | 85.6 | 56.9 | 9.51 | 2.8 | 2.16 | 6.68 | 2.63 | 0.78 | ||
| 1988 | 95.2 | 64.4 | 10.7 | 3.11 | 2.33 | 5.73 | 2.62 | 1.18 | ||
| 1987 | 117.4 | 78.9 | 13.1 | 4.36 | 2.68 | 7.97 | 3.04 | 1.22 | ||
| 1986 | 108.2 | 70.6 | 13.5 | 4.85 | 2.47 | 7.54 | 2.7 | 1.11 | ||
| 1985 | 98.3 | 63.2 | 12.8 | 5.12 | 2.24 | 6.55 | 2.37 | 1.02 | ||
| 1984 | 74.9 | 44.3 | 10.9 | 3.43 | 2.58 | 6.16 | 2.03 | 1.03 | ||
| 1983 | 69.1 | 38.7 | 8 | 4.28 | 2.39 | 7.65 | 2.13 | 1.12 | ||
| 1982 | 67 | 33.9 | 8.33 | 4.64 | 2.32 | 9.38 | 2.26 | 1.13 | ||
| 1981 | 88.9 | 45.1 | 9.99 | 5.98 | 2.86 | 13.4 | 3.06 | 1.51 | ||
| 1980 | 91.6 | 46.2 | 9.41 | 5.72 | 2.54 | 13.9 | 2.91 | 1.69 | ||
| 1979 | 100.4 | 49.5 | 9.23 | 6.38 | 3.56 | 15.9 | 3.23 | 2.09 | ||
| 1978 | 93.9 | 44.9 | 9.3 | 6.17 | 3.32 | 14.6 | 2.85 | 2.32 | ||
| 1977 | 102.1 | 50.6 | 9.52 | 7.7 | 3.74 | 13.7 | 3.6 | 0.18 | 2.28 | |
| 1976 | 106.5 | 52.8 | 9.06 | 9.19 | 3.4 | 13.6 | 4.06 | 0.21 | 2.02 | |
| 1975 | 105.3 | 49.9 | 8.82 | 8.06 | 3.28 | 16.6 | 3.24 | 0.17 | 1.87 | |
| 1974 | 97.6 | 45.4 | 5.7 | 6.8 | 3.11 | 14.1 | 3.14 | 2.15 | ||
| 1973 | 101 | 42 | 5.97 | 7.33 | 3.08 | 16.9 | 3.81 | 2.08 | ||
| 1972 | 100.5 | 39.8 | 5.87 | 9.13 | 2.98 | 16.2 | 4.31 | 2.09 | ||
| 1971 | 105 | 42.5 | 5.79 | 9.76 | 2.64 | 15.3 | 4.98 | 2.39 | ||
| 1970 | 114.2 | 46.8 | 6.8 | 7.53 | 3.17 | 15.7 | 5.16 | 2.72 | ||
| 1969 | 125.9 | 49 | 7.44 | 9.89 | 4.28 | 15.5 | 6.92 | 2.94 | ||
| 1968 | 129.8 | 48.4 | 7.6 | 8.35 | 6.1 | 15.9 | 7.07 | 0.16 | 3.23 | |
| 1967 | 131.3 | 46.5 | 7.98 | 8.76 | 5.32 | 16.1 | 5.94 | 3.06 | ||
| 1966 | 123 | 42.8 | 5.33 | 7.98 | 5.09 | 13.4 | 6.72 | 2.78 | ||
| 1965 | 103.1 | 33.8 | 7.53 | 3.65 | 13.5 | 5.01 | 2.49 | |||
| 1964 | 100.3 | 32.1 | 7.11 | 3.5 | 12.6 | 5.45 | 1.98 | |||
| 1963 | 94.1 | 26.4 | 6.51 | 3.18 | 12.3 | 5.58 | 2 | |||
| 1962 | 102.7 | 22.6 | 6.09 | 3.59 | 9.64 | 4.98 | 1.98 | |||
| 1961 | 99.2 | 32 | 2.33 | 4.98 | 3.86 | 10 | 4.34 | 0.2 | 2.29 | |
| 1960 | 92.3 | 24.9 | 2.17 | 7.34 | 3.22 | 8.82 | 2.79 | 0.18 | 2.81 | |
| 1959 | 81 | 15.7 | 1.38 | 6.05 | 4.25 | 8.98 | 3.29 | 0.17 | 3.29 | |
| 1958 | 84.9 | 22.8 | 1.24 | 5.69 | 4.73 | 11.7 | 3.24 | 0.17 | 2.21 | |
| 1957 | 79.6 | |||||||||
| 1956 | 59.8 | |||||||||
| 1955 | 52.8 | |||||||||
| 1954 | 37.6 | |||||||||
| 1953 | 34.8 | |||||||||
| 1952 | 30.4 | |||||||||
| 1951 | 24.5 | |||||||||
| 1950 | 14.2 | |||||||||
| 1949 | 11.2 | |||||||||
| 1948 | 12.9 | |||||||||
| 1947 | 10.3 | |||||||||
| 1946 | 11.5 | |||||||||
| 1945 | 22.4 | |||||||||
| 1944 | 35.4 | |||||||||
| 1943 | 56.6 | |||||||||
| 1942 | 60.3 | |||||||||
| 1941 | 68.6 | |||||||||
| 1940 | 65.3 | |||||||||
| 1939 | 59 | |||||||||
| 1938 | 57.9 | |||||||||
| 1937 | 57.4 | |||||||||
| 1936 | 55.1 | |||||||||
| 1935 | 55.5 | |||||||||
| 1934 | 55.1 | |||||||||
| 1933 | 59 | |||||||||
| 1932 | 57.4 | |||||||||
| 1931 | 56.6 | |||||||||
| 1930 | 52.8 | |||||||||
| 1929 | 53.2 | |||||||||
| 1928 | 56.1 | |||||||||
| 1927 | 54 | |||||||||
| 1926 | 55 | |||||||||


Comments