Abstract
Barley production is an important part of global agriculture, and its production varies greatly from country to country. According to the latest data for 2022, Russia is the largest producer, producing 23.4 Mt. Looking at the trends over the past few years, Russia is the leading producer of barley and has maintained its position. Barley production is also prone to be affected by climatic conditions, agricultural policies, and changes in demand. In particular, the impact of climate change on agricultural production has been attracting attention, which may affect future production. Since barley is used for various purposes such as feed, food, and the alcoholic beverage industry, changes in demand also affect production. Therefore, understanding the trends and characteristics of barley production is important for understanding global agricultural trends.
Barley production (worldwide)
Looking at the data on barley production, changes over the past 60 years are clear. In 1994, Russia recorded the highest production, achieving 27.1 Mt. However, in the following decades, Russian barley production has declined, with current production at 86.5% of the peak. This decline may be due to changes in agricultural policies and climatic conditions. Meanwhile, other countries show a trend of increasing barley production. This may be due to changes in demand or advances in agricultural technology. Barley is widely used in the feed, food and alcohol industries, and changes in demand have a significant impact on production. It is also necessary to consider the impact of climate change on agriculture. Given these factors, many factors are involved in barley production, and understanding its trends is an important challenge in global agriculture.
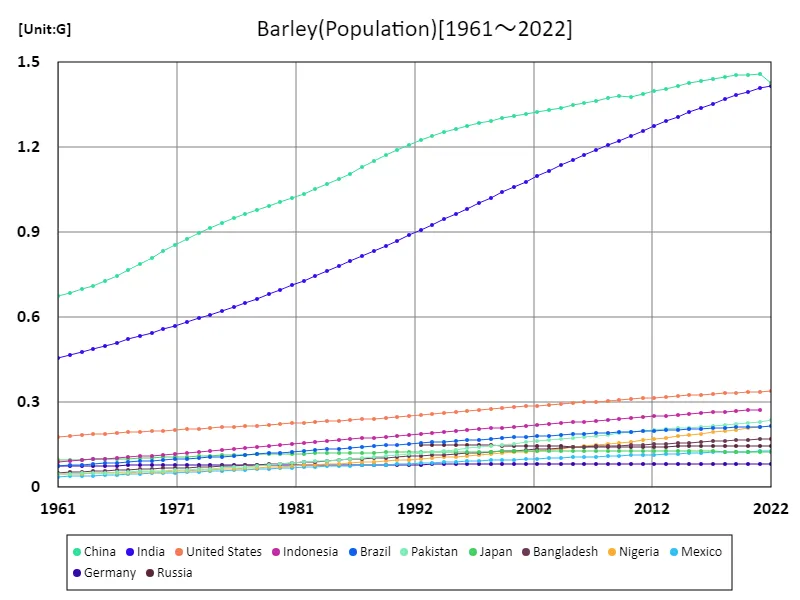
The maximum is 1.46G[2021] of China, and the current value is about 97.8%
Barley production (latest year, worldwide)
Barley production in the market is one of the important indicators in global agriculture. According to data for 2022, Russia was the largest producer, recording 23.4 Mt. The average production was 1.46 Mt, and the total production reached 155 Mt. Looking at the trends so far, it appears that Russia is the main producer in the barley market. In addition, in the barley market, increases and decreases in production can affect prices. The balance between demand and supply plays a major role, and changes in demand and the effects of climatic conditions also affect market prices. Barley has a wide range of uses, including feed, food, and the sake brewing industry, and the demand of these industries also affects market trends. Therefore, understanding the trends and characteristics of the barley market is an important source of information for agricultural stakeholders and investors.
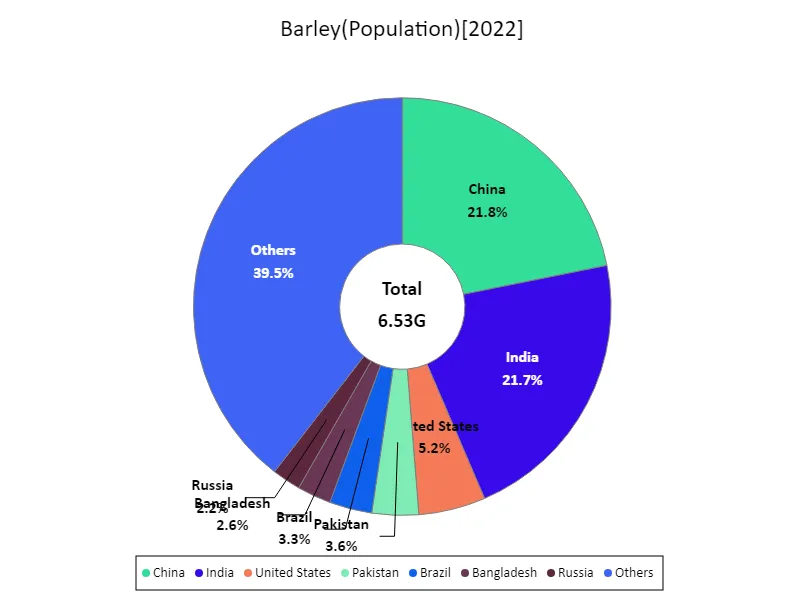
The maximum is 1.43G of China, the average is 61.6M, and the total is 6.53G
Barley production (continent)
Analysis of barley production data over the past 60 years shows that in 1978, Europe achieved an astounding production of 128 Mt, the highest production volume overall. However, in the following decades, European barley production has declined, with current production at 70.9% of the peak. This decline may be due to changes in agricultural policies, economic factors, and changes in land use. In particular, the structure of the agricultural sector in Europe has changed, with a decrease in large-scale agricultural production and increasing urbanization. Meanwhile, barley production in other regions tends to increase. This may be due to the adaptation of climatic conditions and advances in agricultural technology. The demand for barley is stable and it is widely used in the feed, food, and alcohol industries. Therefore, changes in demand also affect production. Overall, barley production, including in Europe, is influenced by many factors, and understanding the trends is a key challenge in global agriculture.
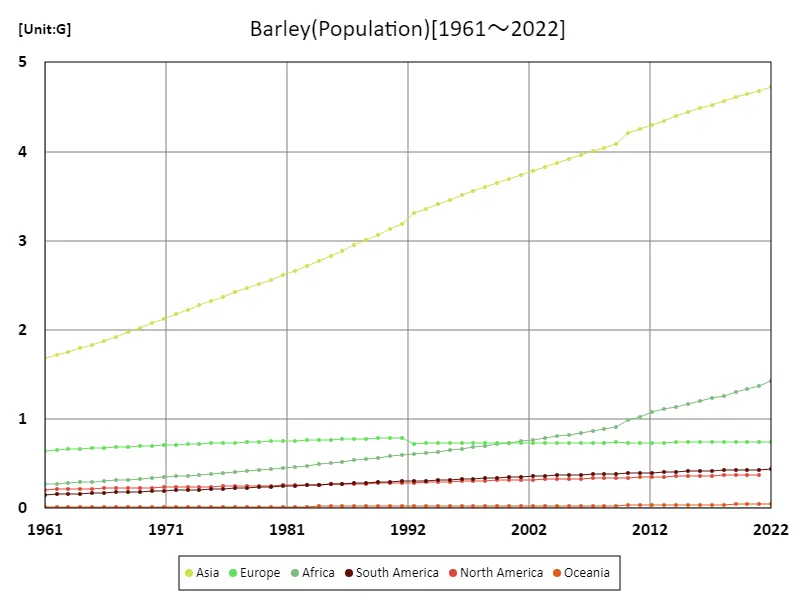
The maximum is the latest one, 4.72G of Asia
Barley production (latest year, continental)
According to barley production data for 2022, Europe is the largest overall producer, achieving 91.1 Mt. The average production is 25.7 Mt, bringing the overall total to 154 Mt. Based on this data, and considering the historical trends, it appears that Europe is the main producing region of barley. However, especially in the past decades, there has been an increase in barley production in other regions. This may be due to the adaptation of climatic conditions and advances in agricultural technology. In addition, the demand for barley is stable, and it has a wide range of uses, including feed, food, and the alcoholic beverage industry. Changes in demand affect production. In addition, changes in agricultural policies and economic factors also affect barley production. Overall, barley production is affected by different factors in different regions, and understanding the trends is an important challenge in global agriculture.
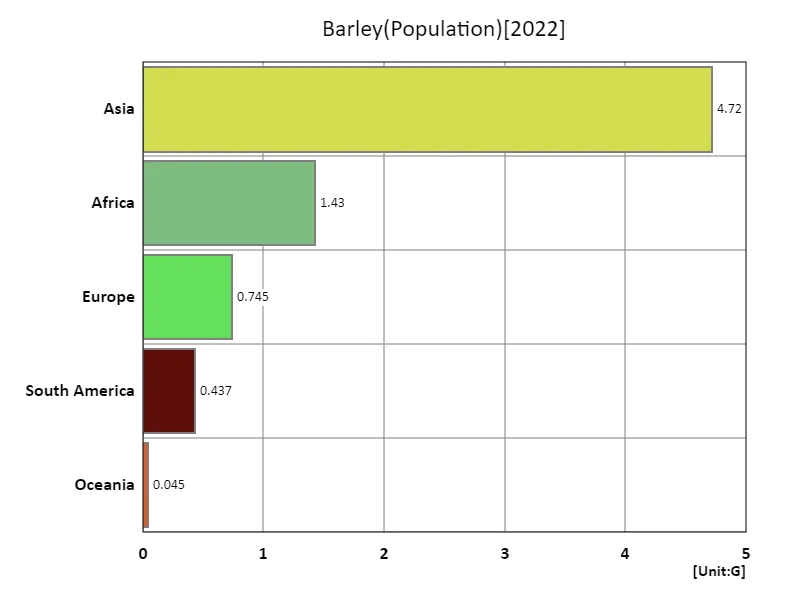
The maximum is 4.72G of Asia, the average is 1.47G, and the total is 7.37G
Main data
| Others(Barley, Population) [G] | ||||||||||
|---|---|---|---|---|---|---|---|---|---|---|
| World | Asia | Lower-middle-income countries | Upper-middle-income countries | Africa | China | India | High-income countries | Europe | Low-income countries | |
| 2022 | 7.98 | 4.72 | 3.45 | 2.56 | 1.43 | 1.43 | 1.42 | 1.22 | 0.74 | 0.72 |
| 2021 | 7.91 | 4.68 | 3.41 | 2.55 | 1.37 | 1.46 | 1.41 | 1.22 | 0.74 | 0.7 |
| 2020 | 7.84 | 4.65 | 3.37 | 2.54 | 1.34 | 1.46 | 1.4 | 1.22 | 0.74 | 0.68 |
| 2019 | 7.76 | 4.61 | 3.33 | 2.53 | 1.3 | 1.45 | 1.38 | 1.21 | 0.74 | 0.66 |
| 2018 | 7.68 | 4.57 | 3.28 | 2.52 | 1.26 | 1.45 | 1.37 | 1.21 | 0.74 | 0.64 |
| 2017 | 7.6 | 4.53 | 3.24 | 2.5 | 1.23 | 1.44 | 1.35 | 1.2 | 0.74 | 0.63 |
| 2016 | 7.51 | 4.48 | 3.19 | 2.48 | 1.2 | 1.43 | 1.34 | 1.2 | 0.74 | 0.61 |
| 2015 | 7.43 | 4.44 | 3.14 | 2.46 | 1.17 | 1.43 | 1.32 | 1.19 | 0.74 | 0.59 |
| 2014 | 7.34 | 4.39 | 3.1 | 2.44 | 1.14 | 1.42 | 1.31 | 1.18 | 0.74 | 0.58 |
| 2013 | 7.25 | 4.35 | 3.05 | 2.42 | 1.11 | 1.41 | 1.29 | 1.18 | 0.74 | 0.56 |
| 2012 | 7.16 | 4.3 | 3.01 | 2.4 | 1.08 | 1.4 | 1.27 | 1.17 | 0.74 | 0.55 |
| 2011 | 7.07 | 4.25 | 2.96 | 2.38 | 1.02 | 1.39 | 1.26 | 1.16 | 0.73 | 0.54 |
| 2010 | 6.99 | 4.2 | 2.91 | 2.36 | 0.99 | 1.38 | 1.24 | 1.15 | 0.73 | 0.52 |
| 2009 | 6.9 | 4.09 | 2.87 | 2.35 | 0.91 | 1.38 | 1.22 | 1.15 | 0.74 | 0.51 |
| 2008 | 6.81 | 4.04 | 2.82 | 2.33 | 0.89 | 1.37 | 1.21 | 1.14 | 0.74 | 0.49 |
| 2007 | 6.73 | 4 | 2.78 | 2.31 | 0.87 | 1.36 | 1.19 | 1.13 | 0.74 | 0.48 |
| 2006 | 6.64 | 3.96 | 2.74 | 2.29 | 0.85 | 1.36 | 1.17 | 1.12 | 0.73 | 0.46 |
| 2005 | 6.56 | 3.91 | 2.69 | 2.28 | 0.83 | 1.35 | 1.15 | 1.11 | 0.73 | 0.45 |
| 2004 | 6.48 | 3.87 | 2.65 | 2.26 | 0.81 | 1.34 | 1.14 | 1.1 | 0.73 | 0.44 |
| 2003 | 6.39 | 3.83 | 2.6 | 2.24 | 0.79 | 1.33 | 1.12 | 1.09 | 0.73 | 0.43 |
| 2002 | 6.31 | 3.78 | 2.56 | 2.23 | 0.77 | 1.32 | 1.1 | 1.09 | 0.73 | 0.41 |
| 2001 | 6.23 | 3.74 | 2.51 | 2.21 | 0.75 | 1.32 | 1.08 | 1.08 | 0.73 | 0.4 |
| 2000 | 6.15 | 3.69 | 2.47 | 2.19 | 0.74 | 1.31 | 1.06 | 1.07 | 0.73 | 0.39 |
| 1999 | 6.07 | 3.65 | 2.42 | 2.17 | 0.72 | 1.3 | 1.04 | 1.07 | 0.73 | 0.38 |
| 1998 | 5.99 | 3.6 | 2.38 | 2.16 | 0.7 | 1.29 | 1.02 | 1.06 | 0.73 | 0.37 |
| 1997 | 5.91 | 3.56 | 2.33 | 2.14 | 0.68 | 1.29 | 1 | 1.05 | 0.73 | 0.36 |
| 1996 | 5.83 | 3.51 | 2.29 | 2.12 | 0.67 | 1.28 | 0.98 | 1.05 | 0.73 | 0.35 |
| 1995 | 5.74 | 3.46 | 2.24 | 2.1 | 0.65 | 1.27 | 0.96 | 1.04 | 0.73 | 0.34 |
| 1994 | 5.66 | 3.41 | 2.2 | 2.08 | 0.64 | 1.25 | 0.95 | 1.03 | 0.73 | 0.33 |
| 1993 | 5.58 | 3.36 | 2.15 | 2.05 | 0.62 | 1.24 | 0.93 | 1.02 | 0.73 | 0.32 |
| 1992 | 5.49 | 3.31 | 2.11 | 2.03 | 0.61 | 1.23 | 0.91 | 1.02 | 0.73 | 0.31 |
| 1991 | 5.41 | 3.18 | 2.07 | 2.01 | 0.6 | 1.21 | 0.89 | 1.01 | 0.79 | 0.3 |
| 1990 | 5.32 | 3.13 | 2.02 | 1.98 | 0.58 | 1.19 | 0.87 | 1 | 0.79 | 0.3 |
| 1989 | 5.22 | 3.07 | 1.98 | 1.95 | 0.57 | 1.17 | 0.85 | 0.99 | 0.79 | 0.29 |
| 1988 | 5.13 | 3.01 | 1.93 | 1.92 | 0.55 | 1.15 | 0.83 | 0.99 | 0.78 | 0.28 |
| 1987 | 5.04 | 2.95 | 1.89 | 1.88 | 0.54 | 1.13 | 0.82 | 0.98 | 0.78 | 0.27 |
| 1986 | 4.95 | 2.89 | 1.84 | 1.85 | 0.52 | 1.11 | 0.8 | 0.97 | 0.77 | 0.27 |
| 1985 | 4.86 | 2.83 | 1.8 | 1.82 | 0.51 | 1.09 | 0.78 | 0.96 | 0.77 | 0.26 |
| 1984 | 4.78 | 2.77 | 1.76 | 1.79 | 0.49 | 1.07 | 0.76 | 0.96 | 0.77 | 0.25 |
| 1983 | 4.69 | 2.72 | 1.72 | 1.76 | 0.48 | 1.05 | 0.75 | 0.95 | 0.76 | 0.25 |
| 1982 | 4.61 | 2.67 | 1.67 | 1.73 | 0.47 | 1.04 | 0.73 | 0.94 | 0.76 | 0.24 |
| 1981 | 4.52 | 2.61 | 1.63 | 1.71 | 0.45 | 1.02 | 0.71 | 0.94 | 0.75 | 0.23 |
| 1980 | 4.44 | 2.56 | 1.59 | 1.68 | 0.44 | 1.01 | 0.7 | 0.93 | 0.75 | 0.23 |
| 1979 | 4.37 | 2.51 | 1.55 | 1.65 | 0.43 | 0.99 | 0.68 | 0.92 | 0.75 | 0.23 |
| 1978 | 4.29 | 2.47 | 1.51 | 1.63 | 0.42 | 0.98 | 0.67 | 0.91 | 0.74 | 0.22 |
| 1977 | 4.22 | 2.42 | 1.48 | 1.6 | 0.41 | 0.97 | 0.65 | 0.9 | 0.74 | 0.21 |
| 1976 | 4.14 | 2.37 | 1.44 | 1.58 | 0.4 | 0.95 | 0.64 | 0.9 | 0.73 | 0.21 |
| 1975 | 4.07 | 2.32 | 1.41 | 1.55 | 0.39 | 0.93 | 0.62 | 0.89 | 0.73 | 0.2 |
| 1974 | 4 | 2.27 | 1.38 | 1.52 | 0.38 | 0.92 | 0.61 | 0.88 | 0.72 | 0.2 |
| 1973 | 3.92 | 2.22 | 1.35 | 1.49 | 0.37 | 0.9 | 0.6 | 0.87 | 0.72 | 0.19 |
| 1972 | 3.84 | 2.17 | 1.32 | 1.46 | 0.36 | 0.88 | 0.58 | 0.87 | 0.71 | 0.19 |
| 1971 | 3.77 | 2.12 | 1.29 | 1.43 | 0.35 | 0.85 | 0.57 | 0.86 | 0.71 | 0.18 |
| 1970 | 3.7 | 2.07 | 1.26 | 1.4 | 0.34 | 0.83 | 0.56 | 0.85 | 0.7 | 0.18 |
| 1969 | 3.62 | 2.02 | 1.23 | 1.37 | 0.33 | 0.81 | 0.55 | 0.84 | 0.7 | 0.17 |
| 1968 | 3.55 | 1.97 | 1.2 | 1.34 | 0.32 | 0.79 | 0.53 | 0.83 | 0.69 | 0.17 |
| 1967 | 3.48 | 1.92 | 1.17 | 1.31 | 0.31 | 0.77 | 0.52 | 0.82 | 0.69 | 0.16 |
| 1966 | 3.41 | 1.88 | 1.14 | 1.28 | 0.31 | 0.75 | 0.51 | 0.81 | 0.68 | 0.16 |
| 1965 | 3.34 | 1.83 | 1.12 | 1.25 | 0.3 | 0.73 | 0.5 | 0.8 | 0.68 | 0.16 |
| 1964 | 3.27 | 1.79 | 1.09 | 1.22 | 0.29 | 0.71 | 0.49 | 0.79 | 0.67 | 0.15 |
| 1963 | 3.2 | 1.75 | 1.07 | 1.18 | 0.28 | 0.7 | 0.48 | 0.78 | 0.66 | 0.15 |
| 1962 | 3.13 | 1.72 | 1.04 | 1.15 | 0.28 | 0.69 | 0.47 | 0.78 | 0.65 | 0.15 |
| 1961 | 3.07 | 1.69 | 1.02 | 1.13 | 0.27 | 0.68 | 0.46 | 0.77 | 0.65 | 0.14 |


Comments