Abstract
When considering the trends in exports and imports in global agriculture, the volume of rice imports is an important factor. According to 2021 data, China is the largest rice importer, importing 7.94 Mt. This indicates that China needs a large amount of foreign-produced rice to meet its domestic demand. As China’s economy grows and urbanizes, there are changes in eating habits and increased demand, which may be leading to an increase in imports. Other countries are also increasing their imports, which means that the demand for rice is expanding globally. This is likely due to population growth, changes in eating habits, and increased demand due to economic growth. Future trends in rice imports will be largely determined by factors such as global economic growth, regional agricultural policies, and climate change.
Rice imports (worldwide)
Rice has been a staple in global agriculture, with significant shifts in production and trade patterns from 1961 to 2021. China, the largest producer, peaked at 7.94 million tons in 2021, reflecting its sustained focus on self-sufficiency and domestic consumption. Historically, rice imports have fluctuated, influenced by changing dietary preferences, population growth, and climate factors. Key importers like India and Indonesia have varied their import levels in response to domestic production challenges. Overall, the global rice trade has been characterized by regional dependencies and increasing demand, with countries adjusting strategies to ensure food security amid evolving agricultural challenges.
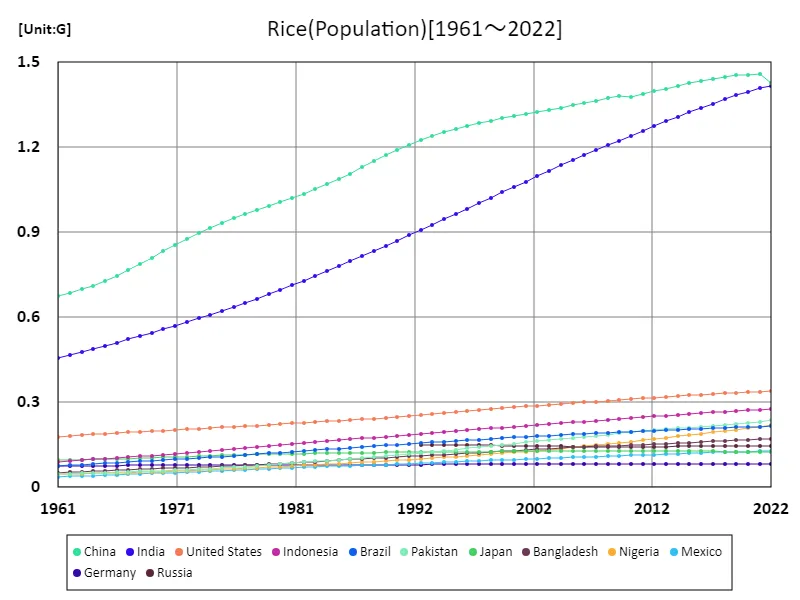
The maximum is 1.46G[2021] of China, and the current value is about 97.8%
Rice imports (latest year, countries around the world)
In 2021, the global rice market saw China leading with an impressive import volume of 7.94 million tons, reflecting its ongoing demand despite being the largest producer. The total rice trade reached 83.1 million tons, with an average import of 452,000 tons per country, highlighting significant regional disparities in consumption and production. Countries like India and Indonesia also played pivotal roles, responding to fluctuating domestic yields and shifting dietary needs. Overall, trends indicate increasing globalization of rice trade, driven by factors such as population growth, changing consumer preferences, and climate impacts, emphasizing the importance of rice in food security strategies worldwide.
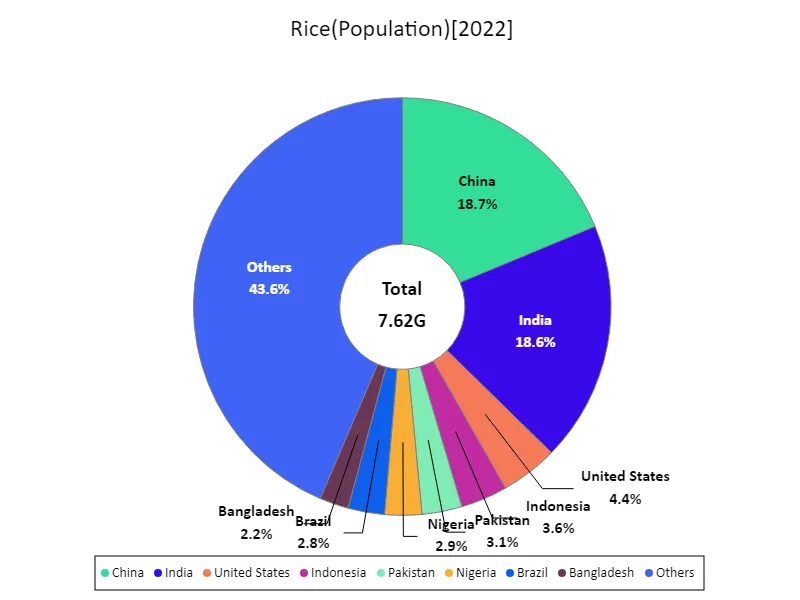
The maximum is 1.43G of China, the average is 54.8M, and the total is 7.62G
Rice imports (continent)
Since 1961, rice imports have exhibited significant trends, particularly in Asia, which reached a record high of 33.6 million tons. This increase reflects the region’s growing population and shifting dietary patterns, leading to heightened demand for rice. Key importing countries, including Indonesia and the Philippines, have struggled with domestic production challenges, prompting reliance on imports to ensure food security. Over the decades, trade dynamics have been influenced by climate variability, economic factors, and agricultural policies. The rising trend in imports underscores the critical role rice plays in the Asian diet, highlighting the need for sustainable agricultural practices to meet future demands.
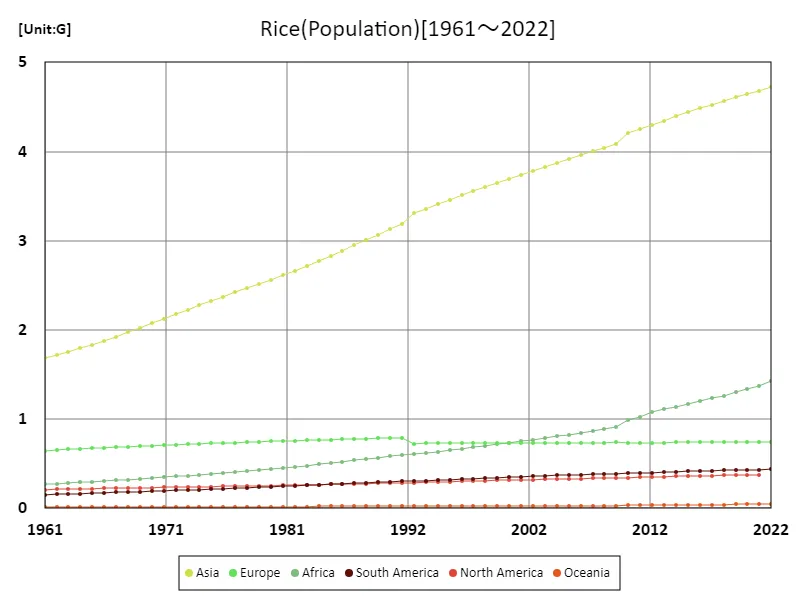
The maximum is the latest one, 4.72G of Asia
Rice imports (latest year, continent)
In 2021, Asia dominated the global rice import landscape, totaling 33.6 million tons, reflecting its critical role in meeting the dietary needs of a large and growing population. The total global rice imports reached 77.5 million tons, with an average of 12.9 million tons per country, indicating significant regional disparities in rice consumption and production capabilities. Key importing nations, such as Indonesia, Bangladesh, and the Philippines, faced challenges in domestic production, driving up import levels. Overall, the data underscores a trend of increasing reliance on rice imports in Asia, highlighting the importance of trade in ensuring food security amidst climate change and evolving agricultural practices.
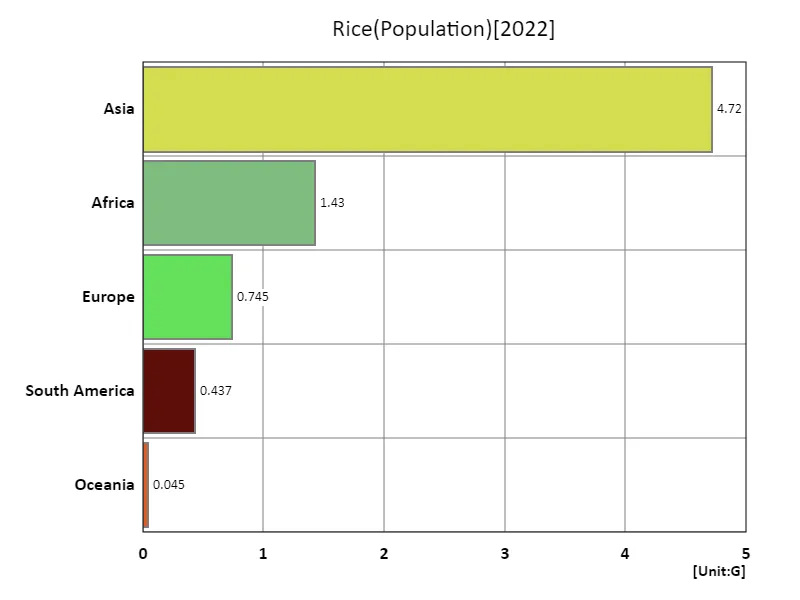
The maximum is 4.72G of Asia, the average is 1.47G, and the total is 7.37G
Main data
| Others(Rice, Population) [G] | ||||||||||
|---|---|---|---|---|---|---|---|---|---|---|
| World | Asia | Lower-middle-income countries | Upper-middle-income countries | Africa | China | India | High-income countries | Europe | Low-income countries | |
| 2022 | 7.98 | 4.72 | 3.45 | 2.56 | 1.43 | 1.43 | 1.42 | 1.22 | 0.74 | 0.72 |
| 2021 | 7.91 | 4.68 | 3.41 | 2.55 | 1.37 | 1.46 | 1.41 | 1.22 | 0.74 | 0.7 |
| 2020 | 7.84 | 4.65 | 3.37 | 2.54 | 1.34 | 1.46 | 1.4 | 1.22 | 0.74 | 0.68 |
| 2019 | 7.76 | 4.61 | 3.33 | 2.53 | 1.3 | 1.45 | 1.38 | 1.21 | 0.74 | 0.66 |
| 2018 | 7.68 | 4.57 | 3.28 | 2.52 | 1.26 | 1.45 | 1.37 | 1.21 | 0.74 | 0.64 |
| 2017 | 7.6 | 4.53 | 3.24 | 2.5 | 1.23 | 1.44 | 1.35 | 1.2 | 0.74 | 0.63 |
| 2016 | 7.51 | 4.48 | 3.19 | 2.48 | 1.2 | 1.43 | 1.34 | 1.2 | 0.74 | 0.61 |
| 2015 | 7.43 | 4.44 | 3.14 | 2.46 | 1.17 | 1.43 | 1.32 | 1.19 | 0.74 | 0.59 |
| 2014 | 7.34 | 4.39 | 3.1 | 2.44 | 1.14 | 1.42 | 1.31 | 1.18 | 0.74 | 0.58 |
| 2013 | 7.25 | 4.35 | 3.05 | 2.42 | 1.11 | 1.41 | 1.29 | 1.18 | 0.74 | 0.56 |
| 2012 | 7.16 | 4.3 | 3.01 | 2.4 | 1.08 | 1.4 | 1.27 | 1.17 | 0.74 | 0.55 |
| 2011 | 7.07 | 4.25 | 2.96 | 2.38 | 1.02 | 1.39 | 1.26 | 1.16 | 0.73 | 0.54 |
| 2010 | 6.99 | 4.2 | 2.91 | 2.36 | 0.99 | 1.38 | 1.24 | 1.15 | 0.73 | 0.52 |
| 2009 | 6.9 | 4.09 | 2.87 | 2.35 | 0.91 | 1.38 | 1.22 | 1.15 | 0.74 | 0.51 |
| 2008 | 6.81 | 4.04 | 2.82 | 2.33 | 0.89 | 1.37 | 1.21 | 1.14 | 0.74 | 0.49 |
| 2007 | 6.73 | 4 | 2.78 | 2.31 | 0.87 | 1.36 | 1.19 | 1.13 | 0.74 | 0.48 |
| 2006 | 6.64 | 3.96 | 2.74 | 2.29 | 0.85 | 1.36 | 1.17 | 1.12 | 0.73 | 0.46 |
| 2005 | 6.56 | 3.91 | 2.69 | 2.28 | 0.83 | 1.35 | 1.15 | 1.11 | 0.73 | 0.45 |
| 2004 | 6.48 | 3.87 | 2.65 | 2.26 | 0.81 | 1.34 | 1.14 | 1.1 | 0.73 | 0.44 |
| 2003 | 6.39 | 3.83 | 2.6 | 2.24 | 0.79 | 1.33 | 1.12 | 1.09 | 0.73 | 0.43 |
| 2002 | 6.31 | 3.78 | 2.56 | 2.23 | 0.77 | 1.32 | 1.1 | 1.09 | 0.73 | 0.41 |
| 2001 | 6.23 | 3.74 | 2.51 | 2.21 | 0.75 | 1.32 | 1.08 | 1.08 | 0.73 | 0.4 |
| 2000 | 6.15 | 3.69 | 2.47 | 2.19 | 0.74 | 1.31 | 1.06 | 1.07 | 0.73 | 0.39 |
| 1999 | 6.07 | 3.65 | 2.42 | 2.17 | 0.72 | 1.3 | 1.04 | 1.07 | 0.73 | 0.38 |
| 1998 | 5.99 | 3.6 | 2.38 | 2.16 | 0.7 | 1.29 | 1.02 | 1.06 | 0.73 | 0.37 |
| 1997 | 5.91 | 3.56 | 2.33 | 2.14 | 0.68 | 1.29 | 1 | 1.05 | 0.73 | 0.36 |
| 1996 | 5.83 | 3.51 | 2.29 | 2.12 | 0.67 | 1.28 | 0.98 | 1.05 | 0.73 | 0.35 |
| 1995 | 5.74 | 3.46 | 2.24 | 2.1 | 0.65 | 1.27 | 0.96 | 1.04 | 0.73 | 0.34 |
| 1994 | 5.66 | 3.41 | 2.2 | 2.08 | 0.64 | 1.25 | 0.95 | 1.03 | 0.73 | 0.33 |
| 1993 | 5.58 | 3.36 | 2.15 | 2.05 | 0.62 | 1.24 | 0.93 | 1.02 | 0.73 | 0.32 |
| 1992 | 5.49 | 3.31 | 2.11 | 2.03 | 0.61 | 1.23 | 0.91 | 1.02 | 0.73 | 0.31 |
| 1991 | 5.41 | 3.18 | 2.07 | 2.01 | 0.6 | 1.21 | 0.89 | 1.01 | 0.79 | 0.3 |
| 1990 | 5.32 | 3.13 | 2.02 | 1.98 | 0.58 | 1.19 | 0.87 | 1 | 0.79 | 0.3 |
| 1989 | 5.22 | 3.07 | 1.98 | 1.95 | 0.57 | 1.17 | 0.85 | 0.99 | 0.79 | 0.29 |
| 1988 | 5.13 | 3.01 | 1.93 | 1.92 | 0.55 | 1.15 | 0.83 | 0.99 | 0.78 | 0.28 |
| 1987 | 5.04 | 2.95 | 1.89 | 1.88 | 0.54 | 1.13 | 0.82 | 0.98 | 0.78 | 0.27 |
| 1986 | 4.95 | 2.89 | 1.84 | 1.85 | 0.52 | 1.11 | 0.8 | 0.97 | 0.77 | 0.27 |
| 1985 | 4.86 | 2.83 | 1.8 | 1.82 | 0.51 | 1.09 | 0.78 | 0.96 | 0.77 | 0.26 |
| 1984 | 4.78 | 2.77 | 1.76 | 1.79 | 0.49 | 1.07 | 0.76 | 0.96 | 0.77 | 0.25 |
| 1983 | 4.69 | 2.72 | 1.72 | 1.76 | 0.48 | 1.05 | 0.75 | 0.95 | 0.76 | 0.25 |
| 1982 | 4.61 | 2.67 | 1.67 | 1.73 | 0.47 | 1.04 | 0.73 | 0.94 | 0.76 | 0.24 |
| 1981 | 4.52 | 2.61 | 1.63 | 1.71 | 0.45 | 1.02 | 0.71 | 0.94 | 0.75 | 0.23 |
| 1980 | 4.44 | 2.56 | 1.59 | 1.68 | 0.44 | 1.01 | 0.7 | 0.93 | 0.75 | 0.23 |
| 1979 | 4.37 | 2.51 | 1.55 | 1.65 | 0.43 | 0.99 | 0.68 | 0.92 | 0.75 | 0.23 |
| 1978 | 4.29 | 2.47 | 1.51 | 1.63 | 0.42 | 0.98 | 0.67 | 0.91 | 0.74 | 0.22 |
| 1977 | 4.22 | 2.42 | 1.48 | 1.6 | 0.41 | 0.97 | 0.65 | 0.9 | 0.74 | 0.21 |
| 1976 | 4.14 | 2.37 | 1.44 | 1.58 | 0.4 | 0.95 | 0.64 | 0.9 | 0.73 | 0.21 |
| 1975 | 4.07 | 2.32 | 1.41 | 1.55 | 0.39 | 0.93 | 0.62 | 0.89 | 0.73 | 0.2 |
| 1974 | 4 | 2.27 | 1.38 | 1.52 | 0.38 | 0.92 | 0.61 | 0.88 | 0.72 | 0.2 |
| 1973 | 3.92 | 2.22 | 1.35 | 1.49 | 0.37 | 0.9 | 0.6 | 0.87 | 0.72 | 0.19 |
| 1972 | 3.84 | 2.17 | 1.32 | 1.46 | 0.36 | 0.88 | 0.58 | 0.87 | 0.71 | 0.19 |
| 1971 | 3.77 | 2.12 | 1.29 | 1.43 | 0.35 | 0.85 | 0.57 | 0.86 | 0.71 | 0.18 |
| 1970 | 3.7 | 2.07 | 1.26 | 1.4 | 0.34 | 0.83 | 0.56 | 0.85 | 0.7 | 0.18 |
| 1969 | 3.62 | 2.02 | 1.23 | 1.37 | 0.33 | 0.81 | 0.55 | 0.84 | 0.7 | 0.17 |
| 1968 | 3.55 | 1.97 | 1.2 | 1.34 | 0.32 | 0.79 | 0.53 | 0.83 | 0.69 | 0.17 |
| 1967 | 3.48 | 1.92 | 1.17 | 1.31 | 0.31 | 0.77 | 0.52 | 0.82 | 0.69 | 0.16 |
| 1966 | 3.41 | 1.88 | 1.14 | 1.28 | 0.31 | 0.75 | 0.51 | 0.81 | 0.68 | 0.16 |
| 1965 | 3.34 | 1.83 | 1.12 | 1.25 | 0.3 | 0.73 | 0.5 | 0.8 | 0.68 | 0.16 |
| 1964 | 3.27 | 1.79 | 1.09 | 1.22 | 0.29 | 0.71 | 0.49 | 0.79 | 0.67 | 0.15 |
| 1963 | 3.2 | 1.75 | 1.07 | 1.18 | 0.28 | 0.7 | 0.48 | 0.78 | 0.66 | 0.15 |
| 1962 | 3.13 | 1.72 | 1.04 | 1.15 | 0.28 | 0.69 | 0.47 | 0.78 | 0.65 | 0.15 |
| 1961 | 3.07 | 1.69 | 1.02 | 1.13 | 0.27 | 0.68 | 0.46 | 0.77 | 0.65 | 0.14 |

Comments