Abstract
Looking at the data on rye imports, Germany is the largest importing country in 2021, reaching 763kt. Considering the past trends, this suggests that Germany is the main supplier of rye. Germany is known as a grain belt, producing high-quality rye and supplying it to the global market. In addition, since rye is mainly used in the food processing industry, importing countries have fluctuating demand volumes depending on food demand and economic conditions. Past trends suggest that import volumes fluctuate with certain demand, making imports from countries that are stable sources of supply important. By examining other major importing countries and regions, we can gain a deeper understanding of the trends and characteristics of the international rye market.
Rye imports (Worldwide)
Looking at data from 1961 to 2021, rye imports show trends for certain countries and regions. Of particular note is Russia’s export peak recorded in 1992, which reached 1.77 Mt. However, exports have declined since then, falling to 56.4% of the peak in 2021. This indicates that Russia is a major exporter of rye, but the decline from the peak suggests that there are various factors influencing export volumes. These include climate change, changes in agricultural policies, and increased domestic demand. On the other hand, there are other major rye exporting countries, and supply fluctuates depending on demand. In the rye import market, diversification of supply sources is important, and imports from different countries and regions are balanced to ensure a stable supply. Taking these trends and characteristics into account, we can better understand the trends in rye imports in global agriculture.
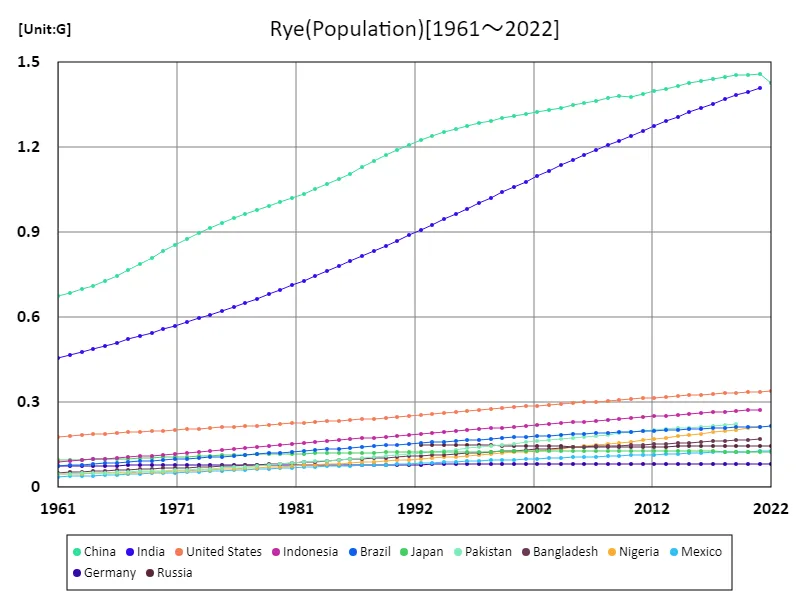
The maximum is 1.46G[2021] of China, and the current value is about 97.8%
Rye imports (latest year, countries around the world)
Looking at the rye import and export data for 2021, the largest overall export volume was 763kt from Germany, with an average of 19.8kt and a total of 2.16Mt. From this data, it is clear that Germany is the leading exporter of rye. Germany is known as a grain belt and supplies high-quality rye. Meanwhile, there are other major exporting countries, and competition in the global market is intensifying. In addition, rye exports and imports are easily affected by fluctuations in demand, so it is important to maintain a balance between demand and supply. In addition, factors such as climate change and changes in agricultural policies also affect exports and imports. From past trends, the global rye market has been stable, with imports from diverse sources. This maintains a situation that can flexibly respond to increases and decreases in demand and changes in the supply and demand balance by region.
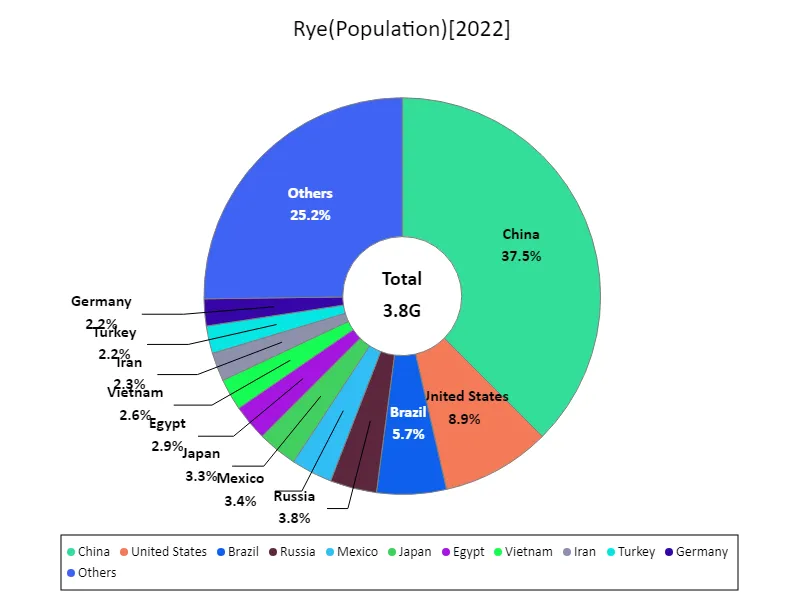
The maximum is 1.43G of China, the average is 58.5M, and the total is 3.8G
Rye imports (continental)
Looking at rye import data, the highest overall import volume recorded in Europe in 1961 was 2.22 Mt, which is the current maximum. This suggests a significant change from the historical trend. Over the past decades, the global rye market has fluctuated due to various factors. These include climate change, changes in agricultural policies, and economic developments. In particular, from 1961 to the present, improvements in agricultural techniques and production methods have progressed, which have affected rye production and supply. In addition, international trade liberalization and developments in transportation infrastructure have also made rye easier to transport and trade. It is likely that the combination of these factors has led to the current import volume being the highest ever. Going forward, rye import volumes may fluctuate depending on changes in demand and market conditions.
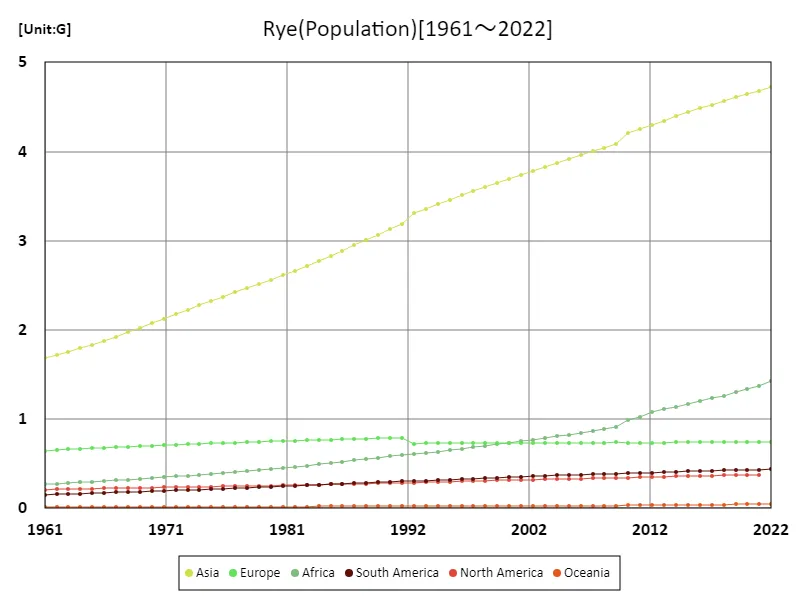
The maximum is the latest one, 4.72G of Asia
Rye imports (latest year, continental)
Looking at the rye import data for 2021, the highest overall import volume was 1.81Mt in Europe, with an average of 433kt and a total of 2.16Mt. From this data, it is clear that Europe is the main importing region for rye. Europe has long been the main producing region for rye, and although production is increasing in some countries, they import to meet demand. In addition, the demand for rye is increasing in other regions, which is leading to increased competition in the international market. Under these circumstances, import volumes fluctuate according to fluctuations in demand and changes in supply sources. In addition, factors such as climate change and changes in agricultural policies also affect the import volume. From the trend of the past few years, the global rye market is stable, with imports from diverse sources. This maintains a situation that can flexibly respond to increases and decreases in demand and changes in the supply and demand balance by region.
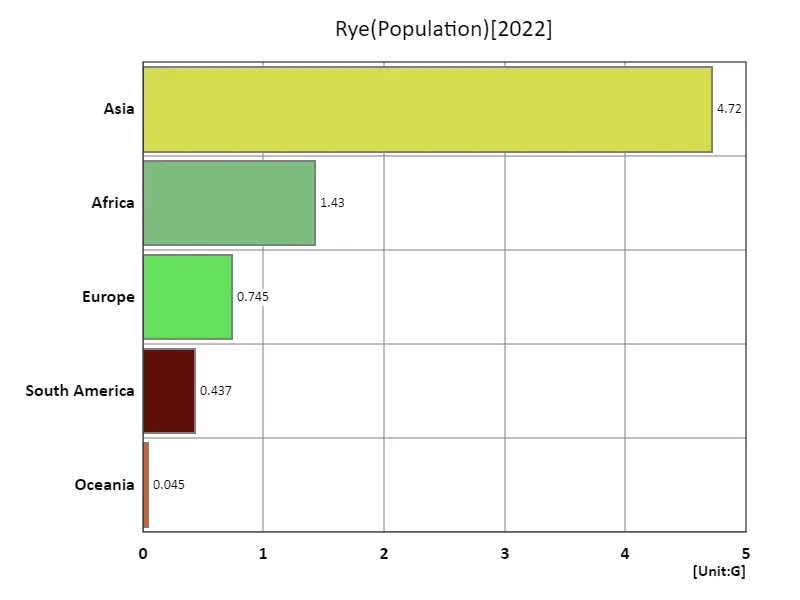
The maximum is 4.72G of Asia, the average is 1.47G, and the total is 7.37G
Main data
| Others(Rye, Population) [G] | ||||||||||
|---|---|---|---|---|---|---|---|---|---|---|
| World | Asia | Lower-middle-income countries | Upper-middle-income countries | Southern Asia | Net Food Importing Developing Countries | Eastern Asia | China | India | Africa | |
| 2022 | 7.98 | 4.72 | 3.45 | 2.56 | 1.43 | 1.43 | ||||
| 2021 | 7.91 | 4.68 | 3.41 | 2.55 | 1.99 | 1.7 | 1.66 | 1.46 | 1.41 | 1.37 |
| 2020 | 7.84 | 4.65 | 3.37 | 2.54 | 1.97 | 1.67 | 1.66 | 1.46 | 1.4 | 1.34 |
| 2019 | 7.76 | 4.61 | 3.33 | 2.53 | 1.95 | 1.63 | 1.66 | 1.45 | 1.38 | 1.3 |
| 2018 | 7.68 | 4.57 | 3.28 | 2.52 | 1.93 | 1.59 | 1.66 | 1.45 | 1.37 | 1.26 |
| 2017 | 7.6 | 4.53 | 3.24 | 2.5 | 1.9 | 1.56 | 1.65 | 1.44 | 1.35 | 1.23 |
| 2016 | 7.51 | 4.48 | 3.19 | 2.48 | 1.88 | 1.53 | 1.64 | 1.43 | 1.34 | 1.2 |
| 2015 | 7.43 | 4.44 | 3.14 | 2.46 | 1.86 | 1.5 | 1.63 | 1.43 | 1.32 | 1.17 |
| 2014 | 7.34 | 4.39 | 3.1 | 2.44 | 1.83 | 1.46 | 1.62 | 1.42 | 1.31 | 1.14 |
| 2013 | 7.25 | 4.35 | 3.05 | 2.42 | 1.81 | 1.43 | 1.61 | 1.41 | 1.29 | 1.11 |
| 2012 | 7.16 | 4.3 | 3.01 | 2.4 | 1.79 | 1.4 | 1.6 | 1.4 | 1.27 | 1.08 |
| 2011 | 7.07 | 4.25 | 2.96 | 2.38 | 1.76 | 1.34 | 1.59 | 1.39 | 1.26 | 1.02 |
| 2010 | 6.99 | 4.2 | 2.91 | 2.36 | 1.74 | 1.31 | 1.58 | 1.38 | 1.24 | 0.99 |
| 2009 | 6.9 | 4.09 | 2.87 | 2.35 | 1.66 | 1.21 | 1.58 | 1.38 | 1.22 | 0.91 |
| 2008 | 6.81 | 4.04 | 2.82 | 2.33 | 1.64 | 1.19 | 1.58 | 1.37 | 1.21 | 0.89 |
| 2007 | 6.73 | 4 | 2.78 | 2.31 | 1.61 | 1.17 | 1.57 | 1.36 | 1.19 | 0.87 |
| 2006 | 6.64 | 3.96 | 2.74 | 2.29 | 1.59 | 1.14 | 1.56 | 1.36 | 1.17 | 0.85 |
| 2005 | 6.56 | 3.91 | 2.69 | 2.28 | 1.57 | 1.12 | 1.55 | 1.35 | 1.15 | 0.83 |
| 2004 | 6.48 | 3.87 | 2.65 | 2.26 | 1.55 | 1.1 | 1.54 | 1.34 | 1.14 | 0.81 |
| 2003 | 6.39 | 3.83 | 2.6 | 2.24 | 1.52 | 1.08 | 1.53 | 1.33 | 1.12 | 0.79 |
| 2002 | 6.31 | 3.78 | 2.56 | 2.23 | 1.5 | 1.06 | 1.52 | 1.32 | 1.1 | 0.77 |
| 2001 | 6.23 | 3.74 | 2.51 | 2.21 | 1.47 | 1.03 | 1.51 | 1.32 | 1.08 | 0.75 |
| 2000 | 6.15 | 3.69 | 2.47 | 2.19 | 1.45 | 1.01 | 1.51 | 1.31 | 1.06 | 0.74 |
| 1999 | 6.07 | 3.65 | 2.42 | 2.17 | 1.42 | 0.99 | 1.5 | 1.3 | 1.04 | 0.72 |
| 1998 | 5.99 | 3.6 | 2.38 | 2.16 | 1.4 | 0.97 | 1.49 | 1.29 | 1.02 | 0.7 |
| 1997 | 5.91 | 3.56 | 2.33 | 2.14 | 1.37 | 0.95 | 1.48 | 1.29 | 1 | 0.68 |
| 1996 | 5.83 | 3.51 | 2.29 | 2.12 | 1.35 | 0.93 | 1.47 | 1.28 | 0.98 | 0.67 |
| 1995 | 5.74 | 3.46 | 2.24 | 2.1 | 1.32 | 0.9 | 1.46 | 1.27 | 0.96 | 0.65 |
| 1994 | 5.66 | 3.41 | 2.2 | 2.08 | 1.29 | 0.88 | 1.45 | 1.25 | 0.95 | 0.64 |
| 1993 | 5.58 | 3.36 | 2.15 | 2.05 | 1.27 | 0.86 | 1.43 | 1.24 | 0.93 | 0.62 |
| 1992 | 5.49 | 3.31 | 2.11 | 2.03 | 1.24 | 0.85 | 1.42 | 1.23 | 0.91 | 0.61 |
| 1991 | 5.41 | 3.18 | 2.07 | 2.01 | 1.22 | 0.82 | 1.4 | 1.21 | 0.89 | 0.6 |
| 1990 | 5.32 | 3.13 | 2.02 | 1.98 | 1.19 | 0.8 | 1.38 | 1.19 | 0.87 | 0.58 |
| 1989 | 5.22 | 3.07 | 1.98 | 1.95 | 1.17 | 0.78 | 1.36 | 1.17 | 0.85 | 0.57 |
| 1988 | 5.13 | 3.01 | 1.93 | 1.92 | 1.14 | 0.76 | 1.34 | 1.15 | 0.83 | 0.55 |
| 1987 | 5.04 | 2.95 | 1.89 | 1.88 | 1.11 | 0.74 | 1.31 | 1.13 | 0.82 | 0.54 |
| 1986 | 4.95 | 2.89 | 1.84 | 1.85 | 1.09 | 0.72 | 1.29 | 1.11 | 0.8 | 0.52 |
| 1985 | 4.86 | 2.83 | 1.8 | 1.82 | 1.06 | 0.71 | 1.27 | 1.09 | 0.78 | 0.51 |
| 1984 | 4.78 | 2.77 | 1.76 | 1.79 | 1.04 | 0.69 | 1.25 | 1.07 | 0.76 | 0.49 |
| 1983 | 4.69 | 2.72 | 1.72 | 1.76 | 1.01 | 0.67 | 1.23 | 1.05 | 0.75 | 0.48 |
| 1982 | 4.61 | 2.67 | 1.67 | 1.73 | 0.99 | 0.65 | 1.21 | 1.04 | 0.73 | 0.47 |
| 1981 | 4.52 | 2.61 | 1.63 | 1.71 | 0.97 | 0.63 | 1.2 | 1.02 | 0.71 | 0.45 |
| 1980 | 4.44 | 2.56 | 1.59 | 1.68 | 0.94 | 0.62 | 1.18 | 1.01 | 0.7 | 0.44 |
| 1979 | 4.37 | 2.51 | 1.55 | 1.65 | 0.92 | 0.6 | 1.16 | 0.99 | 0.68 | 0.43 |
| 1978 | 4.29 | 2.47 | 1.51 | 1.63 | 0.9 | 0.59 | 1.15 | 0.98 | 0.67 | 0.42 |
| 1977 | 4.22 | 2.42 | 1.48 | 1.6 | 0.88 | 0.57 | 1.13 | 0.97 | 0.65 | 0.41 |
| 1976 | 4.14 | 2.37 | 1.44 | 1.58 | 0.86 | 0.56 | 1.12 | 0.95 | 0.64 | 0.4 |
| 1975 | 4.07 | 2.32 | 1.41 | 1.55 | 0.83 | 0.55 | 1.1 | 0.93 | 0.62 | 0.39 |
| 1974 | 4 | 2.27 | 1.38 | 1.52 | 0.82 | 0.53 | 1.08 | 0.92 | 0.61 | 0.38 |
| 1973 | 3.92 | 2.22 | 1.35 | 1.49 | 0.8 | 0.52 | 1.06 | 0.9 | 0.6 | 0.37 |
| 1972 | 3.84 | 2.17 | 1.32 | 1.46 | 0.78 | 0.51 | 1.03 | 0.88 | 0.58 | 0.36 |
| 1971 | 3.77 | 2.12 | 1.29 | 1.43 | 0.76 | 0.49 | 1.01 | 0.85 | 0.57 | 0.35 |
| 1970 | 3.7 | 2.07 | 1.26 | 1.4 | 0.74 | 0.48 | 0.98 | 0.83 | 0.56 | 0.34 |
| 1969 | 3.62 | 2.02 | 1.23 | 1.37 | 0.73 | 0.47 | 0.96 | 0.81 | 0.55 | 0.33 |
| 1968 | 3.55 | 1.97 | 1.2 | 1.34 | 0.71 | 0.46 | 0.93 | 0.79 | 0.53 | 0.32 |
| 1967 | 3.48 | 1.92 | 1.17 | 1.31 | 0.69 | 0.45 | 0.91 | 0.77 | 0.52 | 0.31 |
| 1966 | 3.41 | 1.88 | 1.14 | 1.28 | 0.68 | 0.44 | 0.89 | 0.75 | 0.51 | 0.31 |
| 1965 | 3.34 | 1.83 | 1.12 | 1.25 | 0.66 | 0.42 | 0.87 | 0.73 | 0.5 | 0.3 |
| 1964 | 3.27 | 1.79 | 1.09 | 1.22 | 0.65 | 0.41 | 0.85 | 0.71 | 0.49 | 0.29 |
| 1963 | 3.2 | 1.75 | 1.07 | 1.18 | 0.63 | 0.4 | 0.83 | 0.7 | 0.48 | 0.28 |
| 1962 | 3.13 | 1.72 | 1.04 | 1.15 | 0.62 | 0.39 | 0.82 | 0.69 | 0.47 | 0.28 |
| 1961 | 3.07 | 1.69 | 1.02 | 1.13 | 0.61 | 0.38 | 0.81 | 0.68 | 0.46 | 0.27 |

Comments