Abstract
With regard to the global import and export of oats, it is clear that Canada is the largest exporter in 2021. This trend has been continuing for many years, and Canada’s rich agricultural resources and technological capabilities have established it as a major producer of this grain. Oats are increasingly in demand as a health-conscious food, which has led to an increase in global demand. Other countries in North America and European countries are also important producers, so the demand and supply of oats are balanced in the world market. Oats are also used as livestock feed, which also accounts for part of the demand. Quality and price are factors that determine competitiveness in the international market, but with the increasing importance of sustainable farming methods and quality control, these factors may affect future market trends.
Oat export volume (worldwide)
In terms of oat exports, Canada’s record of 2.5 Mt achieved in 2020 is noteworthy. This peak is supported by the strength of the Canadian agricultural sector and the increasing demand for oats. However, exports have declined slightly in 2021, with Canada’s exports settling at 2.18 Mt. This decline is likely due to various factors affecting agricultural production, such as climate change and weather volatility, as well as changes in agricultural policies. Changes in global demand patterns are also affecting export volumes. Oats are increasingly in demand as a health-conscious food, which supports export volumes at a certain level. In addition, the production volumes of competing countries and advances in agricultural technology also affect the fluctuations in export volumes. Canada’s exports are at 87.2% of their peak, suggesting a shift in the balance between demand and supply. In the future, the global oat market may experience further changes as it responds to sustainable agricultural methods and changes in demand.
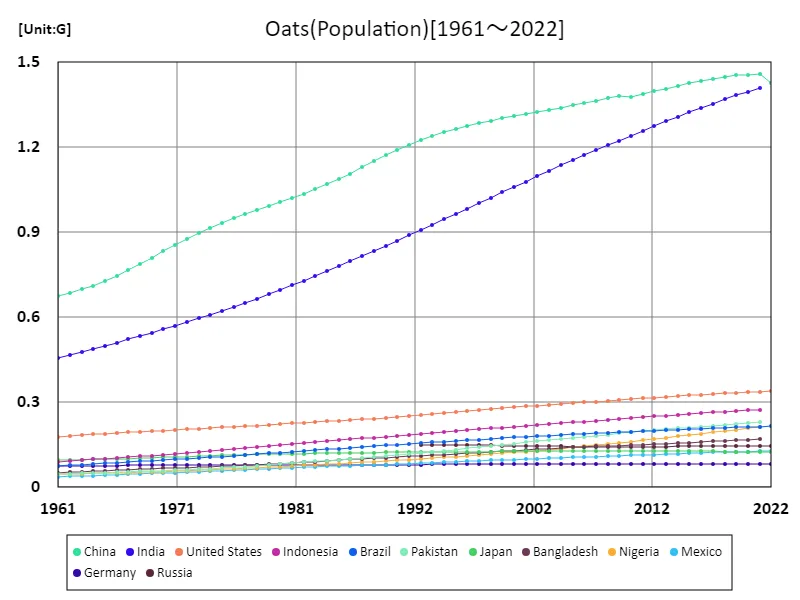
The maximum is 1.46G[2021] of China, and the current value is about 97.8%
Oat export volume (latest year, countries around the world)
Regarding global oat exports and imports, several features emerge from the 2021 data. First, Canada is the largest exporter, exporting 2.18 Mt. This is equivalent to about 37% of global oat exports. Canada’s grain productivity and high quality support its leading position in the world market. Meanwhile, the global average export volume is 52.1 kt, and Canada’s export volume is several times that amount. This difference suggests Canada’s large-scale agricultural production system and efficiency. In addition, the global export volume of oats is 5.94 Mt, which reflects the balance between demand and supply. Stability of demand and increasing demand as a health-conscious food support oat exports. In addition, oats are also used as livestock feed, which also accounts for part of the demand. In the global oat market, quality and price are factors that determine competitiveness. As the importance of quality control and sustainable agricultural methods increases, producing countries focus on these factors to maintain their competitiveness. In the future, factors such as climate change and changes in agricultural policies may impact the market, however, the global oats market is expected to continue experiencing growth and change.
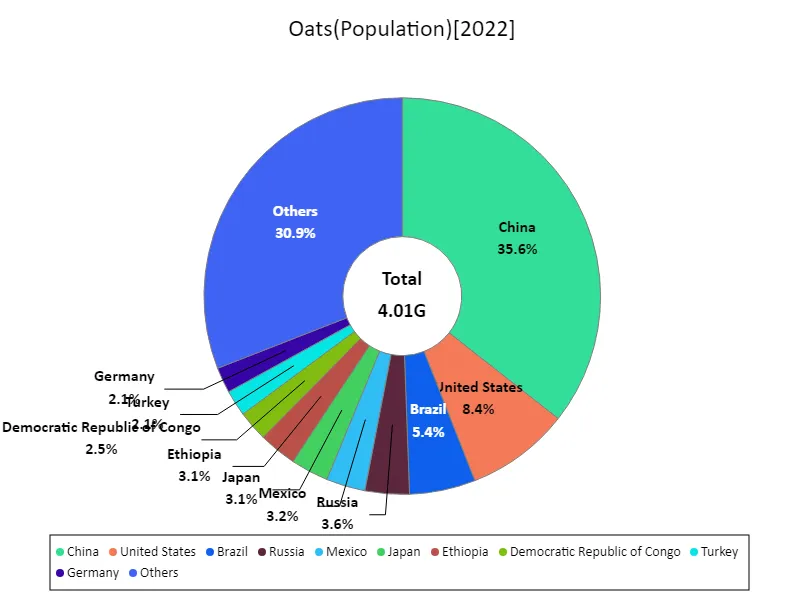
The maximum is 1.43G of China, the average is 49.5M, and the total is 4.01G
Oat exports (continent)
The latest data on oat exports reveals that North America is the largest export region. Based on the data for 1961, North America’s exports reached 2.57 Mt, which is the highest. This trend can be attributed to the strength of the North American agricultural sector and technological innovation. North America has rich agricultural resources and favorable climatic conditions for oat production. Also, since the current value is the highest, North America’s oat exports have likely increased over the past few decades. This increase could be due to the growing global demand and advances in agricultural technology. Oats are increasingly in demand as a health-conscious food, which is one of the reasons for the increase in exports. The largest oat export in North America also indicates high agricultural productivity across the region. This keeps North America competitive in the global market. In the future, factors such as climate change and changes in market demand may affect North American oat production, but for now, North America appears to remain the center of oat exports.
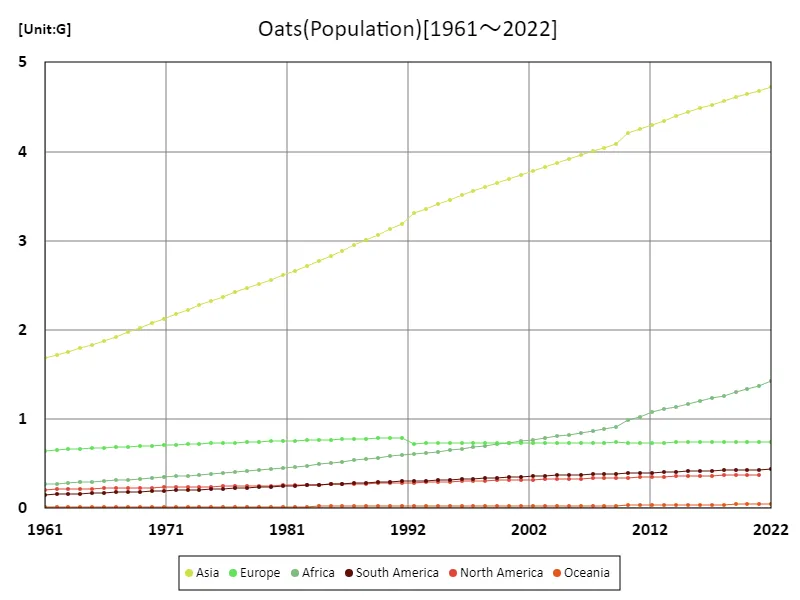
The maximum is the latest one, 4.72G of Asia
Oat exports (latest year, continental)
Oat export volume data for 2021 shows that Europe is the largest export region. European exports reached 2.49Mt, accounting for about 42% of the world’s total oat exports. This trend is likely due to Europe’s rich agricultural production capacity and high demand for oats. European oat exports show a significant difference from the average of 986kt. This reflects the diversity of oat-producing regions within Europe and the fact that each region has different climatic conditions and agricultural techniques. Europe has a long history of developing agriculture, and many countries are involved in grain production. The total global oat export volume is 5.92Mt, of which the majority is made up of exports from Europe. Oats are in high demand as a health food, which supports the European export market. European agriculture also focuses on sustainability, and is highly regarded for its quality and safety. In the future, factors such as climate change and changes in market demand may affect European oat exports. However, at the moment Europe is the center of oat exports and is expected to maintain its position.
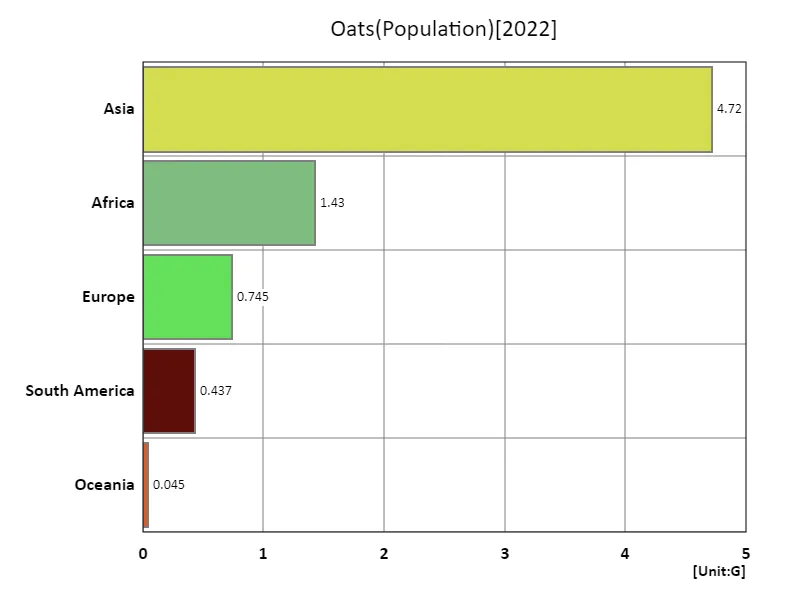
The maximum is 4.72G of Asia, the average is 1.47G, and the total is 7.37G
Main data
| Others(Oats, Population) [G] | ||||||||||
|---|---|---|---|---|---|---|---|---|---|---|
| World | Asia | Lower-middle-income countries | Upper-middle-income countries | Southern Asia | Net Food Importing Developing Countries | Eastern Asia | China | India | Africa | |
| 2022 | 7.98 | 4.72 | 3.45 | 2.56 | 1.43 | 1.43 | ||||
| 2021 | 7.91 | 4.68 | 3.41 | 2.55 | 1.99 | 1.7 | 1.66 | 1.46 | 1.41 | 1.37 |
| 2020 | 7.84 | 4.65 | 3.37 | 2.54 | 1.97 | 1.67 | 1.66 | 1.46 | 1.4 | 1.34 |
| 2019 | 7.76 | 4.61 | 3.33 | 2.53 | 1.95 | 1.63 | 1.66 | 1.45 | 1.38 | 1.3 |
| 2018 | 7.68 | 4.57 | 3.28 | 2.52 | 1.93 | 1.59 | 1.66 | 1.45 | 1.37 | 1.26 |
| 2017 | 7.6 | 4.53 | 3.24 | 2.5 | 1.9 | 1.56 | 1.65 | 1.44 | 1.35 | 1.23 |
| 2016 | 7.51 | 4.48 | 3.19 | 2.48 | 1.88 | 1.53 | 1.64 | 1.43 | 1.34 | 1.2 |
| 2015 | 7.43 | 4.44 | 3.14 | 2.46 | 1.86 | 1.5 | 1.63 | 1.43 | 1.32 | 1.17 |
| 2014 | 7.34 | 4.39 | 3.1 | 2.44 | 1.83 | 1.46 | 1.62 | 1.42 | 1.31 | 1.14 |
| 2013 | 7.25 | 4.35 | 3.05 | 2.42 | 1.81 | 1.43 | 1.61 | 1.41 | 1.29 | 1.11 |
| 2012 | 7.16 | 4.3 | 3.01 | 2.4 | 1.79 | 1.4 | 1.6 | 1.4 | 1.27 | 1.08 |
| 2011 | 7.07 | 4.25 | 2.96 | 2.38 | 1.76 | 1.34 | 1.59 | 1.39 | 1.26 | 1.02 |
| 2010 | 6.99 | 4.2 | 2.91 | 2.36 | 1.74 | 1.31 | 1.58 | 1.38 | 1.24 | 0.99 |
| 2009 | 6.9 | 4.09 | 2.87 | 2.35 | 1.66 | 1.21 | 1.58 | 1.38 | 1.22 | 0.91 |
| 2008 | 6.81 | 4.04 | 2.82 | 2.33 | 1.64 | 1.19 | 1.58 | 1.37 | 1.21 | 0.89 |
| 2007 | 6.73 | 4 | 2.78 | 2.31 | 1.61 | 1.17 | 1.57 | 1.36 | 1.19 | 0.87 |
| 2006 | 6.64 | 3.96 | 2.74 | 2.29 | 1.59 | 1.14 | 1.56 | 1.36 | 1.17 | 0.85 |
| 2005 | 6.56 | 3.91 | 2.69 | 2.28 | 1.57 | 1.12 | 1.55 | 1.35 | 1.15 | 0.83 |
| 2004 | 6.48 | 3.87 | 2.65 | 2.26 | 1.55 | 1.1 | 1.54 | 1.34 | 1.14 | 0.81 |
| 2003 | 6.39 | 3.83 | 2.6 | 2.24 | 1.52 | 1.08 | 1.53 | 1.33 | 1.12 | 0.79 |
| 2002 | 6.31 | 3.78 | 2.56 | 2.23 | 1.5 | 1.06 | 1.52 | 1.32 | 1.1 | 0.77 |
| 2001 | 6.23 | 3.74 | 2.51 | 2.21 | 1.47 | 1.03 | 1.51 | 1.32 | 1.08 | 0.75 |
| 2000 | 6.15 | 3.69 | 2.47 | 2.19 | 1.45 | 1.01 | 1.51 | 1.31 | 1.06 | 0.74 |
| 1999 | 6.07 | 3.65 | 2.42 | 2.17 | 1.42 | 0.99 | 1.5 | 1.3 | 1.04 | 0.72 |
| 1998 | 5.99 | 3.6 | 2.38 | 2.16 | 1.4 | 0.97 | 1.49 | 1.29 | 1.02 | 0.7 |
| 1997 | 5.91 | 3.56 | 2.33 | 2.14 | 1.37 | 0.95 | 1.48 | 1.29 | 1 | 0.68 |
| 1996 | 5.83 | 3.51 | 2.29 | 2.12 | 1.35 | 0.93 | 1.47 | 1.28 | 0.98 | 0.67 |
| 1995 | 5.74 | 3.46 | 2.24 | 2.1 | 1.32 | 0.9 | 1.46 | 1.27 | 0.96 | 0.65 |
| 1994 | 5.66 | 3.41 | 2.2 | 2.08 | 1.29 | 0.88 | 1.45 | 1.25 | 0.95 | 0.64 |
| 1993 | 5.58 | 3.36 | 2.15 | 2.05 | 1.27 | 0.86 | 1.43 | 1.24 | 0.93 | 0.62 |
| 1992 | 5.49 | 3.31 | 2.11 | 2.03 | 1.24 | 0.85 | 1.42 | 1.23 | 0.91 | 0.61 |
| 1991 | 5.41 | 3.18 | 2.07 | 2.01 | 1.22 | 0.82 | 1.4 | 1.21 | 0.89 | 0.6 |
| 1990 | 5.32 | 3.13 | 2.02 | 1.98 | 1.19 | 0.8 | 1.38 | 1.19 | 0.87 | 0.58 |
| 1989 | 5.22 | 3.07 | 1.98 | 1.95 | 1.17 | 0.78 | 1.36 | 1.17 | 0.85 | 0.57 |
| 1988 | 5.13 | 3.01 | 1.93 | 1.92 | 1.14 | 0.76 | 1.34 | 1.15 | 0.83 | 0.55 |
| 1987 | 5.04 | 2.95 | 1.89 | 1.88 | 1.11 | 0.74 | 1.31 | 1.13 | 0.82 | 0.54 |
| 1986 | 4.95 | 2.89 | 1.84 | 1.85 | 1.09 | 0.72 | 1.29 | 1.11 | 0.8 | 0.52 |
| 1985 | 4.86 | 2.83 | 1.8 | 1.82 | 1.06 | 0.71 | 1.27 | 1.09 | 0.78 | 0.51 |
| 1984 | 4.78 | 2.77 | 1.76 | 1.79 | 1.04 | 0.69 | 1.25 | 1.07 | 0.76 | 0.49 |
| 1983 | 4.69 | 2.72 | 1.72 | 1.76 | 1.01 | 0.67 | 1.23 | 1.05 | 0.75 | 0.48 |
| 1982 | 4.61 | 2.67 | 1.67 | 1.73 | 0.99 | 0.65 | 1.21 | 1.04 | 0.73 | 0.47 |
| 1981 | 4.52 | 2.61 | 1.63 | 1.71 | 0.97 | 0.63 | 1.2 | 1.02 | 0.71 | 0.45 |
| 1980 | 4.44 | 2.56 | 1.59 | 1.68 | 0.94 | 0.62 | 1.18 | 1.01 | 0.7 | 0.44 |
| 1979 | 4.37 | 2.51 | 1.55 | 1.65 | 0.92 | 0.6 | 1.16 | 0.99 | 0.68 | 0.43 |
| 1978 | 4.29 | 2.47 | 1.51 | 1.63 | 0.9 | 0.59 | 1.15 | 0.98 | 0.67 | 0.42 |
| 1977 | 4.22 | 2.42 | 1.48 | 1.6 | 0.88 | 0.57 | 1.13 | 0.97 | 0.65 | 0.41 |
| 1976 | 4.14 | 2.37 | 1.44 | 1.58 | 0.86 | 0.56 | 1.12 | 0.95 | 0.64 | 0.4 |
| 1975 | 4.07 | 2.32 | 1.41 | 1.55 | 0.83 | 0.55 | 1.1 | 0.93 | 0.62 | 0.39 |
| 1974 | 4 | 2.27 | 1.38 | 1.52 | 0.82 | 0.53 | 1.08 | 0.92 | 0.61 | 0.38 |
| 1973 | 3.92 | 2.22 | 1.35 | 1.49 | 0.8 | 0.52 | 1.06 | 0.9 | 0.6 | 0.37 |
| 1972 | 3.84 | 2.17 | 1.32 | 1.46 | 0.78 | 0.51 | 1.03 | 0.88 | 0.58 | 0.36 |
| 1971 | 3.77 | 2.12 | 1.29 | 1.43 | 0.76 | 0.49 | 1.01 | 0.85 | 0.57 | 0.35 |
| 1970 | 3.7 | 2.07 | 1.26 | 1.4 | 0.74 | 0.48 | 0.98 | 0.83 | 0.56 | 0.34 |
| 1969 | 3.62 | 2.02 | 1.23 | 1.37 | 0.73 | 0.47 | 0.96 | 0.81 | 0.55 | 0.33 |
| 1968 | 3.55 | 1.97 | 1.2 | 1.34 | 0.71 | 0.46 | 0.93 | 0.79 | 0.53 | 0.32 |
| 1967 | 3.48 | 1.92 | 1.17 | 1.31 | 0.69 | 0.45 | 0.91 | 0.77 | 0.52 | 0.31 |
| 1966 | 3.41 | 1.88 | 1.14 | 1.28 | 0.68 | 0.44 | 0.89 | 0.75 | 0.51 | 0.31 |
| 1965 | 3.34 | 1.83 | 1.12 | 1.25 | 0.66 | 0.42 | 0.87 | 0.73 | 0.5 | 0.3 |
| 1964 | 3.27 | 1.79 | 1.09 | 1.22 | 0.65 | 0.41 | 0.85 | 0.71 | 0.49 | 0.29 |
| 1963 | 3.2 | 1.75 | 1.07 | 1.18 | 0.63 | 0.4 | 0.83 | 0.7 | 0.48 | 0.28 |
| 1962 | 3.13 | 1.72 | 1.04 | 1.15 | 0.62 | 0.39 | 0.82 | 0.69 | 0.47 | 0.28 |
| 1961 | 3.07 | 1.69 | 1.02 | 1.13 | 0.61 | 0.38 | 0.81 | 0.68 | 0.46 | 0.27 |

Comments