Abstract
Barley, a versatile cereal grain, has seen varied land use trends over the years. Historically, it was widely grown across temperate regions due to its adaptability to different climates and soil conditions. In recent decades, global barley cultivation has shifted, with significant production now centered in regions like Russia. As of 2022, Russia leads in barley acreage, covering 7.94 million hectares. This rise reflects Russia’s favorable growing conditions and strategic focus on barley for both domestic use and export. Meanwhile, other major producers have experienced fluctuations in land use due to changing agricultural priorities and climate impacts.
Land use for barley (Worldwide)
Barley cultivation has shown significant trends over the decades. Russia, historically a major producer, reached its peak in 1994 with 16.4 million hectares under barley. Since then, barley acreage in Russia has decreased, with current figures at 48.4% of the 1994 peak, totaling 7.94 million hectares in 2022. This decline reflects broader shifts in agricultural practices and crop priorities. Despite this, Russia remains a leading barley producer due to its suitable climate and large arable land. Globally, barley’s land use has also fluctuated, influenced by changing demand and agricultural policies.
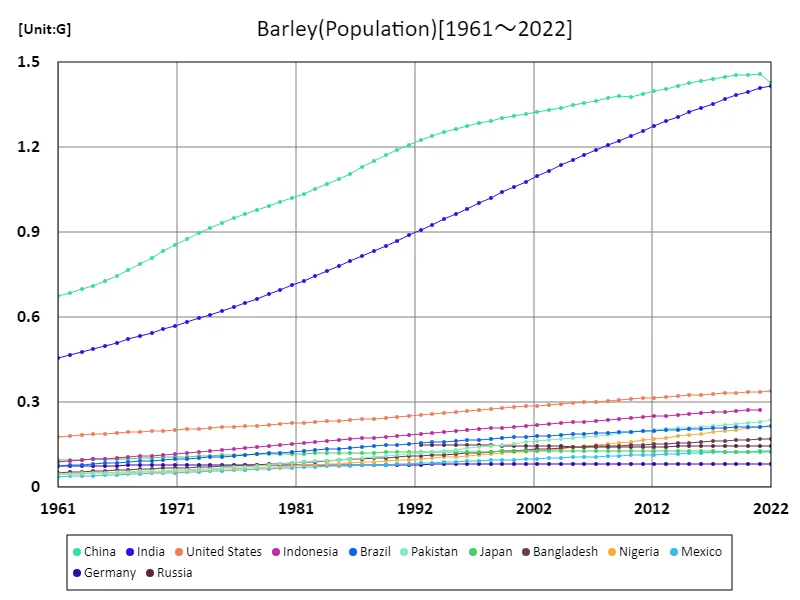
The maximum is 1.46G[2021] of China, and the current value is about 97.8%
Land use for barley (latest year, worldwide)
In 2022, Russia leads global barley cultivation with 7.94 million hectares, a notable share of the total 47.1 million hectares worldwide. This figure is significantly higher than the global average of 445,000 hectares per country, highlighting Russia’s dominance in barley production. Historically, barley cultivation has fluctuated due to varying agricultural practices and economic conditions. The high land use in Russia underscores its favorable growing conditions and strategic importance in global barley markets, despite a trend of shifting agricultural priorities and fluctuating global production levels.
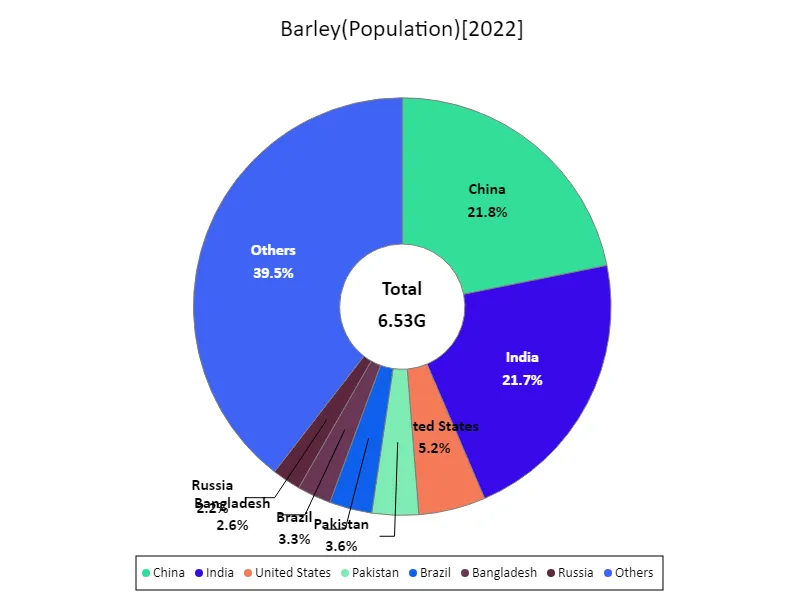
The maximum is 1.43G of China, the average is 61.6M, and the total is 6.53G
Barley land use (continent)
As of 1961, Europe had the highest recorded barley cultivation, peaking at 57.7 million hectares. This prominence reflects Europe’s historically significant role in barley production, supported by favorable climate conditions and extensive agricultural infrastructure. Over time, barley acreage in Europe has fluctuated due to changes in crop priorities, economic factors, and shifting agricultural practices. While Europe remains a key player in global barley production, other regions have also increased their cultivation, diversifying global barley supply and influencing production trends.
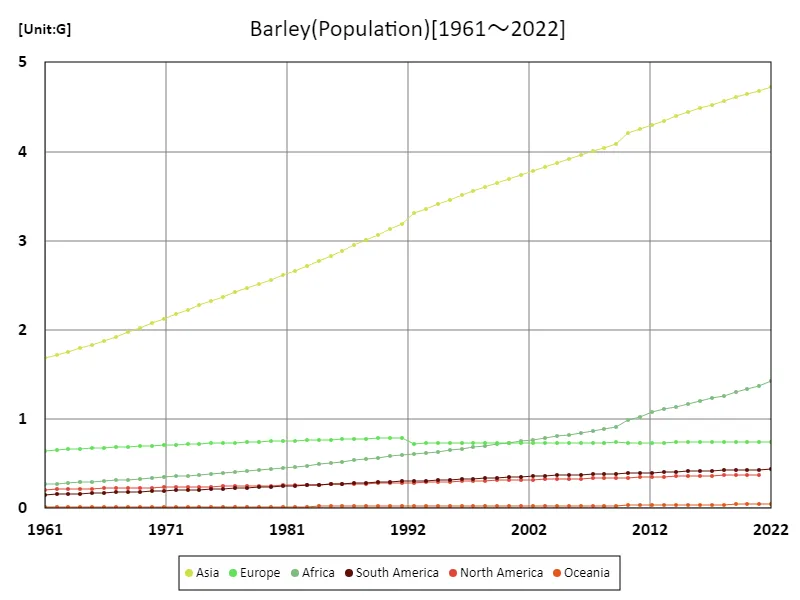
The maximum is the latest one, 4.72G of Asia
Barley land use (latest year, continental)
In 2022, Europe leads global barley cultivation with 21.8 million hectares, a significant share of the total 46.8 million hectares worldwide. This is notably higher than the global average of 7.8 million hectares per region, showcasing Europe’s prominent role in barley production. Historically, Europe has been a major producer due to its favorable climate and established agricultural practices. Despite recent shifts in global production and varying regional focuses, Europe’s large barley acreage remains a key factor in the global supply, reflecting both its agricultural legacy and ongoing importance.
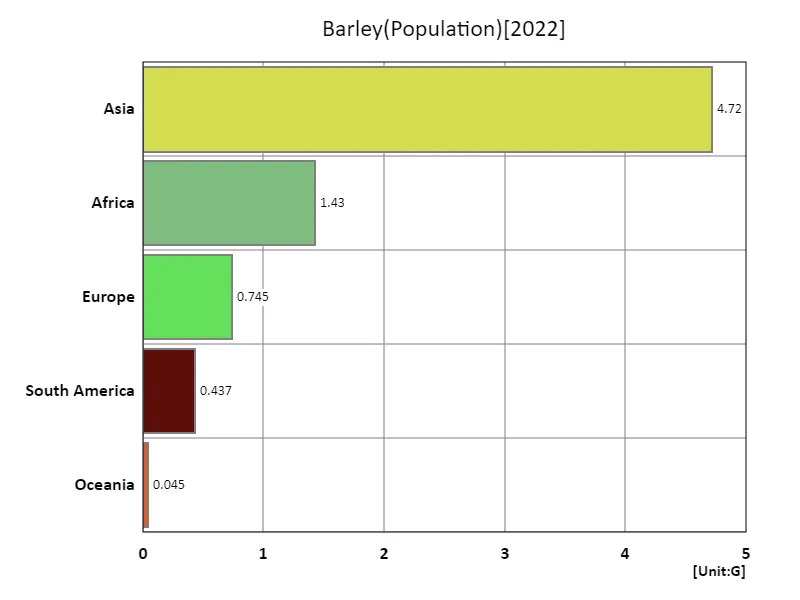
The maximum is 4.72G of Asia, the average is 1.47G, and the total is 7.37G
Main data
| Others(Barley, Population) [G] | ||||||||||
|---|---|---|---|---|---|---|---|---|---|---|
| World | Asia | Lower-middle-income countries | Upper-middle-income countries | Africa | China | India | High-income countries | Europe | Low-income countries | |
| 2022 | 7.98 | 4.72 | 3.45 | 2.56 | 1.43 | 1.43 | 1.42 | 1.22 | 0.74 | 0.72 |
| 2021 | 7.91 | 4.68 | 3.41 | 2.55 | 1.37 | 1.46 | 1.41 | 1.22 | 0.74 | 0.7 |
| 2020 | 7.84 | 4.65 | 3.37 | 2.54 | 1.34 | 1.46 | 1.4 | 1.22 | 0.74 | 0.68 |
| 2019 | 7.76 | 4.61 | 3.33 | 2.53 | 1.3 | 1.45 | 1.38 | 1.21 | 0.74 | 0.66 |
| 2018 | 7.68 | 4.57 | 3.28 | 2.52 | 1.26 | 1.45 | 1.37 | 1.21 | 0.74 | 0.64 |
| 2017 | 7.6 | 4.53 | 3.24 | 2.5 | 1.23 | 1.44 | 1.35 | 1.2 | 0.74 | 0.63 |
| 2016 | 7.51 | 4.48 | 3.19 | 2.48 | 1.2 | 1.43 | 1.34 | 1.2 | 0.74 | 0.61 |
| 2015 | 7.43 | 4.44 | 3.14 | 2.46 | 1.17 | 1.43 | 1.32 | 1.19 | 0.74 | 0.59 |
| 2014 | 7.34 | 4.39 | 3.1 | 2.44 | 1.14 | 1.42 | 1.31 | 1.18 | 0.74 | 0.58 |
| 2013 | 7.25 | 4.35 | 3.05 | 2.42 | 1.11 | 1.41 | 1.29 | 1.18 | 0.74 | 0.56 |
| 2012 | 7.16 | 4.3 | 3.01 | 2.4 | 1.08 | 1.4 | 1.27 | 1.17 | 0.74 | 0.55 |
| 2011 | 7.07 | 4.25 | 2.96 | 2.38 | 1.02 | 1.39 | 1.26 | 1.16 | 0.73 | 0.54 |
| 2010 | 6.99 | 4.2 | 2.91 | 2.36 | 0.99 | 1.38 | 1.24 | 1.15 | 0.73 | 0.52 |
| 2009 | 6.9 | 4.09 | 2.87 | 2.35 | 0.91 | 1.38 | 1.22 | 1.15 | 0.74 | 0.51 |
| 2008 | 6.81 | 4.04 | 2.82 | 2.33 | 0.89 | 1.37 | 1.21 | 1.14 | 0.74 | 0.49 |
| 2007 | 6.73 | 4 | 2.78 | 2.31 | 0.87 | 1.36 | 1.19 | 1.13 | 0.74 | 0.48 |
| 2006 | 6.64 | 3.96 | 2.74 | 2.29 | 0.85 | 1.36 | 1.17 | 1.12 | 0.73 | 0.46 |
| 2005 | 6.56 | 3.91 | 2.69 | 2.28 | 0.83 | 1.35 | 1.15 | 1.11 | 0.73 | 0.45 |
| 2004 | 6.48 | 3.87 | 2.65 | 2.26 | 0.81 | 1.34 | 1.14 | 1.1 | 0.73 | 0.44 |
| 2003 | 6.39 | 3.83 | 2.6 | 2.24 | 0.79 | 1.33 | 1.12 | 1.09 | 0.73 | 0.43 |
| 2002 | 6.31 | 3.78 | 2.56 | 2.23 | 0.77 | 1.32 | 1.1 | 1.09 | 0.73 | 0.41 |
| 2001 | 6.23 | 3.74 | 2.51 | 2.21 | 0.75 | 1.32 | 1.08 | 1.08 | 0.73 | 0.4 |
| 2000 | 6.15 | 3.69 | 2.47 | 2.19 | 0.74 | 1.31 | 1.06 | 1.07 | 0.73 | 0.39 |
| 1999 | 6.07 | 3.65 | 2.42 | 2.17 | 0.72 | 1.3 | 1.04 | 1.07 | 0.73 | 0.38 |
| 1998 | 5.99 | 3.6 | 2.38 | 2.16 | 0.7 | 1.29 | 1.02 | 1.06 | 0.73 | 0.37 |
| 1997 | 5.91 | 3.56 | 2.33 | 2.14 | 0.68 | 1.29 | 1 | 1.05 | 0.73 | 0.36 |
| 1996 | 5.83 | 3.51 | 2.29 | 2.12 | 0.67 | 1.28 | 0.98 | 1.05 | 0.73 | 0.35 |
| 1995 | 5.74 | 3.46 | 2.24 | 2.1 | 0.65 | 1.27 | 0.96 | 1.04 | 0.73 | 0.34 |
| 1994 | 5.66 | 3.41 | 2.2 | 2.08 | 0.64 | 1.25 | 0.95 | 1.03 | 0.73 | 0.33 |
| 1993 | 5.58 | 3.36 | 2.15 | 2.05 | 0.62 | 1.24 | 0.93 | 1.02 | 0.73 | 0.32 |
| 1992 | 5.49 | 3.31 | 2.11 | 2.03 | 0.61 | 1.23 | 0.91 | 1.02 | 0.73 | 0.31 |
| 1991 | 5.41 | 3.18 | 2.07 | 2.01 | 0.6 | 1.21 | 0.89 | 1.01 | 0.79 | 0.3 |
| 1990 | 5.32 | 3.13 | 2.02 | 1.98 | 0.58 | 1.19 | 0.87 | 1 | 0.79 | 0.3 |
| 1989 | 5.22 | 3.07 | 1.98 | 1.95 | 0.57 | 1.17 | 0.85 | 0.99 | 0.79 | 0.29 |
| 1988 | 5.13 | 3.01 | 1.93 | 1.92 | 0.55 | 1.15 | 0.83 | 0.99 | 0.78 | 0.28 |
| 1987 | 5.04 | 2.95 | 1.89 | 1.88 | 0.54 | 1.13 | 0.82 | 0.98 | 0.78 | 0.27 |
| 1986 | 4.95 | 2.89 | 1.84 | 1.85 | 0.52 | 1.11 | 0.8 | 0.97 | 0.77 | 0.27 |
| 1985 | 4.86 | 2.83 | 1.8 | 1.82 | 0.51 | 1.09 | 0.78 | 0.96 | 0.77 | 0.26 |
| 1984 | 4.78 | 2.77 | 1.76 | 1.79 | 0.49 | 1.07 | 0.76 | 0.96 | 0.77 | 0.25 |
| 1983 | 4.69 | 2.72 | 1.72 | 1.76 | 0.48 | 1.05 | 0.75 | 0.95 | 0.76 | 0.25 |
| 1982 | 4.61 | 2.67 | 1.67 | 1.73 | 0.47 | 1.04 | 0.73 | 0.94 | 0.76 | 0.24 |
| 1981 | 4.52 | 2.61 | 1.63 | 1.71 | 0.45 | 1.02 | 0.71 | 0.94 | 0.75 | 0.23 |
| 1980 | 4.44 | 2.56 | 1.59 | 1.68 | 0.44 | 1.01 | 0.7 | 0.93 | 0.75 | 0.23 |
| 1979 | 4.37 | 2.51 | 1.55 | 1.65 | 0.43 | 0.99 | 0.68 | 0.92 | 0.75 | 0.23 |
| 1978 | 4.29 | 2.47 | 1.51 | 1.63 | 0.42 | 0.98 | 0.67 | 0.91 | 0.74 | 0.22 |
| 1977 | 4.22 | 2.42 | 1.48 | 1.6 | 0.41 | 0.97 | 0.65 | 0.9 | 0.74 | 0.21 |
| 1976 | 4.14 | 2.37 | 1.44 | 1.58 | 0.4 | 0.95 | 0.64 | 0.9 | 0.73 | 0.21 |
| 1975 | 4.07 | 2.32 | 1.41 | 1.55 | 0.39 | 0.93 | 0.62 | 0.89 | 0.73 | 0.2 |
| 1974 | 4 | 2.27 | 1.38 | 1.52 | 0.38 | 0.92 | 0.61 | 0.88 | 0.72 | 0.2 |
| 1973 | 3.92 | 2.22 | 1.35 | 1.49 | 0.37 | 0.9 | 0.6 | 0.87 | 0.72 | 0.19 |
| 1972 | 3.84 | 2.17 | 1.32 | 1.46 | 0.36 | 0.88 | 0.58 | 0.87 | 0.71 | 0.19 |
| 1971 | 3.77 | 2.12 | 1.29 | 1.43 | 0.35 | 0.85 | 0.57 | 0.86 | 0.71 | 0.18 |
| 1970 | 3.7 | 2.07 | 1.26 | 1.4 | 0.34 | 0.83 | 0.56 | 0.85 | 0.7 | 0.18 |
| 1969 | 3.62 | 2.02 | 1.23 | 1.37 | 0.33 | 0.81 | 0.55 | 0.84 | 0.7 | 0.17 |
| 1968 | 3.55 | 1.97 | 1.2 | 1.34 | 0.32 | 0.79 | 0.53 | 0.83 | 0.69 | 0.17 |
| 1967 | 3.48 | 1.92 | 1.17 | 1.31 | 0.31 | 0.77 | 0.52 | 0.82 | 0.69 | 0.16 |
| 1966 | 3.41 | 1.88 | 1.14 | 1.28 | 0.31 | 0.75 | 0.51 | 0.81 | 0.68 | 0.16 |
| 1965 | 3.34 | 1.83 | 1.12 | 1.25 | 0.3 | 0.73 | 0.5 | 0.8 | 0.68 | 0.16 |
| 1964 | 3.27 | 1.79 | 1.09 | 1.22 | 0.29 | 0.71 | 0.49 | 0.79 | 0.67 | 0.15 |
| 1963 | 3.2 | 1.75 | 1.07 | 1.18 | 0.28 | 0.7 | 0.48 | 0.78 | 0.66 | 0.15 |
| 1962 | 3.13 | 1.72 | 1.04 | 1.15 | 0.28 | 0.69 | 0.47 | 0.78 | 0.65 | 0.15 |
| 1961 | 3.07 | 1.69 | 1.02 | 1.13 | 0.27 | 0.68 | 0.46 | 0.77 | 0.65 | 0.14 |


Comments