Abstract
Based on the 2022 data on wheat land use, India has the largest wheat cultivation area of 30.5 Mha. This figure shows that wheat cultivation occupies an important position in Indian agriculture. India is also one of the largest wheat producers in the world, highlighting its economic influence. Wheat cultivation plays a major role in India’s agricultural economy and contributes to the country’s food supply. In addition, the impact of India’s climatic conditions and agricultural policies must be considered. Factors such as climate change and technological innovations may affect future wheat cultivation area and production. Given this background, it can be said that wheat land use is a key sector in Indian agriculture and a key factor related to future food security.
Land use for wheat (Worldwide)
Considering the data on wheat land use from 1961 to 2022, the United States recorded the largest wheat cultivation area of 32.6 Mha in 1981. However, the trend since then has been downward, and the wheat cultivation area is currently maintained at 44% of the peak. This trend is caused by several factors. First, there is a change in agricultural policy in the United States. Changes in agricultural support systems and changes in market demand have influenced the decline in wheat cultivation. In addition, diversification of land use and advances in agricultural technology have also influenced it. For example, the introduction of agricultural mechanization and genetically modified technology has improved wheat production efficiency, making it possible to produce the same harvest with a smaller area. In addition, climate change and environmental issues also affect the wheat cultivation area. Considering these factors, it can be said that the decline in wheat cultivation area in the United States reflects changes in the agricultural system and the influence of external factors.
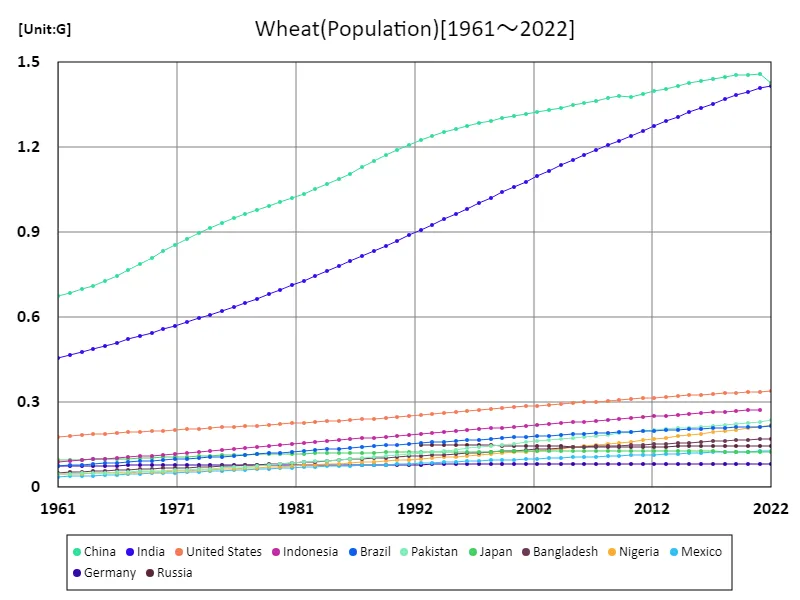
The maximum is 1.46G[2021] of China, and the current value is about 97.8%
Land use for wheat (latest year, world)
Considering the 2022 data on wheat land use, India has the largest wheat cultivation area at 30.5 Mha. This is about 14% of the total wheat cultivation area in the world. The average wheat cultivation area is 1.74 Mha, which suggests that wheat is cultivated on a small scale in various parts of the world. In total, 219 Mha is used for wheat cultivation worldwide. Considering the characteristics and trends so far, it can be noted that land use for wheat varies greatly from region to region. In some regions, wheat cultivation is thriving and positioned as an important component of food supply. However, in other regions, the area cultivated for wheat may be relatively small. This is due to various factors such as climatic conditions, agricultural policies, and regional food culture. In addition, the cultivation area and production volume of wheat have changed over time. The introduction of new technologies, changes in agricultural policies, and climate change have had an impact, leading to fluctuations in wheat production and cultivation area. Overall, land use for wheat occupies an important position in global agriculture, with different characteristics and trends observed in different regions. In the future, factors affecting wheat cultivation area and production volume need to be considered in order to build sustainable agricultural systems and ensure food security.
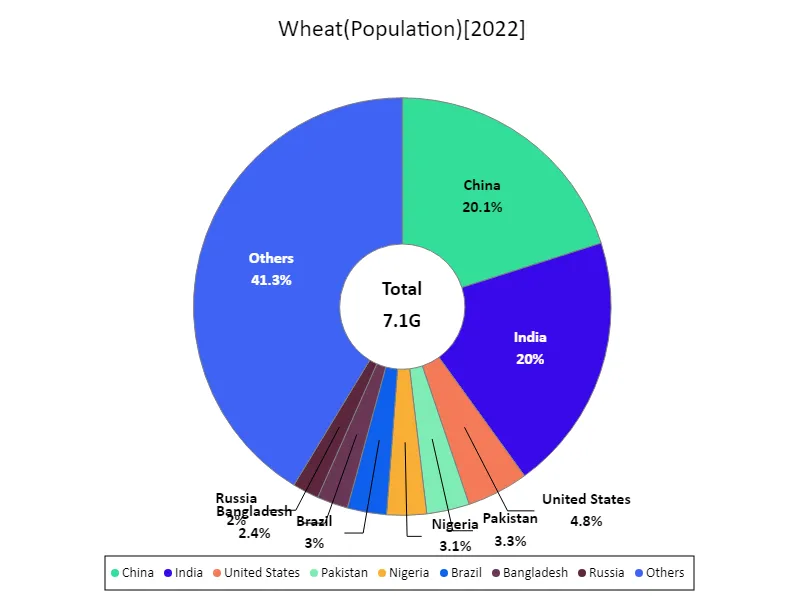
The maximum is 1.43G of China, the average is 56.8M, and the total is 7.1G
Wheat land use (continental)
Considering the 1961 data on wheat land use, Asia has the largest wheat cultivation area at 103 Mha. The value at this time is the current maximum, suggesting that the Asian region is the main wheat producing region. The reason why Asia has the largest wheat cultivation area is related to high population density and diverse climatic conditions. Furthermore, wheat is the main food crop in some Asian countries and plays an important role in the food security of the region. Considering the characteristics and trends so far, wheat land use has changed over time. In particular, technological innovations and changes in agricultural policies have had an impact, causing fluctuations in wheat production and cultivated area. For example, agricultural mechanization, use of fertilizers, and introduction of new varieties have improved wheat productivity and led to changes in cultivated area. Climate change and environmental issues also affect wheat cultivation. Changes in climatic conditions can affect wheat growth, and water resource constraints can affect the cultivated area of wheat. Considering these factors, it can be seen that wheat land use has different characteristics in each region and there are various challenges to building a sustainable agricultural system and ensuring food security.
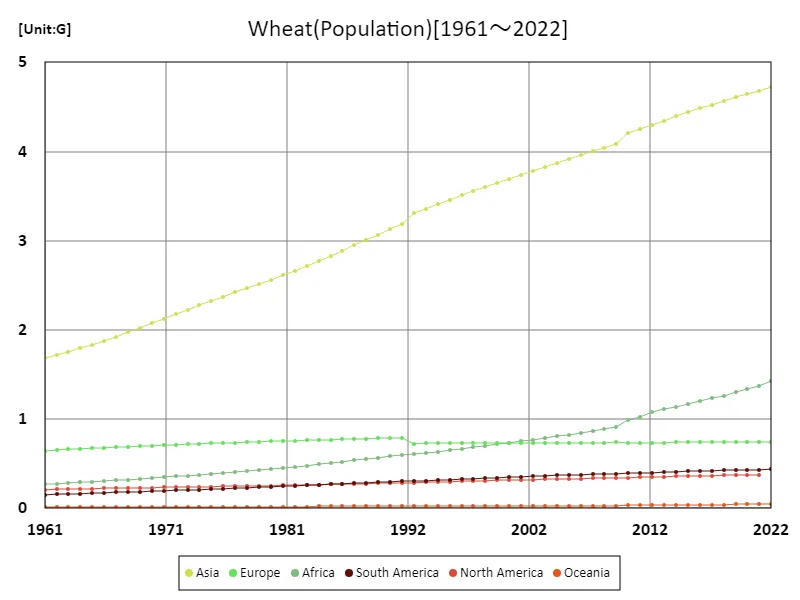
The maximum is the latest one, 4.72G of Asia
Land use for wheat (latest year, continental)
Looking at the land use data for wheat in 2022, Asia has the largest wheat cultivation area of 97.6 Mha. This is about 44.6% of the total wheat cultivation area in the world. The average wheat cultivation area is 36.4 Mha, indicating that wheat is cultivated over a wide area around the world. In total, 219 Mha is used for wheat cultivation worldwide. Considering the characteristics and trends so far, there are significant regional differences in land use for wheat. While Asia is the largest wheat-growing region, wheat is also cultivated over a wide area in other regions. This is influenced by regional climatic conditions, agricultural history, food culture, etc. In addition, the cultivated area and production volume of wheat have changed over time. Advances in agricultural technology, changes in agricultural policies, and climate change have influenced wheat production and cultivation area fluctuations. In particular, there is a demand for increased wheat production to meet the growing population and increasing food demand. Overall, land use for wheat plays an important role in global agriculture, with different characteristics and trends in different regions. In order to build sustainable agricultural systems and ensure food security, there is a need to increase wheat cultivation area and production.
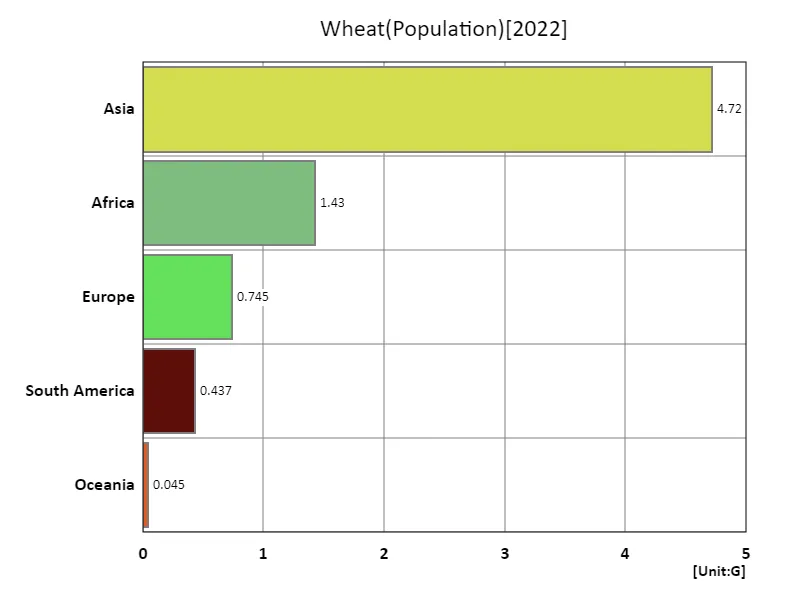
The maximum is 4.72G of Asia, the average is 1.47G, and the total is 7.37G
Main data
| Others(Wheat, Population) [G] | ||||||||||
|---|---|---|---|---|---|---|---|---|---|---|
| World | Asia | Lower-middle-income countries | Upper-middle-income countries | Africa | China | India | High-income countries | Europe | Low-income countries | |
| 2022 | 7.98 | 4.72 | 3.45 | 2.56 | 1.43 | 1.43 | 1.42 | 1.22 | 0.74 | 0.72 |
| 2021 | 7.91 | 4.68 | 3.41 | 2.55 | 1.37 | 1.46 | 1.41 | 1.22 | 0.74 | 0.7 |
| 2020 | 7.84 | 4.65 | 3.37 | 2.54 | 1.34 | 1.46 | 1.4 | 1.22 | 0.74 | 0.68 |
| 2019 | 7.76 | 4.61 | 3.33 | 2.53 | 1.3 | 1.45 | 1.38 | 1.21 | 0.74 | 0.66 |
| 2018 | 7.68 | 4.57 | 3.28 | 2.52 | 1.26 | 1.45 | 1.37 | 1.21 | 0.74 | 0.64 |
| 2017 | 7.6 | 4.53 | 3.24 | 2.5 | 1.23 | 1.44 | 1.35 | 1.2 | 0.74 | 0.63 |
| 2016 | 7.51 | 4.48 | 3.19 | 2.48 | 1.2 | 1.43 | 1.34 | 1.2 | 0.74 | 0.61 |
| 2015 | 7.43 | 4.44 | 3.14 | 2.46 | 1.17 | 1.43 | 1.32 | 1.19 | 0.74 | 0.59 |
| 2014 | 7.34 | 4.39 | 3.1 | 2.44 | 1.14 | 1.42 | 1.31 | 1.18 | 0.74 | 0.58 |
| 2013 | 7.25 | 4.35 | 3.05 | 2.42 | 1.11 | 1.41 | 1.29 | 1.18 | 0.74 | 0.56 |
| 2012 | 7.16 | 4.3 | 3.01 | 2.4 | 1.08 | 1.4 | 1.27 | 1.17 | 0.74 | 0.55 |
| 2011 | 7.07 | 4.25 | 2.96 | 2.38 | 1.02 | 1.39 | 1.26 | 1.16 | 0.73 | 0.54 |
| 2010 | 6.99 | 4.2 | 2.91 | 2.36 | 0.99 | 1.38 | 1.24 | 1.15 | 0.73 | 0.52 |
| 2009 | 6.9 | 4.09 | 2.87 | 2.35 | 0.91 | 1.38 | 1.22 | 1.15 | 0.74 | 0.51 |
| 2008 | 6.81 | 4.04 | 2.82 | 2.33 | 0.89 | 1.37 | 1.21 | 1.14 | 0.74 | 0.49 |
| 2007 | 6.73 | 4 | 2.78 | 2.31 | 0.87 | 1.36 | 1.19 | 1.13 | 0.74 | 0.48 |
| 2006 | 6.64 | 3.96 | 2.74 | 2.29 | 0.85 | 1.36 | 1.17 | 1.12 | 0.73 | 0.46 |
| 2005 | 6.56 | 3.91 | 2.69 | 2.28 | 0.83 | 1.35 | 1.15 | 1.11 | 0.73 | 0.45 |
| 2004 | 6.48 | 3.87 | 2.65 | 2.26 | 0.81 | 1.34 | 1.14 | 1.1 | 0.73 | 0.44 |
| 2003 | 6.39 | 3.83 | 2.6 | 2.24 | 0.79 | 1.33 | 1.12 | 1.09 | 0.73 | 0.43 |
| 2002 | 6.31 | 3.78 | 2.56 | 2.23 | 0.77 | 1.32 | 1.1 | 1.09 | 0.73 | 0.41 |
| 2001 | 6.23 | 3.74 | 2.51 | 2.21 | 0.75 | 1.32 | 1.08 | 1.08 | 0.73 | 0.4 |
| 2000 | 6.15 | 3.69 | 2.47 | 2.19 | 0.74 | 1.31 | 1.06 | 1.07 | 0.73 | 0.39 |
| 1999 | 6.07 | 3.65 | 2.42 | 2.17 | 0.72 | 1.3 | 1.04 | 1.07 | 0.73 | 0.38 |
| 1998 | 5.99 | 3.6 | 2.38 | 2.16 | 0.7 | 1.29 | 1.02 | 1.06 | 0.73 | 0.37 |
| 1997 | 5.91 | 3.56 | 2.33 | 2.14 | 0.68 | 1.29 | 1 | 1.05 | 0.73 | 0.36 |
| 1996 | 5.83 | 3.51 | 2.29 | 2.12 | 0.67 | 1.28 | 0.98 | 1.05 | 0.73 | 0.35 |
| 1995 | 5.74 | 3.46 | 2.24 | 2.1 | 0.65 | 1.27 | 0.96 | 1.04 | 0.73 | 0.34 |
| 1994 | 5.66 | 3.41 | 2.2 | 2.08 | 0.64 | 1.25 | 0.95 | 1.03 | 0.73 | 0.33 |
| 1993 | 5.58 | 3.36 | 2.15 | 2.05 | 0.62 | 1.24 | 0.93 | 1.02 | 0.73 | 0.32 |
| 1992 | 5.49 | 3.31 | 2.11 | 2.03 | 0.61 | 1.23 | 0.91 | 1.02 | 0.73 | 0.31 |
| 1991 | 5.41 | 3.18 | 2.07 | 2.01 | 0.6 | 1.21 | 0.89 | 1.01 | 0.79 | 0.3 |
| 1990 | 5.32 | 3.13 | 2.02 | 1.98 | 0.58 | 1.19 | 0.87 | 1 | 0.79 | 0.3 |
| 1989 | 5.22 | 3.07 | 1.98 | 1.95 | 0.57 | 1.17 | 0.85 | 0.99 | 0.79 | 0.29 |
| 1988 | 5.13 | 3.01 | 1.93 | 1.92 | 0.55 | 1.15 | 0.83 | 0.99 | 0.78 | 0.28 |
| 1987 | 5.04 | 2.95 | 1.89 | 1.88 | 0.54 | 1.13 | 0.82 | 0.98 | 0.78 | 0.27 |
| 1986 | 4.95 | 2.89 | 1.84 | 1.85 | 0.52 | 1.11 | 0.8 | 0.97 | 0.77 | 0.27 |
| 1985 | 4.86 | 2.83 | 1.8 | 1.82 | 0.51 | 1.09 | 0.78 | 0.96 | 0.77 | 0.26 |
| 1984 | 4.78 | 2.77 | 1.76 | 1.79 | 0.49 | 1.07 | 0.76 | 0.96 | 0.77 | 0.25 |
| 1983 | 4.69 | 2.72 | 1.72 | 1.76 | 0.48 | 1.05 | 0.75 | 0.95 | 0.76 | 0.25 |
| 1982 | 4.61 | 2.67 | 1.67 | 1.73 | 0.47 | 1.04 | 0.73 | 0.94 | 0.76 | 0.24 |
| 1981 | 4.52 | 2.61 | 1.63 | 1.71 | 0.45 | 1.02 | 0.71 | 0.94 | 0.75 | 0.23 |
| 1980 | 4.44 | 2.56 | 1.59 | 1.68 | 0.44 | 1.01 | 0.7 | 0.93 | 0.75 | 0.23 |
| 1979 | 4.37 | 2.51 | 1.55 | 1.65 | 0.43 | 0.99 | 0.68 | 0.92 | 0.75 | 0.23 |
| 1978 | 4.29 | 2.47 | 1.51 | 1.63 | 0.42 | 0.98 | 0.67 | 0.91 | 0.74 | 0.22 |
| 1977 | 4.22 | 2.42 | 1.48 | 1.6 | 0.41 | 0.97 | 0.65 | 0.9 | 0.74 | 0.21 |
| 1976 | 4.14 | 2.37 | 1.44 | 1.58 | 0.4 | 0.95 | 0.64 | 0.9 | 0.73 | 0.21 |
| 1975 | 4.07 | 2.32 | 1.41 | 1.55 | 0.39 | 0.93 | 0.62 | 0.89 | 0.73 | 0.2 |
| 1974 | 4 | 2.27 | 1.38 | 1.52 | 0.38 | 0.92 | 0.61 | 0.88 | 0.72 | 0.2 |
| 1973 | 3.92 | 2.22 | 1.35 | 1.49 | 0.37 | 0.9 | 0.6 | 0.87 | 0.72 | 0.19 |
| 1972 | 3.84 | 2.17 | 1.32 | 1.46 | 0.36 | 0.88 | 0.58 | 0.87 | 0.71 | 0.19 |
| 1971 | 3.77 | 2.12 | 1.29 | 1.43 | 0.35 | 0.85 | 0.57 | 0.86 | 0.71 | 0.18 |
| 1970 | 3.7 | 2.07 | 1.26 | 1.4 | 0.34 | 0.83 | 0.56 | 0.85 | 0.7 | 0.18 |
| 1969 | 3.62 | 2.02 | 1.23 | 1.37 | 0.33 | 0.81 | 0.55 | 0.84 | 0.7 | 0.17 |
| 1968 | 3.55 | 1.97 | 1.2 | 1.34 | 0.32 | 0.79 | 0.53 | 0.83 | 0.69 | 0.17 |
| 1967 | 3.48 | 1.92 | 1.17 | 1.31 | 0.31 | 0.77 | 0.52 | 0.82 | 0.69 | 0.16 |
| 1966 | 3.41 | 1.88 | 1.14 | 1.28 | 0.31 | 0.75 | 0.51 | 0.81 | 0.68 | 0.16 |
| 1965 | 3.34 | 1.83 | 1.12 | 1.25 | 0.3 | 0.73 | 0.5 | 0.8 | 0.68 | 0.16 |
| 1964 | 3.27 | 1.79 | 1.09 | 1.22 | 0.29 | 0.71 | 0.49 | 0.79 | 0.67 | 0.15 |
| 1963 | 3.2 | 1.75 | 1.07 | 1.18 | 0.28 | 0.7 | 0.48 | 0.78 | 0.66 | 0.15 |
| 1962 | 3.13 | 1.72 | 1.04 | 1.15 | 0.28 | 0.69 | 0.47 | 0.78 | 0.65 | 0.15 |
| 1961 | 3.07 | 1.69 | 1.02 | 1.13 | 0.27 | 0.68 | 0.46 | 0.77 | 0.65 | 0.14 |

Comments