Abstract
The latest data for Poland in coarse cereal production is 1.17 Mt in 2022, placing it at the top of the world’s coarse cereal production. Poland’s position has been established by sustained growth over the past few years. Poland’s coarse cereal production is characterized mainly by its cereal diversity, with wheat, barley and rye being the main crops. Polish agriculture is also focusing on technological innovation and sustainability, which is one of the factors behind the increase in production. In addition, increasing demand both at home and abroad is also boosting Poland’s coarse cereal production. The previous trends in Poland’s coarse cereal production show stable growth and improved competitiveness on the international market, and a sustained expansion is expected in the future.
Production of miscellaneous grains (Worldwide)
Looking at the data on millet production from 1961 to 2022, Poland’s production has been on a downward trend since peaking at 4.32 Mt in 2004. The production volume from the peak to the present has decreased by 27%. This trend is likely due to changes in agricultural policies and fluctuations in domestic and international market demand. Meanwhile, production in other countries is on the rise. This is due to advances in agricultural technology and the promotion of sustainable agriculture. Climate change and weather instability may also be affecting production. It is necessary to understand the trends in millet production, build sustainable production systems, and appropriately adjust agricultural policies.
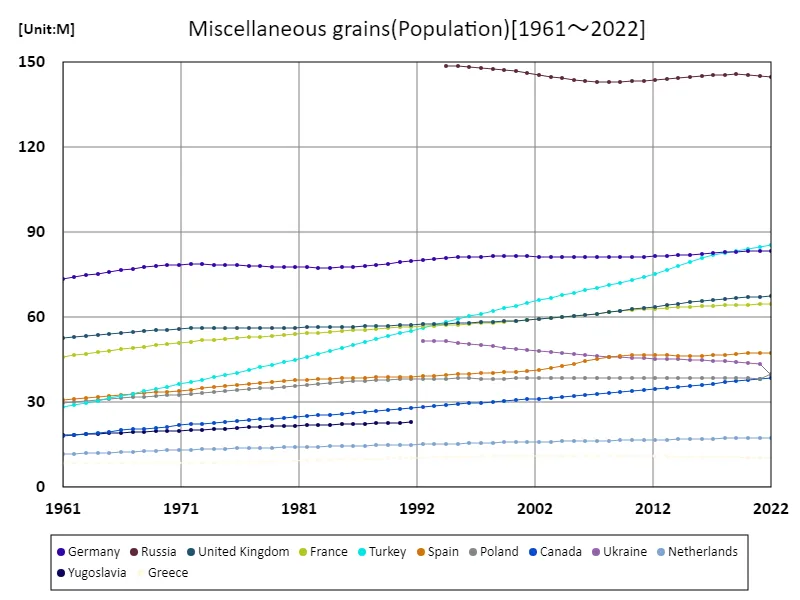
The maximum is 149M[1994] of Russia, and the current value is about 97.2%
Production volume of minor grains (latest year, countries around the world)
Based on data for 2022, the production of millet in world agriculture was recorded by Poland with the highest production of 1.17 Mt, with the overall total reaching 2.22 Mt. The average for this total is 63.5 kt. Considering the characteristics and trends so far, millet production varies by region, but suggests that there is a sustained demand for millet in the world as a whole. Furthermore, the relatively low median production suggests that some countries produce on a large scale, while many others produce on a small scale. This situation suggests that the demand for millet varies by region and culture, leading to specialization and diversification of production in each region. In the future, millet production patterns may change due to changes in demand and the influence of climatic conditions, so improvements in agricultural policies and technologies will be important.
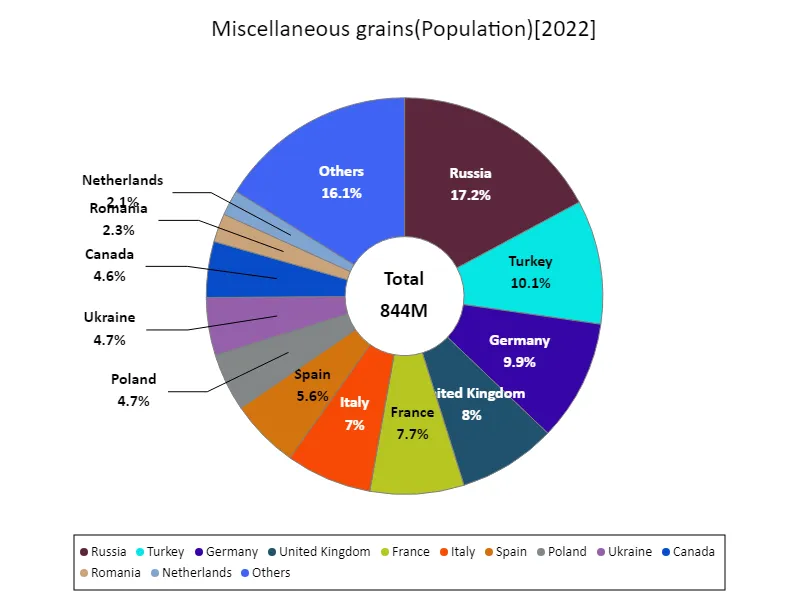
The maximum is 145M of Russia, the average is 24.1M, and the total is 844M
Production of minor grains (continent)
Looking at the data on coarse cereal production over the past decades, Europe has been on a declining trend since peaking at 5.13 Mt in 2004. Since the peak, production has decreased by 39.4%. Factors behind this trend include changes in agricultural policies, fluctuations in market demand, and climate change. Meanwhile, other parts of the world have been showing an increasing trend in coarse cereal production. This can be attributed to technological innovations and the adoption of sustainable agricultural practices. The decline in coarse cereal production in Europe indicates the need to address changes in the region’s agricultural structure and markets, which calls for the promotion of sustainable agriculture and market diversification.
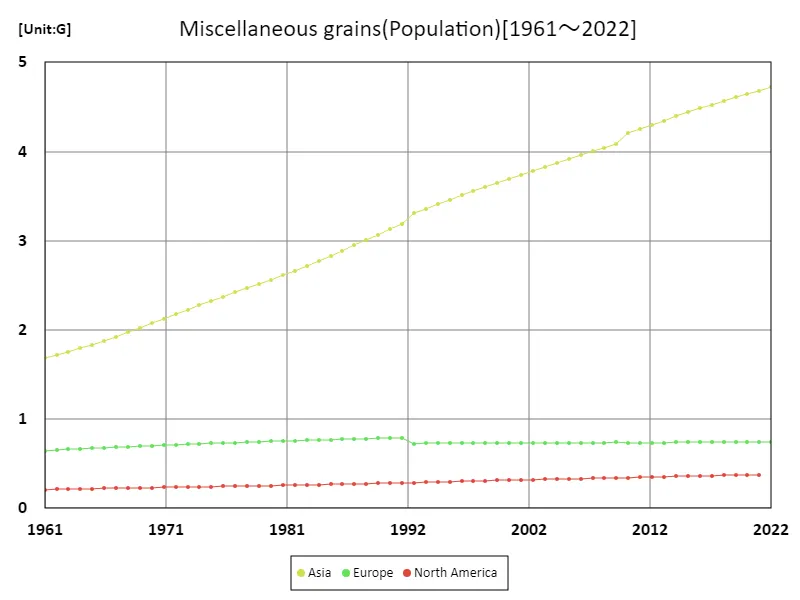
The maximum is the latest one, 4.72G of Asia
Miscellaneous grain production (latest year, continent)
According to the 2022 coarse grain production data, Europe recorded the highest overall production of 2.02 Mt, with an average of 741 kt, for a total of 2.22 Mt. This data makes it clear that Europe accounts for the majority of the world’s coarse grain production. Coarse grain production in Europe has consistently maintained a high level, which is likely due to the region’s abundant agricultural resources and the adoption of advanced agricultural techniques. Another factor is that the climatic conditions in Europe are also suitable for coarse grain production. On the other hand, it has been shown that coarse grain production in other regions remains at a relatively low level. This may be due to differences in agricultural structure and climatic conditions in each region, as well as the influence of agricultural policies. Going forward, it will be important to promote sustainable agricultural production in each region, including Europe, and further technological innovation and policy improvements will be required.
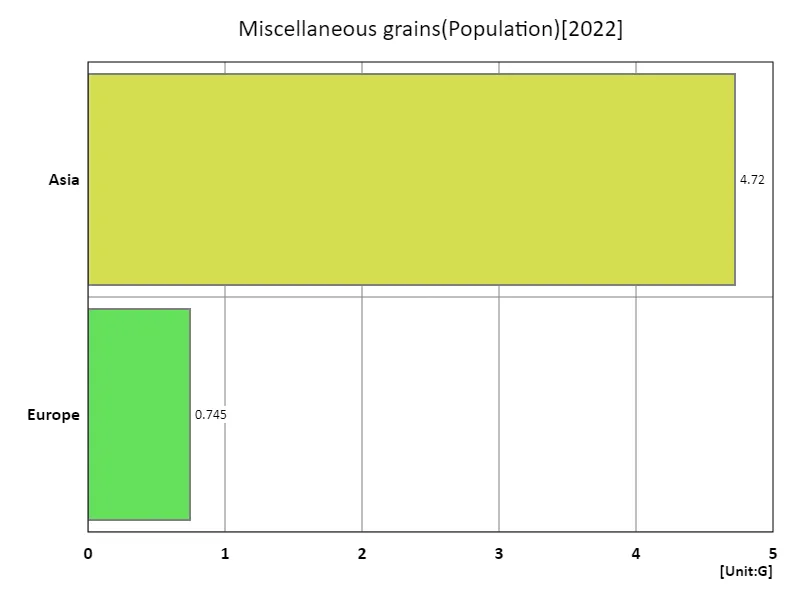
The maximum is 4.72G of Asia, the average is 2.73G, and the total is 5.47G
Main data
| Others(Miscellaneous grains, Population) [G] | ||||||||||
|---|---|---|---|---|---|---|---|---|---|---|
| World | Asia | Lower-middle-income countries | Upper-middle-income countries | High-income countries | Europe | North America | European Union | Russia | Turkey | |
| 2022 | 7.98 | 4.72 | 3.45 | 2.56 | 1.22 | 0.74 | 0.6 | 0.45 | 0.14 | 0.09 |
| 2021 | 7.91 | 4.68 | 3.41 | 2.55 | 1.22 | 0.74 | 0.6 | 0.45 | 0.15 | 0.08 |
| 2020 | 7.84 | 4.65 | 3.37 | 2.54 | 1.22 | 0.74 | 0.59 | 0.45 | 0.15 | 0.08 |
| 2019 | 7.76 | 4.61 | 3.33 | 2.53 | 1.21 | 0.74 | 0.59 | 0.45 | 0.15 | 0.08 |
| 2018 | 7.68 | 4.57 | 3.28 | 2.52 | 1.21 | 0.74 | 0.59 | 0.44 | 0.15 | 0.08 |
| 2017 | 7.6 | 4.53 | 3.24 | 2.5 | 1.2 | 0.74 | 0.58 | 0.44 | 0.15 | 0.08 |
| 2016 | 7.51 | 4.48 | 3.19 | 2.48 | 1.2 | 0.74 | 0.58 | 0.44 | 0.15 | 0.08 |
| 2015 | 7.43 | 4.44 | 3.14 | 2.46 | 1.19 | 0.74 | 0.57 | 0.44 | 0.14 | 0.08 |
| 2014 | 7.34 | 4.39 | 3.1 | 2.44 | 1.18 | 0.74 | 0.57 | 0.44 | 0.14 | 0.08 |
| 2013 | 7.25 | 4.35 | 3.05 | 2.42 | 1.18 | 0.74 | 0.56 | 0.44 | 0.14 | 0.08 |
| 2012 | 7.16 | 4.3 | 3.01 | 2.4 | 1.17 | 0.74 | 0.55 | 0.44 | 0.14 | 0.08 |
| 2011 | 7.07 | 4.25 | 2.96 | 2.38 | 1.16 | 0.73 | 0.55 | 0.44 | 0.14 | 0.07 |
| 2010 | 6.99 | 4.2 | 2.91 | 2.36 | 1.15 | 0.73 | 0.54 | 0.44 | 0.14 | 0.07 |
| 2009 | 6.9 | 4.09 | 2.87 | 2.35 | 1.15 | 0.74 | 0.54 | 0.44 | 0.14 | 0.07 |
| 2008 | 6.81 | 4.04 | 2.82 | 2.33 | 1.14 | 0.74 | 0.53 | 0.44 | 0.14 | 0.07 |
| 2007 | 6.73 | 4 | 2.78 | 2.31 | 1.13 | 0.74 | 0.53 | 0.44 | 0.14 | 0.07 |
| 2006 | 6.64 | 3.96 | 2.74 | 2.29 | 1.12 | 0.73 | 0.52 | 0.44 | 0.14 | 0.07 |
| 2005 | 6.56 | 3.91 | 2.69 | 2.28 | 1.11 | 0.73 | 0.51 | 0.44 | 0.14 | 0.07 |
| 2004 | 6.48 | 3.87 | 2.65 | 2.26 | 1.1 | 0.73 | 0.51 | 0.43 | 0.14 | 0.07 |
| 2003 | 6.39 | 3.83 | 2.6 | 2.24 | 1.09 | 0.73 | 0.5 | 0.43 | 0.14 | 0.07 |
| 2002 | 6.31 | 3.78 | 2.56 | 2.23 | 1.09 | 0.73 | 0.5 | 0.43 | 0.15 | 0.07 |
| 2001 | 6.23 | 3.74 | 2.51 | 2.21 | 1.08 | 0.73 | 0.49 | 0.43 | 0.15 | 0.07 |
| 2000 | 6.15 | 3.69 | 2.47 | 2.19 | 1.07 | 0.73 | 0.49 | 0.43 | 0.15 | 0.06 |
| 1999 | 6.07 | 3.65 | 2.42 | 2.17 | 1.07 | 0.73 | 0.48 | 0.43 | 0.15 | 0.06 |
| 1998 | 5.99 | 3.6 | 2.38 | 2.16 | 1.06 | 0.73 | 0.47 | 0.43 | 0.15 | 0.06 |
| 1997 | 5.91 | 3.56 | 2.33 | 2.14 | 1.05 | 0.73 | 0.47 | 0.43 | 0.15 | 0.06 |
| 1996 | 5.83 | 3.51 | 2.29 | 2.12 | 1.05 | 0.73 | 0.46 | 0.43 | 0.15 | 0.06 |
| 1995 | 5.74 | 3.46 | 2.24 | 2.1 | 1.04 | 0.73 | 0.45 | 0.43 | 0.15 | 0.06 |
| 1994 | 5.66 | 3.41 | 2.2 | 2.08 | 1.03 | 0.73 | 0.45 | 0.43 | 0.15 | 0.06 |
| 1993 | 5.58 | 3.36 | 2.15 | 2.05 | 1.02 | 0.73 | 0.44 | 0.42 | 0.06 | |
| 1992 | 5.49 | 3.31 | 2.11 | 2.03 | 1.02 | 0.73 | 0.43 | 0.41 | 0.06 | |
| 1991 | 5.41 | 3.18 | 2.01 | 1.01 | 0.79 | 0.43 | 0.39 | 0.06 | ||
| 1990 | 5.32 | 3.13 | 1.98 | 1 | 0.79 | 0.42 | 0.39 | 0.05 | ||
| 1989 | 5.22 | 3.07 | 1.95 | 0.99 | 0.79 | 0.42 | 0.39 | 0.05 | ||
| 1988 | 5.13 | 3.01 | 1.92 | 0.99 | 0.78 | 0.41 | 0.39 | 0.05 | ||
| 1987 | 5.04 | 2.95 | 1.88 | 0.98 | 0.78 | 0.4 | 0.39 | 0.05 | ||
| 1986 | 4.95 | 2.89 | 1.85 | 0.97 | 0.77 | 0.4 | 0.39 | 0.05 | ||
| 1985 | 4.86 | 2.83 | 1.82 | 0.96 | 0.77 | 0.39 | 0.38 | 0.05 | ||
| 1984 | 4.78 | 2.77 | 1.79 | 0.96 | 0.77 | 0.39 | 0.38 | 0.05 | ||
| 1983 | 4.69 | 2.72 | 1.76 | 0.95 | 0.76 | 0.38 | 0.38 | 0.05 | ||
| 1982 | 4.61 | 2.67 | 1.73 | 0.94 | 0.76 | 0.38 | 0.38 | 0.05 | ||
| 1981 | 4.52 | 2.61 | 1.71 | 0.94 | 0.75 | 0.37 | 0.38 | 0.04 | ||
| 1980 | 4.44 | 2.56 | 1.68 | 0.93 | 0.75 | 0.37 | 0.38 | 0.04 | ||
| 1979 | 4.37 | 2.51 | 1.65 | 0.92 | 0.75 | 0.36 | 0.38 | 0.04 | ||
| 1978 | 4.29 | 2.47 | 1.63 | 0.91 | 0.74 | 0.36 | 0.38 | 0.04 | ||
| 1977 | 4.22 | 2.42 | 1.6 | 0.9 | 0.74 | 0.35 | 0.37 | 0.04 | ||
| 1976 | 4.14 | 2.37 | 1.58 | 0.9 | 0.73 | 0.35 | 0.37 | 0.04 | ||
| 1975 | 4.07 | 2.32 | 1.55 | 0.89 | 0.73 | 0.34 | 0.37 | 0.04 | ||
| 1974 | 4 | 2.27 | 1.52 | 0.88 | 0.72 | 0.34 | 0.37 | 0.04 | ||
| 1973 | 3.92 | 2.22 | 1.49 | 0.87 | 0.72 | 0.33 | 0.37 | 0.04 | ||
| 1972 | 3.84 | 2.17 | 1.46 | 0.87 | 0.71 | 0.33 | 0.36 | 0.04 | ||
| 1971 | 3.77 | 2.12 | 1.43 | 0.86 | 0.71 | 0.32 | 0.36 | 0.04 | ||
| 1970 | 3.7 | 2.07 | 1.4 | 0.85 | 0.7 | 0.32 | 0.36 | 0.04 | ||
| 1969 | 3.62 | 2.02 | 1.37 | 0.84 | 0.7 | 0.31 | 0.36 | 0.03 | ||
| 1968 | 3.55 | 1.97 | 1.34 | 0.83 | 0.69 | 0.31 | 0.35 | 0.03 | ||
| 1967 | 3.48 | 1.92 | 1.31 | 0.82 | 0.69 | 0.3 | 0.35 | 0.03 | ||
| 1966 | 3.41 | 1.88 | 1.28 | 0.81 | 0.68 | 0.3 | 0.35 | 0.03 | ||
| 1965 | 3.34 | 1.83 | 1.25 | 0.8 | 0.68 | 0.29 | 0.35 | 0.03 | ||
| 1964 | 3.27 | 1.79 | 1.22 | 0.79 | 0.67 | 0.29 | 0.34 | 0.03 | ||
| 1963 | 3.2 | 1.75 | 1.18 | 0.78 | 0.66 | 0.28 | 0.34 | 0.03 | ||
| 1962 | 3.13 | 1.72 | 1.15 | 0.78 | 0.65 | 0.28 | 0.34 | 0.03 | ||
| 1961 | 3.07 | 1.69 | 1.13 | 0.77 | 0.65 | 0.27 | 0.33 | 0.03 | ||

Comments