Abstract
Rice occupies an important position in global agricultural exports and imports. According to 2021 data, India was the largest exporter of rice at 31.6 megatons. This shows India’s strong presence in rice exports and imports. The trend so far has been that the demand and supply of rice has been stable globally, and production has expanded in line with increasing demand. One of the main characteristics is that rice is consumed as a staple food around the world, so demand is stable and export volume has increased steadily accordingly. In addition, quality and price are important factors in rice exports and imports, and it is a highly competitive market. In addition, factors such as climate change and changes in agricultural policies can affect exports and imports. Overall, rice exports and imports play an important part in global agriculture, and it is expected that demand stability and competitiveness will remain in the future.
Rice export volume (worldwide)
Considering data from 1961 to 2021, rice exports and imports show several characteristics and trends. First, India’s exports reached a record high of 31.6 megatons, 100% of its peak. This indicates that India is playing an increasingly important role in global agriculture. It is also clear that global demand for rice is stable, and production may be increasing in response to increased demand. On the other hand, rice exports and imports are highly competitive among many countries, with competition on quality and price being fierce. In addition, factors such as climate change and changes in agricultural policies may affect exports and imports. Overall, global rice exports and imports are growing amid stable demand and increasing competition, and are expected to continue to play an important role in the future.
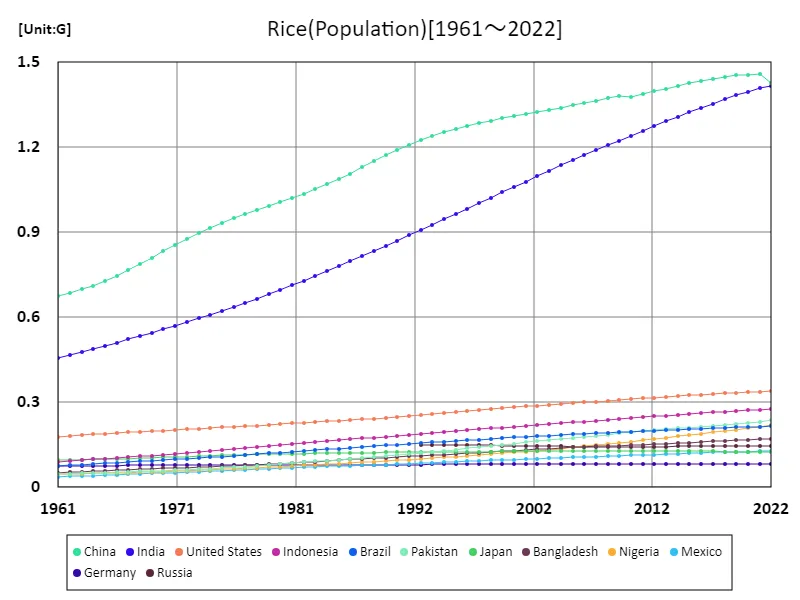

The maximum is 1.46G[2021] of China, and the current value is about 97.8%
Rice export volume (latest year, countries around the world)
Looking at the data on rice exports and imports in global agriculture in 2021, several characteristics and trends emerge. First, the overall export and import volume was a massive 76.6 megatons, indicating rice’s important position in the global food market. Of particular note, India recorded an astounding export volume of 31.6 megatons, playing a leading role in the global rice market. This indicates that India is increasingly emerging as a rice producer. On the other hand, the average export and import volume of 501 kilotons indicates that global rice trade is conducted on a diverse scale. This means that not only large rice producing countries but also small producing countries are participating in exports and imports. This diversity is important in ensuring global food security. In addition, various factors such as climatic conditions, agricultural policies, and changes in international supply and demand affect the increase and decrease in export and import volumes and inter-regional trading patterns. These factors can have a significant impact on trends in the global rice market. Overall, the 2021 global rice export and import data shows important trends in the global food market, such as the rise of India and the diversity of trade. Understanding these trends is important for policymaking and decision-making by market participants to ensure global food security.
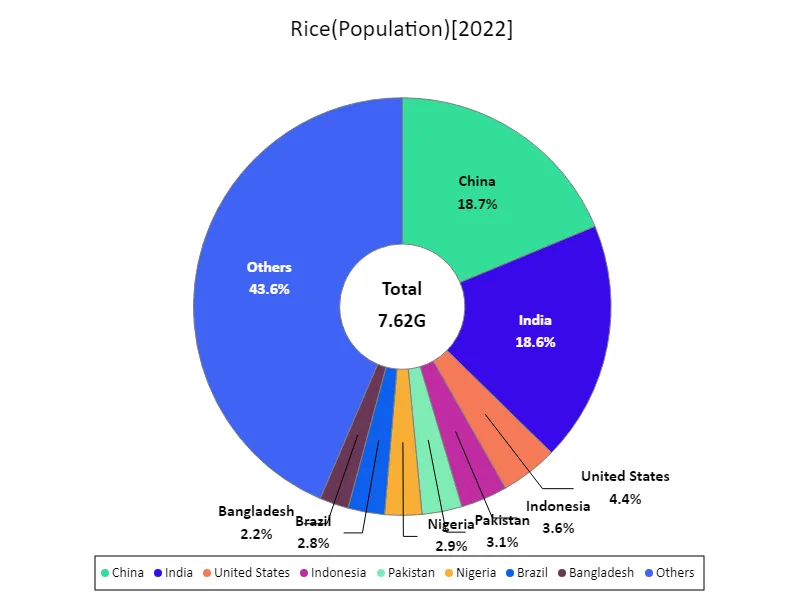

The maximum is 1.43G of China, the average is 54.8M, and the total is 7.62G
Rice export volume (continent)
When considering the data on rice exports and imports in world agriculture from 1961 to the present, several characteristics and trends emerge. First, it is notable that Asia is the largest exporter of rice overall. This suggests that Asia is the world’s major rice producer, with many countries engaged in rice production and export. Furthermore, since the latest data is the largest ever, the demand for rice in the world may be increasing. This is likely due to multiple factors, such as the increase in the world population and changes in eating habits due to economic growth. In addition, changes in trade patterns and supply and demand between regions affect the export and import of rice in the world. For example, some regions may be affected by climate change and natural disasters, which may lead to fluctuations in the volume of exports and imports. In addition, factors such as technological innovation and changes in agricultural policies also affect the export and import of rice in the world. For example, the introduction of new agricultural technologies may improve yields and increase exports. Overall, the export and import of rice in world agriculture is influenced by many factors, but since Asia is the largest exporter and the latest data is the largest ever, the demand for rice in the world is likely to be steadily increasing.
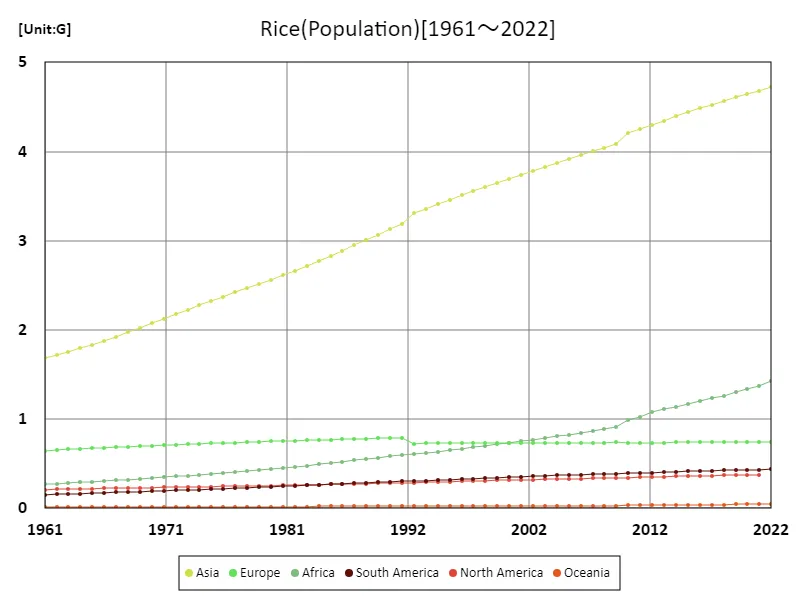

The maximum is the latest one, 4.72G of Asia
Rice export volume (latest year, continent)
When considering the 2021 data on rice exports and imports in world agriculture, several features become evident. First, it is notable that Asia is the largest exporter of rice overall. This suggests that Asia is the world’s major rice producer, with many countries engaged in rice production and export. On the other hand, the figure of 76.5 megatons of overall exports suggests that the demand for rice in the world is high. This is likely due to the increase in the world population and changes in eating habits due to economic growth. In response to the growing demand, countries appear to be actively participating in rice exports. In addition, the average export volume of 12.7 megatons shows that rice exports and imports are carried out on a variety of scales. This suggests that not only large rice producing countries but also small countries are contributing to exports. Such diversity is important in ensuring stability in the world food market. In addition, changes in regional trading patterns and supply and demand affect global rice exports and imports. Factors such as climatic conditions and natural disasters can cause fluctuations in harvest volumes in some regions. Political instability and changes in trade policies can also affect exports and imports. Overall, the 2021 world rice import and export data highlights important trends in the global food market, including Asia’s leading role, high global demand for rice, and trade at a more diverse scale.
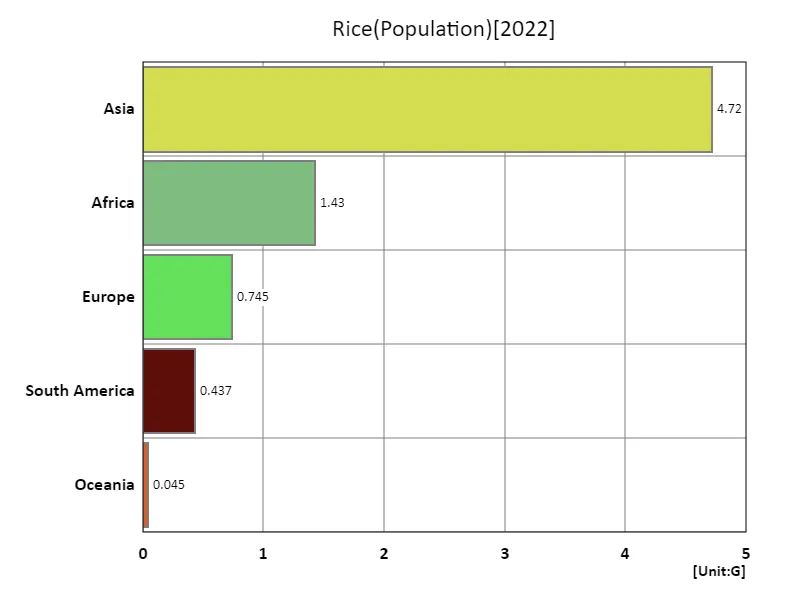

The maximum is 4.72G of Asia, the average is 1.47G, and the total is 7.37G
Main data
| Others(Rice, Population) [G] | ||||||||||
|---|---|---|---|---|---|---|---|---|---|---|
| World | Asia | Lower-middle-income countries | Upper-middle-income countries | Africa | China | India | High-income countries | Europe | Low-income countries | |
| 2022 | 7.98 | 4.72 | 3.45 | 2.56 | 1.43 | 1.43 | 1.42 | 1.22 | 0.74 | 0.72 |
| 2021 | 7.91 | 4.68 | 3.41 | 2.55 | 1.37 | 1.46 | 1.41 | 1.22 | 0.74 | 0.7 |
| 2020 | 7.84 | 4.65 | 3.37 | 2.54 | 1.34 | 1.46 | 1.4 | 1.22 | 0.74 | 0.68 |
| 2019 | 7.76 | 4.61 | 3.33 | 2.53 | 1.3 | 1.45 | 1.38 | 1.21 | 0.74 | 0.66 |
| 2018 | 7.68 | 4.57 | 3.28 | 2.52 | 1.26 | 1.45 | 1.37 | 1.21 | 0.74 | 0.64 |
| 2017 | 7.6 | 4.53 | 3.24 | 2.5 | 1.23 | 1.44 | 1.35 | 1.2 | 0.74 | 0.63 |
| 2016 | 7.51 | 4.48 | 3.19 | 2.48 | 1.2 | 1.43 | 1.34 | 1.2 | 0.74 | 0.61 |
| 2015 | 7.43 | 4.44 | 3.14 | 2.46 | 1.17 | 1.43 | 1.32 | 1.19 | 0.74 | 0.59 |
| 2014 | 7.34 | 4.39 | 3.1 | 2.44 | 1.14 | 1.42 | 1.31 | 1.18 | 0.74 | 0.58 |
| 2013 | 7.25 | 4.35 | 3.05 | 2.42 | 1.11 | 1.41 | 1.29 | 1.18 | 0.74 | 0.56 |
| 2012 | 7.16 | 4.3 | 3.01 | 2.4 | 1.08 | 1.4 | 1.27 | 1.17 | 0.74 | 0.55 |
| 2011 | 7.07 | 4.25 | 2.96 | 2.38 | 1.02 | 1.39 | 1.26 | 1.16 | 0.73 | 0.54 |
| 2010 | 6.99 | 4.2 | 2.91 | 2.36 | 0.99 | 1.38 | 1.24 | 1.15 | 0.73 | 0.52 |
| 2009 | 6.9 | 4.09 | 2.87 | 2.35 | 0.91 | 1.38 | 1.22 | 1.15 | 0.74 | 0.51 |
| 2008 | 6.81 | 4.04 | 2.82 | 2.33 | 0.89 | 1.37 | 1.21 | 1.14 | 0.74 | 0.49 |
| 2007 | 6.73 | 4 | 2.78 | 2.31 | 0.87 | 1.36 | 1.19 | 1.13 | 0.74 | 0.48 |
| 2006 | 6.64 | 3.96 | 2.74 | 2.29 | 0.85 | 1.36 | 1.17 | 1.12 | 0.73 | 0.46 |
| 2005 | 6.56 | 3.91 | 2.69 | 2.28 | 0.83 | 1.35 | 1.15 | 1.11 | 0.73 | 0.45 |
| 2004 | 6.48 | 3.87 | 2.65 | 2.26 | 0.81 | 1.34 | 1.14 | 1.1 | 0.73 | 0.44 |
| 2003 | 6.39 | 3.83 | 2.6 | 2.24 | 0.79 | 1.33 | 1.12 | 1.09 | 0.73 | 0.43 |
| 2002 | 6.31 | 3.78 | 2.56 | 2.23 | 0.77 | 1.32 | 1.1 | 1.09 | 0.73 | 0.41 |
| 2001 | 6.23 | 3.74 | 2.51 | 2.21 | 0.75 | 1.32 | 1.08 | 1.08 | 0.73 | 0.4 |
| 2000 | 6.15 | 3.69 | 2.47 | 2.19 | 0.74 | 1.31 | 1.06 | 1.07 | 0.73 | 0.39 |
| 1999 | 6.07 | 3.65 | 2.42 | 2.17 | 0.72 | 1.3 | 1.04 | 1.07 | 0.73 | 0.38 |
| 1998 | 5.99 | 3.6 | 2.38 | 2.16 | 0.7 | 1.29 | 1.02 | 1.06 | 0.73 | 0.37 |
| 1997 | 5.91 | 3.56 | 2.33 | 2.14 | 0.68 | 1.29 | 1 | 1.05 | 0.73 | 0.36 |
| 1996 | 5.83 | 3.51 | 2.29 | 2.12 | 0.67 | 1.28 | 0.98 | 1.05 | 0.73 | 0.35 |
| 1995 | 5.74 | 3.46 | 2.24 | 2.1 | 0.65 | 1.27 | 0.96 | 1.04 | 0.73 | 0.34 |
| 1994 | 5.66 | 3.41 | 2.2 | 2.08 | 0.64 | 1.25 | 0.95 | 1.03 | 0.73 | 0.33 |
| 1993 | 5.58 | 3.36 | 2.15 | 2.05 | 0.62 | 1.24 | 0.93 | 1.02 | 0.73 | 0.32 |
| 1992 | 5.49 | 3.31 | 2.11 | 2.03 | 0.61 | 1.23 | 0.91 | 1.02 | 0.73 | 0.31 |
| 1991 | 5.41 | 3.18 | 2.07 | 2.01 | 0.6 | 1.21 | 0.89 | 1.01 | 0.79 | 0.3 |
| 1990 | 5.32 | 3.13 | 2.02 | 1.98 | 0.58 | 1.19 | 0.87 | 1 | 0.79 | 0.3 |
| 1989 | 5.22 | 3.07 | 1.98 | 1.95 | 0.57 | 1.17 | 0.85 | 0.99 | 0.79 | 0.29 |
| 1988 | 5.13 | 3.01 | 1.93 | 1.92 | 0.55 | 1.15 | 0.83 | 0.99 | 0.78 | 0.28 |
| 1987 | 5.04 | 2.95 | 1.89 | 1.88 | 0.54 | 1.13 | 0.82 | 0.98 | 0.78 | 0.27 |
| 1986 | 4.95 | 2.89 | 1.84 | 1.85 | 0.52 | 1.11 | 0.8 | 0.97 | 0.77 | 0.27 |
| 1985 | 4.86 | 2.83 | 1.8 | 1.82 | 0.51 | 1.09 | 0.78 | 0.96 | 0.77 | 0.26 |
| 1984 | 4.78 | 2.77 | 1.76 | 1.79 | 0.49 | 1.07 | 0.76 | 0.96 | 0.77 | 0.25 |
| 1983 | 4.69 | 2.72 | 1.72 | 1.76 | 0.48 | 1.05 | 0.75 | 0.95 | 0.76 | 0.25 |
| 1982 | 4.61 | 2.67 | 1.67 | 1.73 | 0.47 | 1.04 | 0.73 | 0.94 | 0.76 | 0.24 |
| 1981 | 4.52 | 2.61 | 1.63 | 1.71 | 0.45 | 1.02 | 0.71 | 0.94 | 0.75 | 0.23 |
| 1980 | 4.44 | 2.56 | 1.59 | 1.68 | 0.44 | 1.01 | 0.7 | 0.93 | 0.75 | 0.23 |
| 1979 | 4.37 | 2.51 | 1.55 | 1.65 | 0.43 | 0.99 | 0.68 | 0.92 | 0.75 | 0.23 |
| 1978 | 4.29 | 2.47 | 1.51 | 1.63 | 0.42 | 0.98 | 0.67 | 0.91 | 0.74 | 0.22 |
| 1977 | 4.22 | 2.42 | 1.48 | 1.6 | 0.41 | 0.97 | 0.65 | 0.9 | 0.74 | 0.21 |
| 1976 | 4.14 | 2.37 | 1.44 | 1.58 | 0.4 | 0.95 | 0.64 | 0.9 | 0.73 | 0.21 |
| 1975 | 4.07 | 2.32 | 1.41 | 1.55 | 0.39 | 0.93 | 0.62 | 0.89 | 0.73 | 0.2 |
| 1974 | 4 | 2.27 | 1.38 | 1.52 | 0.38 | 0.92 | 0.61 | 0.88 | 0.72 | 0.2 |
| 1973 | 3.92 | 2.22 | 1.35 | 1.49 | 0.37 | 0.9 | 0.6 | 0.87 | 0.72 | 0.19 |
| 1972 | 3.84 | 2.17 | 1.32 | 1.46 | 0.36 | 0.88 | 0.58 | 0.87 | 0.71 | 0.19 |
| 1971 | 3.77 | 2.12 | 1.29 | 1.43 | 0.35 | 0.85 | 0.57 | 0.86 | 0.71 | 0.18 |
| 1970 | 3.7 | 2.07 | 1.26 | 1.4 | 0.34 | 0.83 | 0.56 | 0.85 | 0.7 | 0.18 |
| 1969 | 3.62 | 2.02 | 1.23 | 1.37 | 0.33 | 0.81 | 0.55 | 0.84 | 0.7 | 0.17 |
| 1968 | 3.55 | 1.97 | 1.2 | 1.34 | 0.32 | 0.79 | 0.53 | 0.83 | 0.69 | 0.17 |
| 1967 | 3.48 | 1.92 | 1.17 | 1.31 | 0.31 | 0.77 | 0.52 | 0.82 | 0.69 | 0.16 |
| 1966 | 3.41 | 1.88 | 1.14 | 1.28 | 0.31 | 0.75 | 0.51 | 0.81 | 0.68 | 0.16 |
| 1965 | 3.34 | 1.83 | 1.12 | 1.25 | 0.3 | 0.73 | 0.5 | 0.8 | 0.68 | 0.16 |
| 1964 | 3.27 | 1.79 | 1.09 | 1.22 | 0.29 | 0.71 | 0.49 | 0.79 | 0.67 | 0.15 |
| 1963 | 3.2 | 1.75 | 1.07 | 1.18 | 0.28 | 0.7 | 0.48 | 0.78 | 0.66 | 0.15 |
| 1962 | 3.13 | 1.72 | 1.04 | 1.15 | 0.28 | 0.69 | 0.47 | 0.78 | 0.65 | 0.15 |
| 1961 | 3.07 | 1.69 | 1.02 | 1.13 | 0.27 | 0.68 | 0.46 | 0.77 | 0.65 | 0.14 |


Comments