Abstract
Land use for corn plays an important part in global agriculture. According to data from 2022, China has the largest area, reaching 43.1 Mha. This trend has continued in the past few years, showing that China is the world’s largest corn producer. Large-scale corn production in China’s land use plays an important role in meeting the demand for its economic growth and population growth. Meanwhile, other regions such as South America and the United States are known as large-scale corn producers. In these regions, high-yield corn is cultivated due to climatic conditions and advances in agricultural technology. The spread of genetic engineering technology also affects global corn production. Overall, land use for corn plays an important role in global agriculture and contributes to the economy and food security of each region.
Land use for corn (worldwide)
Between 1961 and 2022, land use for corn in global agriculture has undergone significant changes. Particularly noteworthy is China’s record of 45 Mha, which peaked in 2015. Since then, land use in China has declined to almost 95.8% of its peak. This trend is due to changes in China’s agricultural policies and diversification of land use due to economic development. Meanwhile, in other parts of the world, the area cultivated with corn has increased in South America and the United States. This is due to the suitability of climatic conditions and advances in technological innovation, especially the spread of genetic engineering technology, which supports large-scale production. In addition, changes in food demand and emphasis on sustainable agriculture are also affecting global agriculture. In general, the transition of land use for corn varies from region to region, but it can be seen that agricultural patterns are diversifying amid growing interest in sustainability and food security worldwide.
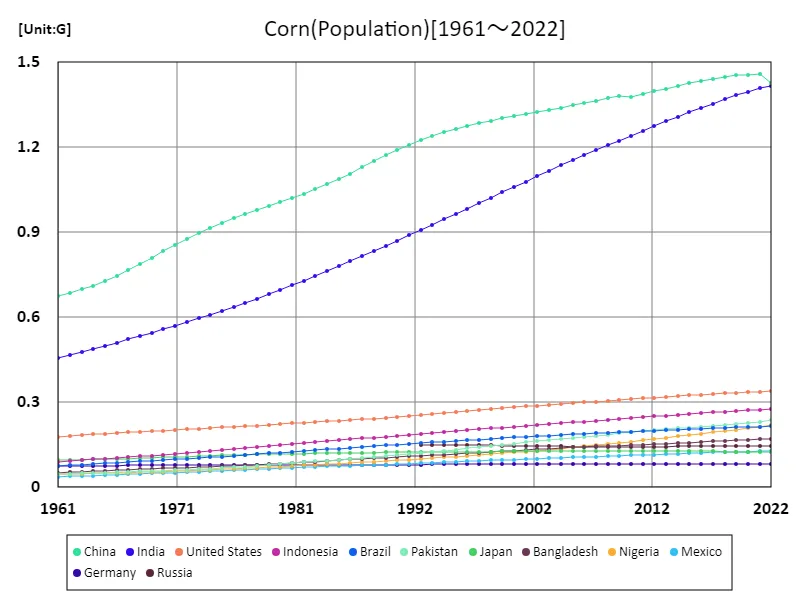
The maximum is 1.46G[2021] of China, and the current value is about 97.8%
Land use for corn (latest year, world)
As of 2022, China accounts for the largest area of land use for corn in global agriculture, reaching 43.1 Mha. The overall average area is 1.2 Mha, and the total area is 203 Mha. Considering the characteristics and trends so far, it can be seen that corn cultivation is widespread worldwide. While large-scale production is mainly carried out in China, it is also cultivated extensively in other regions. Countries such as South America and the United States are also listed as major corn producing regions. In these regions, high-yield corn is cultivated due to climatic conditions and advances in agricultural technology. In addition, the spread of genetically modified technology is affecting agricultural production as sustainability and food security in global agriculture become increasingly important. Overall, corn land use plays an important role in global agriculture and contributes to the economy and food supply of each region.
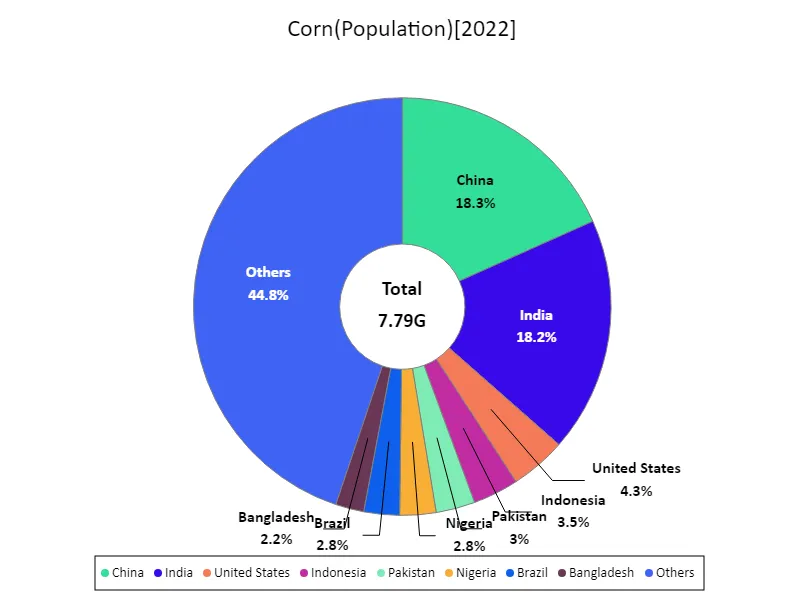
The maximum is 1.43G of China, the average is 46.4M, and the total is 7.79G
Corn land use (continental)
According to data from 1961, Asia had the largest land area for corn in world agriculture, reaching 68.5 Mha. This is the largest record at this time. This data shows the active agricultural activity in Asia at that time and the importance of corn. At that time, agriculture was the main economic activity in Asia and the center of food supply. Corn was widely cultivated as part of this and was used as food and livestock feed. The characteristics of this period include the expansion of agriculture in Asia and the increase in local food demand. As the population increased and urbanization progressed, more food was required, and the demand for corn also increased. In addition, improvements in agricultural technology and the development of irrigation systems may have been factors that increased the production of corn. Data from this period suggests that Asia was the main producer of corn in world agriculture. After that, the overall production volume of corn by region may have changed due to the development of agriculture in other regions and changes in demand.
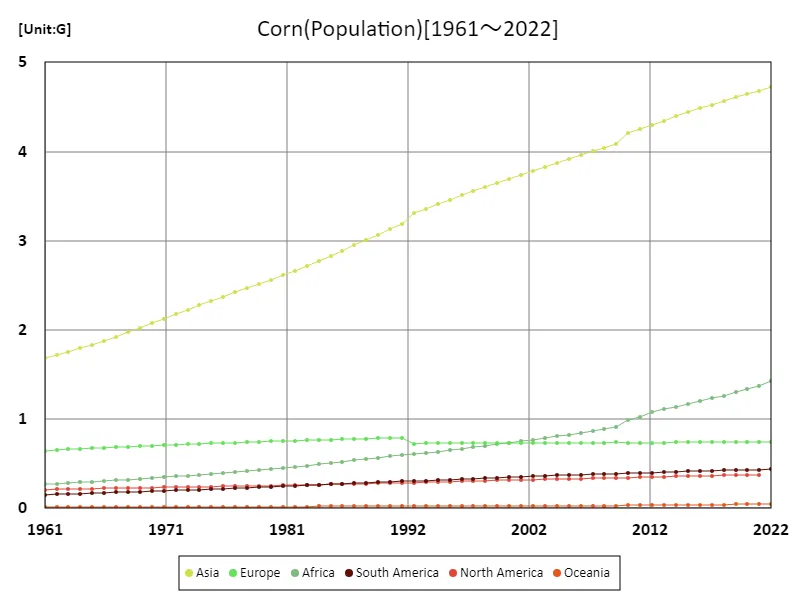
The maximum is the latest one, 4.72G of Asia
Land use for corn (latest year, continental)
According to the latest 2022 data on land use for corn in global agriculture, Asia occupies the largest area, reaching 68.2 Mha. The overall average area is 32.4 Mha, and the total area is 194 Mha. Considering the characteristics and trends so far, it is suggested that the Asian region is the main region for corn cultivation. In the Asian region, there are diverse climatic conditions and land use forms, which is thought to be the reason why areas suitable for corn cultivation are spreading. In addition, the Asian region has the largest population in the world, and the increasing demand for food may contribute to the expansion of land use. On the other hand, it has been shown that corn cultivation is not only actively carried out in the Asian region but also in other regions. This is the result of climatic conditions and agricultural technology advances around the world making it possible to produce corn, and it plays an important role in global food supply. In general, land use for corn in global agriculture is widespread, mainly in Asia, and the climatic conditions, demographics, and development of agricultural technology in each region affect the pattern. In the future, too, further expansion of land use and improvements in production efficiency will be required to meet increasing global food demand.
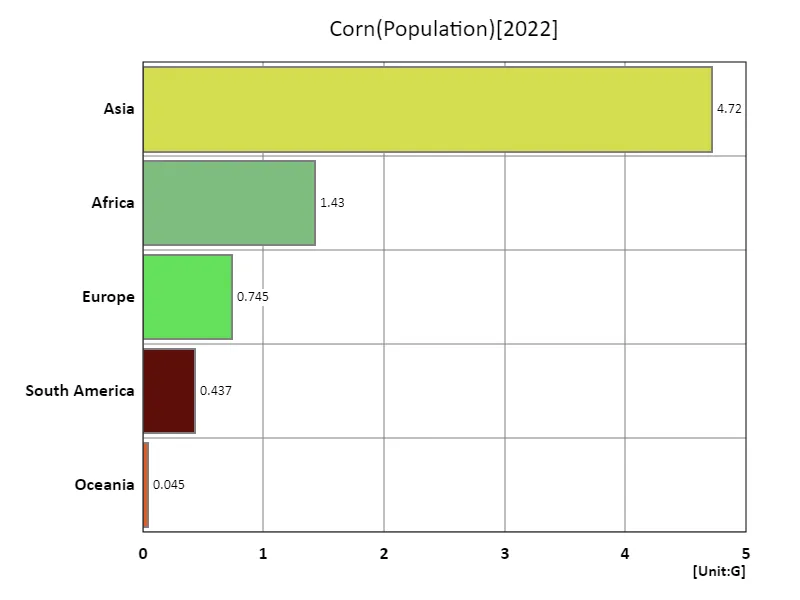
The maximum is 4.72G of Asia, the average is 1.47G, and the total is 7.37G
Main data
| Others(Corn, Population) [G] | ||||||||||
|---|---|---|---|---|---|---|---|---|---|---|
| World | Asia | Lower-middle-income countries | Upper-middle-income countries | Africa | China | India | High-income countries | Europe | Low-income countries | |
| 2022 | 7.98 | 4.72 | 3.45 | 2.56 | 1.43 | 1.43 | 1.42 | 1.22 | 0.74 | 0.72 |
| 2021 | 7.91 | 4.68 | 3.41 | 2.55 | 1.37 | 1.46 | 1.41 | 1.22 | 0.74 | 0.7 |
| 2020 | 7.84 | 4.65 | 3.37 | 2.54 | 1.34 | 1.46 | 1.4 | 1.22 | 0.74 | 0.68 |
| 2019 | 7.76 | 4.61 | 3.33 | 2.53 | 1.3 | 1.45 | 1.38 | 1.21 | 0.74 | 0.66 |
| 2018 | 7.68 | 4.57 | 3.28 | 2.52 | 1.26 | 1.45 | 1.37 | 1.21 | 0.74 | 0.64 |
| 2017 | 7.6 | 4.53 | 3.24 | 2.5 | 1.23 | 1.44 | 1.35 | 1.2 | 0.74 | 0.63 |
| 2016 | 7.51 | 4.48 | 3.19 | 2.48 | 1.2 | 1.43 | 1.34 | 1.2 | 0.74 | 0.61 |
| 2015 | 7.43 | 4.44 | 3.14 | 2.46 | 1.17 | 1.43 | 1.32 | 1.19 | 0.74 | 0.59 |
| 2014 | 7.34 | 4.39 | 3.1 | 2.44 | 1.14 | 1.42 | 1.31 | 1.18 | 0.74 | 0.58 |
| 2013 | 7.25 | 4.35 | 3.05 | 2.42 | 1.11 | 1.41 | 1.29 | 1.18 | 0.74 | 0.56 |
| 2012 | 7.16 | 4.3 | 3.01 | 2.4 | 1.08 | 1.4 | 1.27 | 1.17 | 0.74 | 0.55 |
| 2011 | 7.07 | 4.25 | 2.96 | 2.38 | 1.02 | 1.39 | 1.26 | 1.16 | 0.73 | 0.54 |
| 2010 | 6.99 | 4.2 | 2.91 | 2.36 | 0.99 | 1.38 | 1.24 | 1.15 | 0.73 | 0.52 |
| 2009 | 6.9 | 4.09 | 2.87 | 2.35 | 0.91 | 1.38 | 1.22 | 1.15 | 0.74 | 0.51 |
| 2008 | 6.81 | 4.04 | 2.82 | 2.33 | 0.89 | 1.37 | 1.21 | 1.14 | 0.74 | 0.49 |
| 2007 | 6.73 | 4 | 2.78 | 2.31 | 0.87 | 1.36 | 1.19 | 1.13 | 0.74 | 0.48 |
| 2006 | 6.64 | 3.96 | 2.74 | 2.29 | 0.85 | 1.36 | 1.17 | 1.12 | 0.73 | 0.46 |
| 2005 | 6.56 | 3.91 | 2.69 | 2.28 | 0.83 | 1.35 | 1.15 | 1.11 | 0.73 | 0.45 |
| 2004 | 6.48 | 3.87 | 2.65 | 2.26 | 0.81 | 1.34 | 1.14 | 1.1 | 0.73 | 0.44 |
| 2003 | 6.39 | 3.83 | 2.6 | 2.24 | 0.79 | 1.33 | 1.12 | 1.09 | 0.73 | 0.43 |
| 2002 | 6.31 | 3.78 | 2.56 | 2.23 | 0.77 | 1.32 | 1.1 | 1.09 | 0.73 | 0.41 |
| 2001 | 6.23 | 3.74 | 2.51 | 2.21 | 0.75 | 1.32 | 1.08 | 1.08 | 0.73 | 0.4 |
| 2000 | 6.15 | 3.69 | 2.47 | 2.19 | 0.74 | 1.31 | 1.06 | 1.07 | 0.73 | 0.39 |
| 1999 | 6.07 | 3.65 | 2.42 | 2.17 | 0.72 | 1.3 | 1.04 | 1.07 | 0.73 | 0.38 |
| 1998 | 5.99 | 3.6 | 2.38 | 2.16 | 0.7 | 1.29 | 1.02 | 1.06 | 0.73 | 0.37 |
| 1997 | 5.91 | 3.56 | 2.33 | 2.14 | 0.68 | 1.29 | 1 | 1.05 | 0.73 | 0.36 |
| 1996 | 5.83 | 3.51 | 2.29 | 2.12 | 0.67 | 1.28 | 0.98 | 1.05 | 0.73 | 0.35 |
| 1995 | 5.74 | 3.46 | 2.24 | 2.1 | 0.65 | 1.27 | 0.96 | 1.04 | 0.73 | 0.34 |
| 1994 | 5.66 | 3.41 | 2.2 | 2.08 | 0.64 | 1.25 | 0.95 | 1.03 | 0.73 | 0.33 |
| 1993 | 5.58 | 3.36 | 2.15 | 2.05 | 0.62 | 1.24 | 0.93 | 1.02 | 0.73 | 0.32 |
| 1992 | 5.49 | 3.31 | 2.11 | 2.03 | 0.61 | 1.23 | 0.91 | 1.02 | 0.73 | 0.31 |
| 1991 | 5.41 | 3.18 | 2.07 | 2.01 | 0.6 | 1.21 | 0.89 | 1.01 | 0.79 | 0.3 |
| 1990 | 5.32 | 3.13 | 2.02 | 1.98 | 0.58 | 1.19 | 0.87 | 1 | 0.79 | 0.3 |
| 1989 | 5.22 | 3.07 | 1.98 | 1.95 | 0.57 | 1.17 | 0.85 | 0.99 | 0.79 | 0.29 |
| 1988 | 5.13 | 3.01 | 1.93 | 1.92 | 0.55 | 1.15 | 0.83 | 0.99 | 0.78 | 0.28 |
| 1987 | 5.04 | 2.95 | 1.89 | 1.88 | 0.54 | 1.13 | 0.82 | 0.98 | 0.78 | 0.27 |
| 1986 | 4.95 | 2.89 | 1.84 | 1.85 | 0.52 | 1.11 | 0.8 | 0.97 | 0.77 | 0.27 |
| 1985 | 4.86 | 2.83 | 1.8 | 1.82 | 0.51 | 1.09 | 0.78 | 0.96 | 0.77 | 0.26 |
| 1984 | 4.78 | 2.77 | 1.76 | 1.79 | 0.49 | 1.07 | 0.76 | 0.96 | 0.77 | 0.25 |
| 1983 | 4.69 | 2.72 | 1.72 | 1.76 | 0.48 | 1.05 | 0.75 | 0.95 | 0.76 | 0.25 |
| 1982 | 4.61 | 2.67 | 1.67 | 1.73 | 0.47 | 1.04 | 0.73 | 0.94 | 0.76 | 0.24 |
| 1981 | 4.52 | 2.61 | 1.63 | 1.71 | 0.45 | 1.02 | 0.71 | 0.94 | 0.75 | 0.23 |
| 1980 | 4.44 | 2.56 | 1.59 | 1.68 | 0.44 | 1.01 | 0.7 | 0.93 | 0.75 | 0.23 |
| 1979 | 4.37 | 2.51 | 1.55 | 1.65 | 0.43 | 0.99 | 0.68 | 0.92 | 0.75 | 0.23 |
| 1978 | 4.29 | 2.47 | 1.51 | 1.63 | 0.42 | 0.98 | 0.67 | 0.91 | 0.74 | 0.22 |
| 1977 | 4.22 | 2.42 | 1.48 | 1.6 | 0.41 | 0.97 | 0.65 | 0.9 | 0.74 | 0.21 |
| 1976 | 4.14 | 2.37 | 1.44 | 1.58 | 0.4 | 0.95 | 0.64 | 0.9 | 0.73 | 0.21 |
| 1975 | 4.07 | 2.32 | 1.41 | 1.55 | 0.39 | 0.93 | 0.62 | 0.89 | 0.73 | 0.2 |
| 1974 | 4 | 2.27 | 1.38 | 1.52 | 0.38 | 0.92 | 0.61 | 0.88 | 0.72 | 0.2 |
| 1973 | 3.92 | 2.22 | 1.35 | 1.49 | 0.37 | 0.9 | 0.6 | 0.87 | 0.72 | 0.19 |
| 1972 | 3.84 | 2.17 | 1.32 | 1.46 | 0.36 | 0.88 | 0.58 | 0.87 | 0.71 | 0.19 |
| 1971 | 3.77 | 2.12 | 1.29 | 1.43 | 0.35 | 0.85 | 0.57 | 0.86 | 0.71 | 0.18 |
| 1970 | 3.7 | 2.07 | 1.26 | 1.4 | 0.34 | 0.83 | 0.56 | 0.85 | 0.7 | 0.18 |
| 1969 | 3.62 | 2.02 | 1.23 | 1.37 | 0.33 | 0.81 | 0.55 | 0.84 | 0.7 | 0.17 |
| 1968 | 3.55 | 1.97 | 1.2 | 1.34 | 0.32 | 0.79 | 0.53 | 0.83 | 0.69 | 0.17 |
| 1967 | 3.48 | 1.92 | 1.17 | 1.31 | 0.31 | 0.77 | 0.52 | 0.82 | 0.69 | 0.16 |
| 1966 | 3.41 | 1.88 | 1.14 | 1.28 | 0.31 | 0.75 | 0.51 | 0.81 | 0.68 | 0.16 |
| 1965 | 3.34 | 1.83 | 1.12 | 1.25 | 0.3 | 0.73 | 0.5 | 0.8 | 0.68 | 0.16 |
| 1964 | 3.27 | 1.79 | 1.09 | 1.22 | 0.29 | 0.71 | 0.49 | 0.79 | 0.67 | 0.15 |
| 1963 | 3.2 | 1.75 | 1.07 | 1.18 | 0.28 | 0.7 | 0.48 | 0.78 | 0.66 | 0.15 |
| 1962 | 3.13 | 1.72 | 1.04 | 1.15 | 0.28 | 0.69 | 0.47 | 0.78 | 0.65 | 0.15 |
| 1961 | 3.07 | 1.69 | 1.02 | 1.13 | 0.27 | 0.68 | 0.46 | 0.77 | 0.65 | 0.14 |


Comments