Abstract
The latest data on land use for millet shows that Poland occupies the largest area. This suggests that Poland plays an important role in millet production. Millet is generally more regional than major grains such as wheat and rice, and demand tends to be strong in certain regions. The reasons for Poland’s large-scale land use for millet may include climatic conditions, land suitability, and agricultural policy influences. Millet is also closely related to regional food culture and traditions, and Poland may be a region with such historical and cultural background. Based on past trends, it is likely that Poland will continue to be an important player in millet production. In addition, factors such as the balance of demand and supply between regions and advances in agricultural technology are expected to affect land use for millet in the future.
Land use for miscellaneous grains (Worldwide)
Analysis of data from 1961 to 2022 reveals that Poland recorded its highest land use for millets in 2006, at 1.54 Mha, and then declined by 22.4%. Millet land use during this period has several characteristics. First, at its peak in Poland, factors such as regional agricultural policies and economic conditions may have promoted millet production. However, the subsequent decline may be due to changes in agricultural structure, changes in demand, and technological innovations. In addition, the effects of competition and trade in other regions and countries may have also influenced millet land use. Environmental and climate change factors should also be taken into account. Past trends suggest that millet land use tends to fluctuate due to various factors, suggesting the existence of complex backgrounds rather than a simple pattern of increase and decrease. It is expected that sustainable agricultural production and food security efforts will continue to affect millet land use in the future.
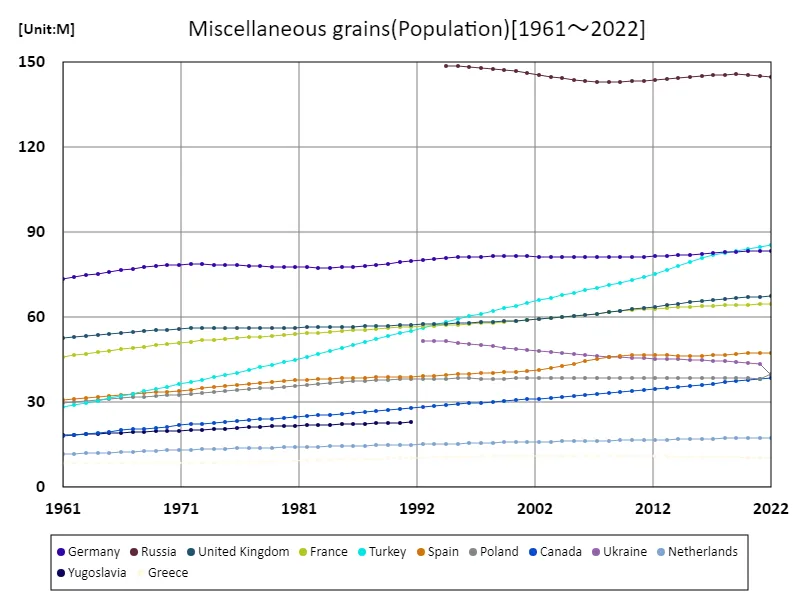
The maximum is 149M[1994] of Russia, and the current value is about 97.2%
Land use for miscellaneous grains (latest year, countries around the world)
Based on the 2022 data on millet land use, Poland occupies the largest area. This figure suggests that Poland plays an important role in millet production. Looking at the average values, millet land use is generally relatively small. However, the total area of 674 kha indicates that millet cultivation remains important globally. Millet land use is strongly influenced by regional and cultural background, and it is interesting to note that Poland occupies the largest area in a region with such elements. Based on past trends, millet production tends to fluctuate according to regional characteristics and demand. It is expected that changes in regional food culture and agricultural policies will continue to affect millet land use in the future. Promotion of sustainable agriculture and efforts to address food security will be important factors in millet production and land use.
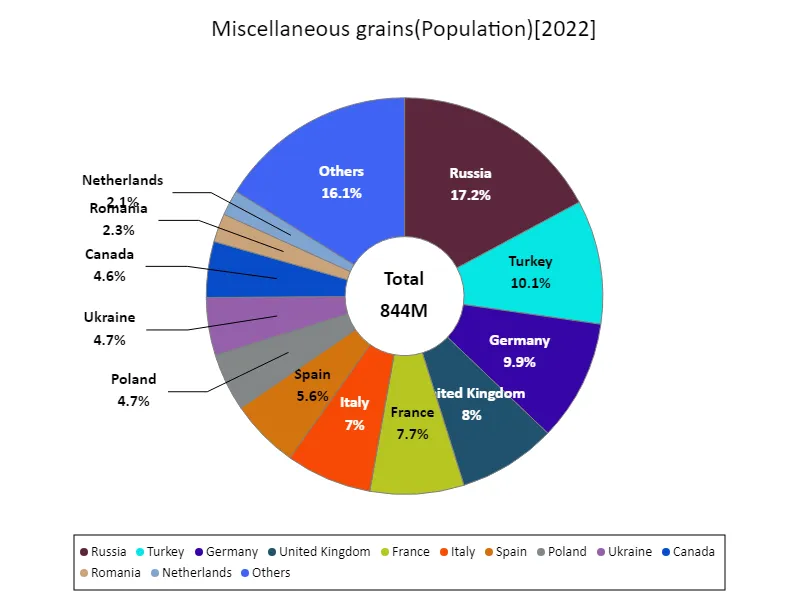
The maximum is 145M of Russia, the average is 24.1M, and the total is 844M
Land use for miscellaneous grains (continent)
When analyzing the 1961 data on land use for millets, we can see that Europe occupies the largest area. This suggests that Europe is the leading region in millet production. As the 1961 data is recorded as the current maximum, millet land use may have decreased over the past decades. Possible reasons for this decrease include changes in the agricultural industrial structure, productivity improvements due to technological innovation, and changes in demand. It is also possible that Europe has advantageous factors in agricultural production compared to other regions. Based on past trends, millet land use tends to fluctuate depending on regional characteristics and economic conditions. It is expected that efforts toward sustainable agricultural production and food security will continue to affect millet land use in the future.
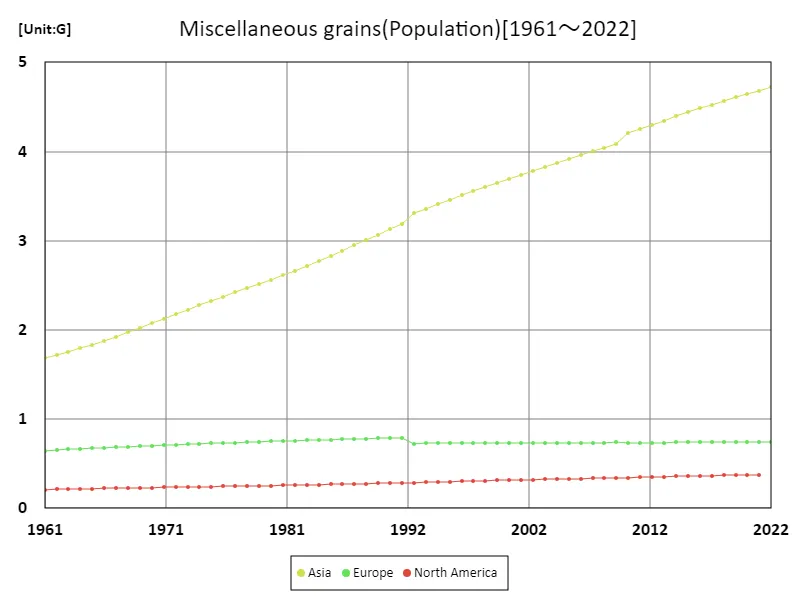
The maximum is the latest one, 4.72G of Asia
Land use for miscellaneous grains (latest year, continent)
According to the data for 2022, Europe occupies the largest area in land use for millet. Looking at the average values, millet land use is relatively widespread, and although there are regional biases, it suggests that it has a certain importance around the world. The total area of 674 kha indicates that millet production remains important globally. It is an interesting feature that Europe occupies the largest area in land use for millet, suggesting that this region is a major player in millet production. Based on past trends, millet land use tends to be influenced by regional agricultural policies, economic conditions, and regional food culture. In addition, climatic conditions and land suitability are also important factors for millet production. It is expected that changes in regional demand and supply, promotion of sustainable agriculture, etc. will continue to affect millet land use in the future.
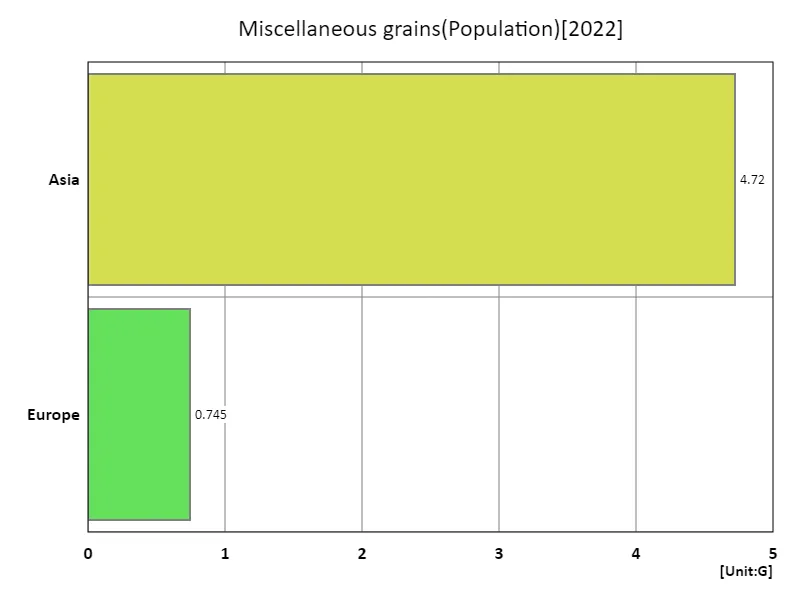
The maximum is 4.72G of Asia, the average is 2.73G, and the total is 5.47G
Main data
| Others(Miscellaneous grains, Population) [G] | ||||||||||
|---|---|---|---|---|---|---|---|---|---|---|
| World | Asia | Lower-middle-income countries | Upper-middle-income countries | High-income countries | Europe | North America | European Union | Russia | Turkey | |
| 2022 | 7.98 | 4.72 | 3.45 | 2.56 | 1.22 | 0.74 | 0.6 | 0.45 | 0.14 | 0.09 |
| 2021 | 7.91 | 4.68 | 3.41 | 2.55 | 1.22 | 0.74 | 0.6 | 0.45 | 0.15 | 0.08 |
| 2020 | 7.84 | 4.65 | 3.37 | 2.54 | 1.22 | 0.74 | 0.59 | 0.45 | 0.15 | 0.08 |
| 2019 | 7.76 | 4.61 | 3.33 | 2.53 | 1.21 | 0.74 | 0.59 | 0.45 | 0.15 | 0.08 |
| 2018 | 7.68 | 4.57 | 3.28 | 2.52 | 1.21 | 0.74 | 0.59 | 0.44 | 0.15 | 0.08 |
| 2017 | 7.6 | 4.53 | 3.24 | 2.5 | 1.2 | 0.74 | 0.58 | 0.44 | 0.15 | 0.08 |
| 2016 | 7.51 | 4.48 | 3.19 | 2.48 | 1.2 | 0.74 | 0.58 | 0.44 | 0.15 | 0.08 |
| 2015 | 7.43 | 4.44 | 3.14 | 2.46 | 1.19 | 0.74 | 0.57 | 0.44 | 0.14 | 0.08 |
| 2014 | 7.34 | 4.39 | 3.1 | 2.44 | 1.18 | 0.74 | 0.57 | 0.44 | 0.14 | 0.08 |
| 2013 | 7.25 | 4.35 | 3.05 | 2.42 | 1.18 | 0.74 | 0.56 | 0.44 | 0.14 | 0.08 |
| 2012 | 7.16 | 4.3 | 3.01 | 2.4 | 1.17 | 0.74 | 0.55 | 0.44 | 0.14 | 0.08 |
| 2011 | 7.07 | 4.25 | 2.96 | 2.38 | 1.16 | 0.73 | 0.55 | 0.44 | 0.14 | 0.07 |
| 2010 | 6.99 | 4.2 | 2.91 | 2.36 | 1.15 | 0.73 | 0.54 | 0.44 | 0.14 | 0.07 |
| 2009 | 6.9 | 4.09 | 2.87 | 2.35 | 1.15 | 0.74 | 0.54 | 0.44 | 0.14 | 0.07 |
| 2008 | 6.81 | 4.04 | 2.82 | 2.33 | 1.14 | 0.74 | 0.53 | 0.44 | 0.14 | 0.07 |
| 2007 | 6.73 | 4 | 2.78 | 2.31 | 1.13 | 0.74 | 0.53 | 0.44 | 0.14 | 0.07 |
| 2006 | 6.64 | 3.96 | 2.74 | 2.29 | 1.12 | 0.73 | 0.52 | 0.44 | 0.14 | 0.07 |
| 2005 | 6.56 | 3.91 | 2.69 | 2.28 | 1.11 | 0.73 | 0.51 | 0.44 | 0.14 | 0.07 |
| 2004 | 6.48 | 3.87 | 2.65 | 2.26 | 1.1 | 0.73 | 0.51 | 0.43 | 0.14 | 0.07 |
| 2003 | 6.39 | 3.83 | 2.6 | 2.24 | 1.09 | 0.73 | 0.5 | 0.43 | 0.14 | 0.07 |
| 2002 | 6.31 | 3.78 | 2.56 | 2.23 | 1.09 | 0.73 | 0.5 | 0.43 | 0.15 | 0.07 |
| 2001 | 6.23 | 3.74 | 2.51 | 2.21 | 1.08 | 0.73 | 0.49 | 0.43 | 0.15 | 0.07 |
| 2000 | 6.15 | 3.69 | 2.47 | 2.19 | 1.07 | 0.73 | 0.49 | 0.43 | 0.15 | 0.06 |
| 1999 | 6.07 | 3.65 | 2.42 | 2.17 | 1.07 | 0.73 | 0.48 | 0.43 | 0.15 | 0.06 |
| 1998 | 5.99 | 3.6 | 2.38 | 2.16 | 1.06 | 0.73 | 0.47 | 0.43 | 0.15 | 0.06 |
| 1997 | 5.91 | 3.56 | 2.33 | 2.14 | 1.05 | 0.73 | 0.47 | 0.43 | 0.15 | 0.06 |
| 1996 | 5.83 | 3.51 | 2.29 | 2.12 | 1.05 | 0.73 | 0.46 | 0.43 | 0.15 | 0.06 |
| 1995 | 5.74 | 3.46 | 2.24 | 2.1 | 1.04 | 0.73 | 0.45 | 0.43 | 0.15 | 0.06 |
| 1994 | 5.66 | 3.41 | 2.2 | 2.08 | 1.03 | 0.73 | 0.45 | 0.43 | 0.15 | 0.06 |
| 1993 | 5.58 | 3.36 | 2.15 | 2.05 | 1.02 | 0.73 | 0.44 | 0.42 | 0.06 | |
| 1992 | 5.49 | 3.31 | 2.11 | 2.03 | 1.02 | 0.73 | 0.43 | 0.41 | 0.06 | |
| 1991 | 5.41 | 3.18 | 2.01 | 1.01 | 0.79 | 0.43 | 0.39 | 0.06 | ||
| 1990 | 5.32 | 3.13 | 1.98 | 1 | 0.79 | 0.42 | 0.39 | 0.05 | ||
| 1989 | 5.22 | 3.07 | 1.95 | 0.99 | 0.79 | 0.42 | 0.39 | 0.05 | ||
| 1988 | 5.13 | 3.01 | 1.92 | 0.99 | 0.78 | 0.41 | 0.39 | 0.05 | ||
| 1987 | 5.04 | 2.95 | 1.88 | 0.98 | 0.78 | 0.4 | 0.39 | 0.05 | ||
| 1986 | 4.95 | 2.89 | 1.85 | 0.97 | 0.77 | 0.4 | 0.39 | 0.05 | ||
| 1985 | 4.86 | 2.83 | 1.82 | 0.96 | 0.77 | 0.39 | 0.38 | 0.05 | ||
| 1984 | 4.78 | 2.77 | 1.79 | 0.96 | 0.77 | 0.39 | 0.38 | 0.05 | ||
| 1983 | 4.69 | 2.72 | 1.76 | 0.95 | 0.76 | 0.38 | 0.38 | 0.05 | ||
| 1982 | 4.61 | 2.67 | 1.73 | 0.94 | 0.76 | 0.38 | 0.38 | 0.05 | ||
| 1981 | 4.52 | 2.61 | 1.71 | 0.94 | 0.75 | 0.37 | 0.38 | 0.04 | ||
| 1980 | 4.44 | 2.56 | 1.68 | 0.93 | 0.75 | 0.37 | 0.38 | 0.04 | ||
| 1979 | 4.37 | 2.51 | 1.65 | 0.92 | 0.75 | 0.36 | 0.38 | 0.04 | ||
| 1978 | 4.29 | 2.47 | 1.63 | 0.91 | 0.74 | 0.36 | 0.38 | 0.04 | ||
| 1977 | 4.22 | 2.42 | 1.6 | 0.9 | 0.74 | 0.35 | 0.37 | 0.04 | ||
| 1976 | 4.14 | 2.37 | 1.58 | 0.9 | 0.73 | 0.35 | 0.37 | 0.04 | ||
| 1975 | 4.07 | 2.32 | 1.55 | 0.89 | 0.73 | 0.34 | 0.37 | 0.04 | ||
| 1974 | 4 | 2.27 | 1.52 | 0.88 | 0.72 | 0.34 | 0.37 | 0.04 | ||
| 1973 | 3.92 | 2.22 | 1.49 | 0.87 | 0.72 | 0.33 | 0.37 | 0.04 | ||
| 1972 | 3.84 | 2.17 | 1.46 | 0.87 | 0.71 | 0.33 | 0.36 | 0.04 | ||
| 1971 | 3.77 | 2.12 | 1.43 | 0.86 | 0.71 | 0.32 | 0.36 | 0.04 | ||
| 1970 | 3.7 | 2.07 | 1.4 | 0.85 | 0.7 | 0.32 | 0.36 | 0.04 | ||
| 1969 | 3.62 | 2.02 | 1.37 | 0.84 | 0.7 | 0.31 | 0.36 | 0.03 | ||
| 1968 | 3.55 | 1.97 | 1.34 | 0.83 | 0.69 | 0.31 | 0.35 | 0.03 | ||
| 1967 | 3.48 | 1.92 | 1.31 | 0.82 | 0.69 | 0.3 | 0.35 | 0.03 | ||
| 1966 | 3.41 | 1.88 | 1.28 | 0.81 | 0.68 | 0.3 | 0.35 | 0.03 | ||
| 1965 | 3.34 | 1.83 | 1.25 | 0.8 | 0.68 | 0.29 | 0.35 | 0.03 | ||
| 1964 | 3.27 | 1.79 | 1.22 | 0.79 | 0.67 | 0.29 | 0.34 | 0.03 | ||
| 1963 | 3.2 | 1.75 | 1.18 | 0.78 | 0.66 | 0.28 | 0.34 | 0.03 | ||
| 1962 | 3.13 | 1.72 | 1.15 | 0.78 | 0.65 | 0.28 | 0.34 | 0.03 | ||
| 1961 | 3.07 | 1.69 | 1.13 | 0.77 | 0.65 | 0.27 | 0.33 | 0.03 | ||

Comments