Abstract
Rye production has historically been a vital component of global agriculture, particularly in Europe, where it thrives in cooler climates. Over the years, global production has fluctuated due to varying demand for rye as a staple food, animal feed, and for its use in brewing and distilling. Germany has consistently led in rye production, with its output reaching 3.13 million tons in 2022, reflecting a strong agricultural tradition and favorable growing conditions. Other notable producers include Poland and Russia, contributing significantly to overall volumes. While rye has faced competition from other grains, its resilience in marginal soils and nutritional benefits keep it relevant. Recent trends indicate a growing interest in sustainable practices and local sourcing, further enhancing rye’s role in food security and biodiversity.
Rye production (worldwide)
Rye production has undergone significant changes from 1961 to 2022, reflecting agricultural, economic, and climatic influences. The highest recorded production was 13.9 million tons in Russia in 1992, a peak that showcased the country’s strong agrarian base. However, current production stands at only 15.7% of that peak, highlighting a considerable decline due to shifts in farming practices, land use changes, and competition from more profitable grains. Throughout this period, Germany has emerged as a leading producer, with consistent output bolstered by traditional cultivation methods. Additionally, rising interest in rye for health benefits and sustainable agriculture has sparked renewed focus, promoting its value in food systems and diversifying crop rotations.
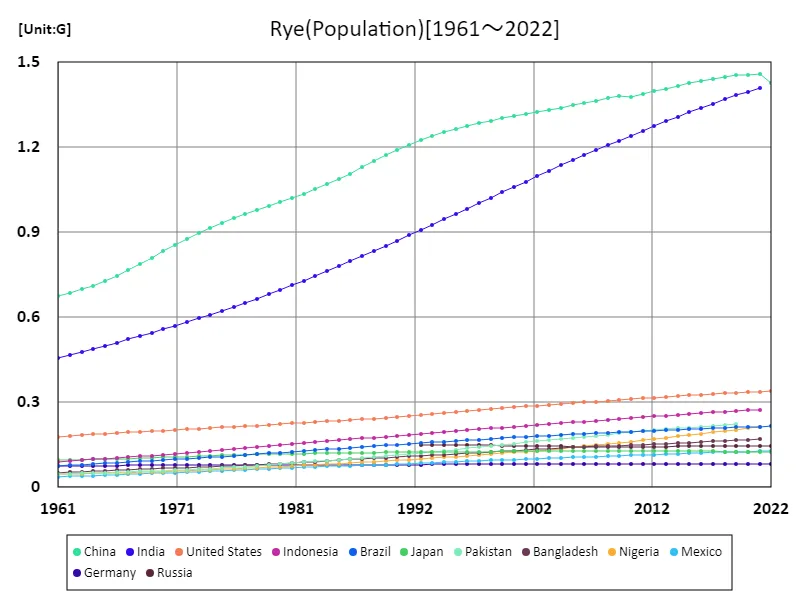
The maximum is 1.46G[2021] of China, and the current value is about 97.8%
Rye production (latest year, world)
Rye production in global agriculture shows notable trends and characteristics, particularly in 2022. Germany emerged as the top producer, contributing 3.13 million tons, a testament to its strong agricultural infrastructure and favorable growing conditions. The average production across leading countries was 202,000 tons, while the total global production reached 13.1 million tons, indicating a stable demand for rye as both a food source and a component in livestock feed. Over the years, rye has seen fluctuating market prices, driven by factors such as weather conditions, crop rotation practices, and competition from other grains. Recent trends indicate a resurgence in interest due to rye’s health benefits and sustainable agricultural practices, positioning it as a valuable crop in diversifying food systems and enhancing food security.
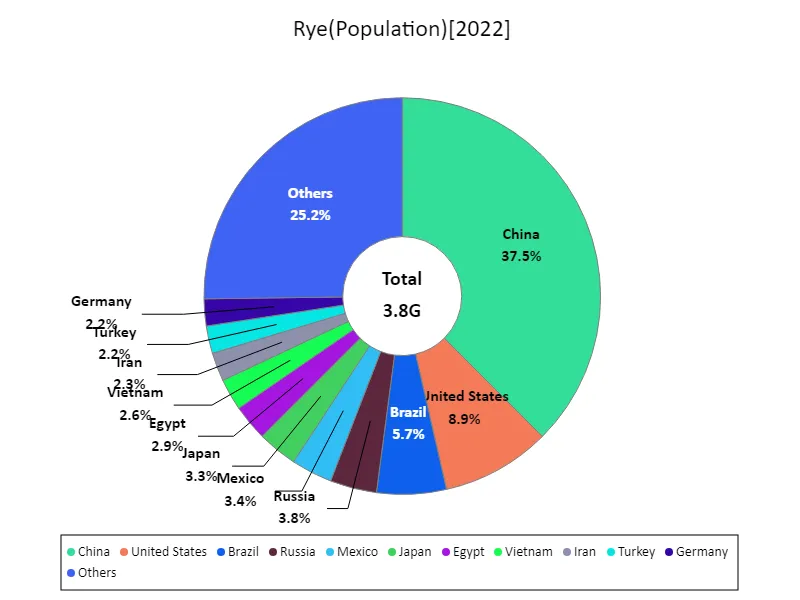
The maximum is 1.43G of China, the average is 58.5M, and the total is 3.8G
Rye production (continent)
Rye production has seen significant fluctuations in global agriculture from 1961 to 2022, with a peak of 35.7 million tons recorded in Europe in 1990. Currently, European production stands at only 30.9% of that peak, reflecting changes in agricultural practices, market demand, and competition from other grains. Traditionally grown in cooler climates, rye is valued for its adaptability and resilience, making it a staple in various regions. In recent years, there has been a renewed interest in rye due to its health benefits and role in sustainable farming practices. As consumers increasingly prioritize nutrition and sustainability, rye’s potential for crop diversification and food security is being recognized, indicating a promising trend for its future in global agriculture.
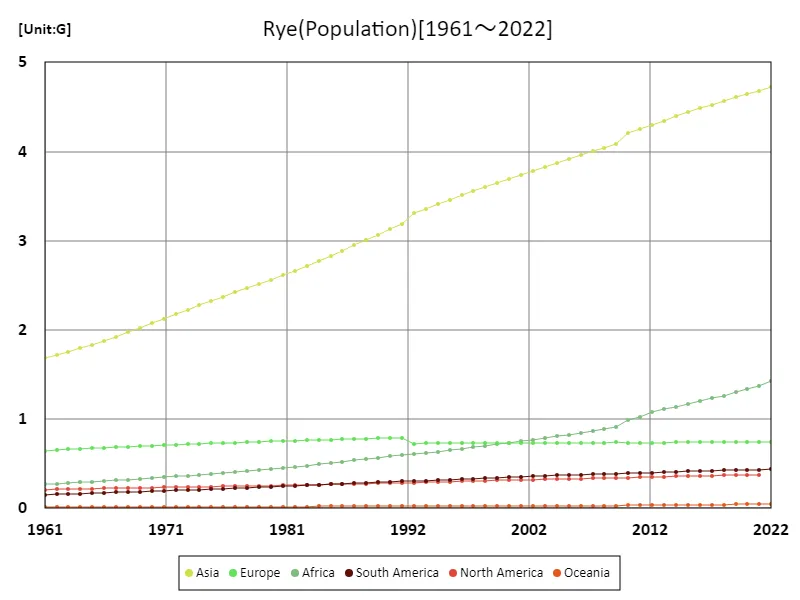
The maximum is the latest one, 4.72G of Asia
Rye production (latest year, continental)
In 2022, global rye production reached a total of 13.1 million tons, with Europe leading at 11 million tons, highlighting its dominance in rye cultivation. The average production among key producers stood at 2.19 million tons, illustrating significant contributions from various countries. Rye thrives in cooler climates, making it well-suited to European agriculture, where it is valued for its versatility as a food source, livestock feed, and for brewing. Despite historical peaks, the overall production has faced challenges due to competition from other grains and changing consumer preferences. However, increasing interest in rye’s health benefits and its role in sustainable agriculture suggests a positive trend, positioning it as an important crop for future food security and diversity.
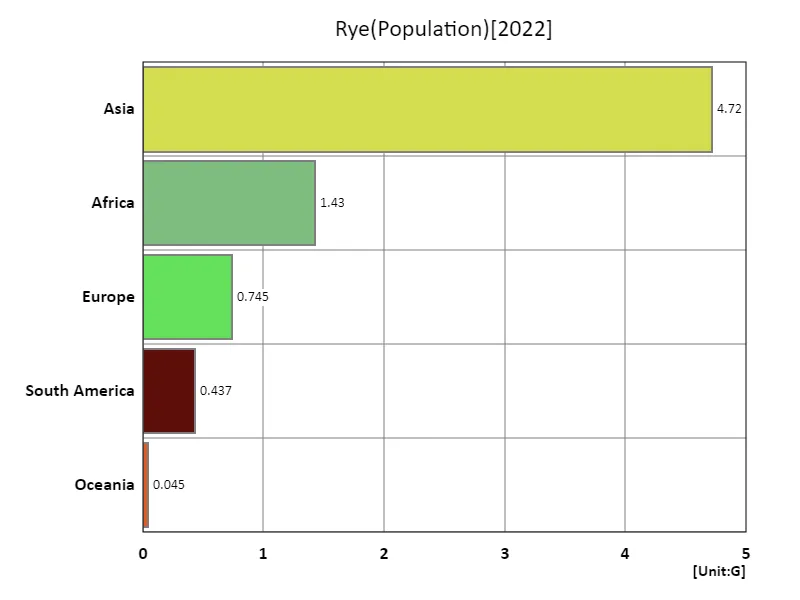
The maximum is 4.72G of Asia, the average is 1.47G, and the total is 7.37G
Main data
| Others(Rye, Population) [G] | ||||||||||
|---|---|---|---|---|---|---|---|---|---|---|
| World | Asia | Lower-middle-income countries | Upper-middle-income countries | Southern Asia | Net Food Importing Developing Countries | Eastern Asia | China | India | Africa | |
| 2022 | 7.98 | 4.72 | 3.45 | 2.56 | 1.43 | 1.43 | ||||
| 2021 | 7.91 | 4.68 | 3.41 | 2.55 | 1.99 | 1.7 | 1.66 | 1.46 | 1.41 | 1.37 |
| 2020 | 7.84 | 4.65 | 3.37 | 2.54 | 1.97 | 1.67 | 1.66 | 1.46 | 1.4 | 1.34 |
| 2019 | 7.76 | 4.61 | 3.33 | 2.53 | 1.95 | 1.63 | 1.66 | 1.45 | 1.38 | 1.3 |
| 2018 | 7.68 | 4.57 | 3.28 | 2.52 | 1.93 | 1.59 | 1.66 | 1.45 | 1.37 | 1.26 |
| 2017 | 7.6 | 4.53 | 3.24 | 2.5 | 1.9 | 1.56 | 1.65 | 1.44 | 1.35 | 1.23 |
| 2016 | 7.51 | 4.48 | 3.19 | 2.48 | 1.88 | 1.53 | 1.64 | 1.43 | 1.34 | 1.2 |
| 2015 | 7.43 | 4.44 | 3.14 | 2.46 | 1.86 | 1.5 | 1.63 | 1.43 | 1.32 | 1.17 |
| 2014 | 7.34 | 4.39 | 3.1 | 2.44 | 1.83 | 1.46 | 1.62 | 1.42 | 1.31 | 1.14 |
| 2013 | 7.25 | 4.35 | 3.05 | 2.42 | 1.81 | 1.43 | 1.61 | 1.41 | 1.29 | 1.11 |
| 2012 | 7.16 | 4.3 | 3.01 | 2.4 | 1.79 | 1.4 | 1.6 | 1.4 | 1.27 | 1.08 |
| 2011 | 7.07 | 4.25 | 2.96 | 2.38 | 1.76 | 1.34 | 1.59 | 1.39 | 1.26 | 1.02 |
| 2010 | 6.99 | 4.2 | 2.91 | 2.36 | 1.74 | 1.31 | 1.58 | 1.38 | 1.24 | 0.99 |
| 2009 | 6.9 | 4.09 | 2.87 | 2.35 | 1.66 | 1.21 | 1.58 | 1.38 | 1.22 | 0.91 |
| 2008 | 6.81 | 4.04 | 2.82 | 2.33 | 1.64 | 1.19 | 1.58 | 1.37 | 1.21 | 0.89 |
| 2007 | 6.73 | 4 | 2.78 | 2.31 | 1.61 | 1.17 | 1.57 | 1.36 | 1.19 | 0.87 |
| 2006 | 6.64 | 3.96 | 2.74 | 2.29 | 1.59 | 1.14 | 1.56 | 1.36 | 1.17 | 0.85 |
| 2005 | 6.56 | 3.91 | 2.69 | 2.28 | 1.57 | 1.12 | 1.55 | 1.35 | 1.15 | 0.83 |
| 2004 | 6.48 | 3.87 | 2.65 | 2.26 | 1.55 | 1.1 | 1.54 | 1.34 | 1.14 | 0.81 |
| 2003 | 6.39 | 3.83 | 2.6 | 2.24 | 1.52 | 1.08 | 1.53 | 1.33 | 1.12 | 0.79 |
| 2002 | 6.31 | 3.78 | 2.56 | 2.23 | 1.5 | 1.06 | 1.52 | 1.32 | 1.1 | 0.77 |
| 2001 | 6.23 | 3.74 | 2.51 | 2.21 | 1.47 | 1.03 | 1.51 | 1.32 | 1.08 | 0.75 |
| 2000 | 6.15 | 3.69 | 2.47 | 2.19 | 1.45 | 1.01 | 1.51 | 1.31 | 1.06 | 0.74 |
| 1999 | 6.07 | 3.65 | 2.42 | 2.17 | 1.42 | 0.99 | 1.5 | 1.3 | 1.04 | 0.72 |
| 1998 | 5.99 | 3.6 | 2.38 | 2.16 | 1.4 | 0.97 | 1.49 | 1.29 | 1.02 | 0.7 |
| 1997 | 5.91 | 3.56 | 2.33 | 2.14 | 1.37 | 0.95 | 1.48 | 1.29 | 1 | 0.68 |
| 1996 | 5.83 | 3.51 | 2.29 | 2.12 | 1.35 | 0.93 | 1.47 | 1.28 | 0.98 | 0.67 |
| 1995 | 5.74 | 3.46 | 2.24 | 2.1 | 1.32 | 0.9 | 1.46 | 1.27 | 0.96 | 0.65 |
| 1994 | 5.66 | 3.41 | 2.2 | 2.08 | 1.29 | 0.88 | 1.45 | 1.25 | 0.95 | 0.64 |
| 1993 | 5.58 | 3.36 | 2.15 | 2.05 | 1.27 | 0.86 | 1.43 | 1.24 | 0.93 | 0.62 |
| 1992 | 5.49 | 3.31 | 2.11 | 2.03 | 1.24 | 0.85 | 1.42 | 1.23 | 0.91 | 0.61 |
| 1991 | 5.41 | 3.18 | 2.07 | 2.01 | 1.22 | 0.82 | 1.4 | 1.21 | 0.89 | 0.6 |
| 1990 | 5.32 | 3.13 | 2.02 | 1.98 | 1.19 | 0.8 | 1.38 | 1.19 | 0.87 | 0.58 |
| 1989 | 5.22 | 3.07 | 1.98 | 1.95 | 1.17 | 0.78 | 1.36 | 1.17 | 0.85 | 0.57 |
| 1988 | 5.13 | 3.01 | 1.93 | 1.92 | 1.14 | 0.76 | 1.34 | 1.15 | 0.83 | 0.55 |
| 1987 | 5.04 | 2.95 | 1.89 | 1.88 | 1.11 | 0.74 | 1.31 | 1.13 | 0.82 | 0.54 |
| 1986 | 4.95 | 2.89 | 1.84 | 1.85 | 1.09 | 0.72 | 1.29 | 1.11 | 0.8 | 0.52 |
| 1985 | 4.86 | 2.83 | 1.8 | 1.82 | 1.06 | 0.71 | 1.27 | 1.09 | 0.78 | 0.51 |
| 1984 | 4.78 | 2.77 | 1.76 | 1.79 | 1.04 | 0.69 | 1.25 | 1.07 | 0.76 | 0.49 |
| 1983 | 4.69 | 2.72 | 1.72 | 1.76 | 1.01 | 0.67 | 1.23 | 1.05 | 0.75 | 0.48 |
| 1982 | 4.61 | 2.67 | 1.67 | 1.73 | 0.99 | 0.65 | 1.21 | 1.04 | 0.73 | 0.47 |
| 1981 | 4.52 | 2.61 | 1.63 | 1.71 | 0.97 | 0.63 | 1.2 | 1.02 | 0.71 | 0.45 |
| 1980 | 4.44 | 2.56 | 1.59 | 1.68 | 0.94 | 0.62 | 1.18 | 1.01 | 0.7 | 0.44 |
| 1979 | 4.37 | 2.51 | 1.55 | 1.65 | 0.92 | 0.6 | 1.16 | 0.99 | 0.68 | 0.43 |
| 1978 | 4.29 | 2.47 | 1.51 | 1.63 | 0.9 | 0.59 | 1.15 | 0.98 | 0.67 | 0.42 |
| 1977 | 4.22 | 2.42 | 1.48 | 1.6 | 0.88 | 0.57 | 1.13 | 0.97 | 0.65 | 0.41 |
| 1976 | 4.14 | 2.37 | 1.44 | 1.58 | 0.86 | 0.56 | 1.12 | 0.95 | 0.64 | 0.4 |
| 1975 | 4.07 | 2.32 | 1.41 | 1.55 | 0.83 | 0.55 | 1.1 | 0.93 | 0.62 | 0.39 |
| 1974 | 4 | 2.27 | 1.38 | 1.52 | 0.82 | 0.53 | 1.08 | 0.92 | 0.61 | 0.38 |
| 1973 | 3.92 | 2.22 | 1.35 | 1.49 | 0.8 | 0.52 | 1.06 | 0.9 | 0.6 | 0.37 |
| 1972 | 3.84 | 2.17 | 1.32 | 1.46 | 0.78 | 0.51 | 1.03 | 0.88 | 0.58 | 0.36 |
| 1971 | 3.77 | 2.12 | 1.29 | 1.43 | 0.76 | 0.49 | 1.01 | 0.85 | 0.57 | 0.35 |
| 1970 | 3.7 | 2.07 | 1.26 | 1.4 | 0.74 | 0.48 | 0.98 | 0.83 | 0.56 | 0.34 |
| 1969 | 3.62 | 2.02 | 1.23 | 1.37 | 0.73 | 0.47 | 0.96 | 0.81 | 0.55 | 0.33 |
| 1968 | 3.55 | 1.97 | 1.2 | 1.34 | 0.71 | 0.46 | 0.93 | 0.79 | 0.53 | 0.32 |
| 1967 | 3.48 | 1.92 | 1.17 | 1.31 | 0.69 | 0.45 | 0.91 | 0.77 | 0.52 | 0.31 |
| 1966 | 3.41 | 1.88 | 1.14 | 1.28 | 0.68 | 0.44 | 0.89 | 0.75 | 0.51 | 0.31 |
| 1965 | 3.34 | 1.83 | 1.12 | 1.25 | 0.66 | 0.42 | 0.87 | 0.73 | 0.5 | 0.3 |
| 1964 | 3.27 | 1.79 | 1.09 | 1.22 | 0.65 | 0.41 | 0.85 | 0.71 | 0.49 | 0.29 |
| 1963 | 3.2 | 1.75 | 1.07 | 1.18 | 0.63 | 0.4 | 0.83 | 0.7 | 0.48 | 0.28 |
| 1962 | 3.13 | 1.72 | 1.04 | 1.15 | 0.62 | 0.39 | 0.82 | 0.69 | 0.47 | 0.28 |
| 1961 | 3.07 | 1.69 | 1.02 | 1.13 | 0.61 | 0.38 | 0.81 | 0.68 | 0.46 | 0.27 |


Comments