
Abstract
According to the latest data on global buckwheat production, Russia remains the largest producer in 2022, with production reaching 1.22 Mt. This is an interesting figure when considering the trends in global buckwheat production over the past few years. In general, buckwheat production depends on climatic conditions and soil suitability, so production is prominent in cold regions such as Russia. Buckwheat is also an important crop in Asian countries such as Japan and China, and is known as a traditional cultivation area. Looking at the trends to date, it is believed that the demand for buckwheat is stable, especially in the Asian region. In addition, with the increasing importance of sustainable agriculture, buckwheat is relatively cold-resistant and can be cultivated according to the climatic conditions of the region, so demand is likely to continue in the future. However, production volume may fluctuate due to the influence of climate change and economic factors. Therefore, global buckwheat production requires constant attention.
Buckwheat production (worldwide)
Looking at the world buckwheat production data from 1961 to 2022, its characteristics and trends become clear. The largest producer was China in 1992, when production reached 3.1 Mt. The decline from the peak in China is 16.3%, which is an interesting trend. This may be related to changes in China’s agriculture and economic development. On the other hand, there is a trend of increasing buckwheat production in other countries. This suggests that buckwheat production is also increasing in other regions due to developments in agricultural technology and economy. In addition, the impact of climate change and natural disasters are also factors to consider. Buckwheat is suitable for cultivation in cold regions, so warming due to climate change may affect production. Therefore, sustainable agricultural practices and appropriate measures against climate change are important. Overall, many factors are involved in world buckwheat production, and it is important to continuously monitor these and take appropriate measures.
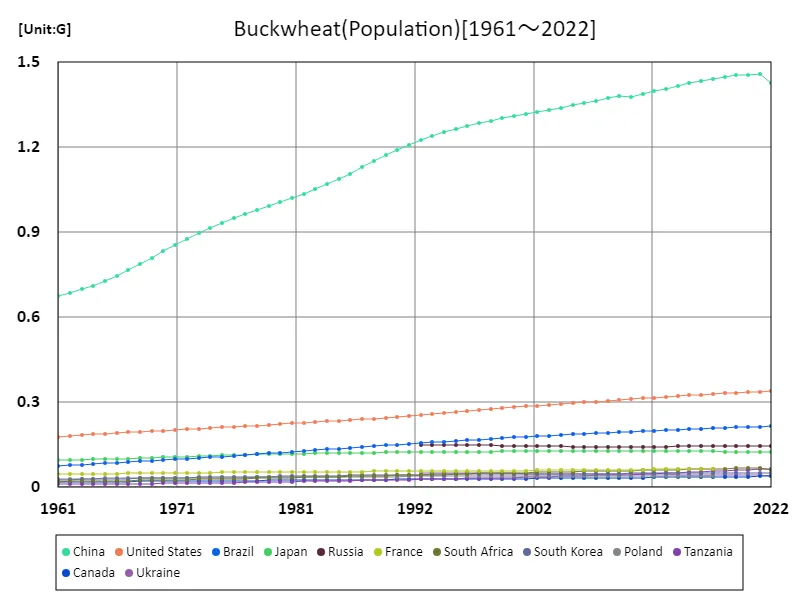
The maximum is 1.46G[2021] of China, and the current value is about 97.8%
Buckwheat production (latest year, countries around the world)
The 2022 data on buckwheat production in world agriculture shows some interesting features. The overall maximum production is 1.22 Mt, the average is 106 kt, and the total is 2.24 Mt. This suggests that the global buckwheat market is relatively uniform. In particular, Russia’s maximum production is noteworthy, indicating that Russia plays an important role in global buckwheat production. On the other hand, the average production of 106 kt indicates the spread of buckwheat cultivation around the world and the balance between demand and supply. The total buckwheat production of 2.24 Mt also suggests that buckwheat plays an important role in the world’s food supply. The trend so far is that the demand for buckwheat around the world is stable. This is likely due to the fact that buckwheat is popular as a staple food in many countries and its high nutritional value. However, due to differences in climatic conditions and agricultural techniques in each region, production volumes may fluctuate. Therefore, the promotion of sustainable agriculture and appropriate measures against climate change will become increasingly important in the future.
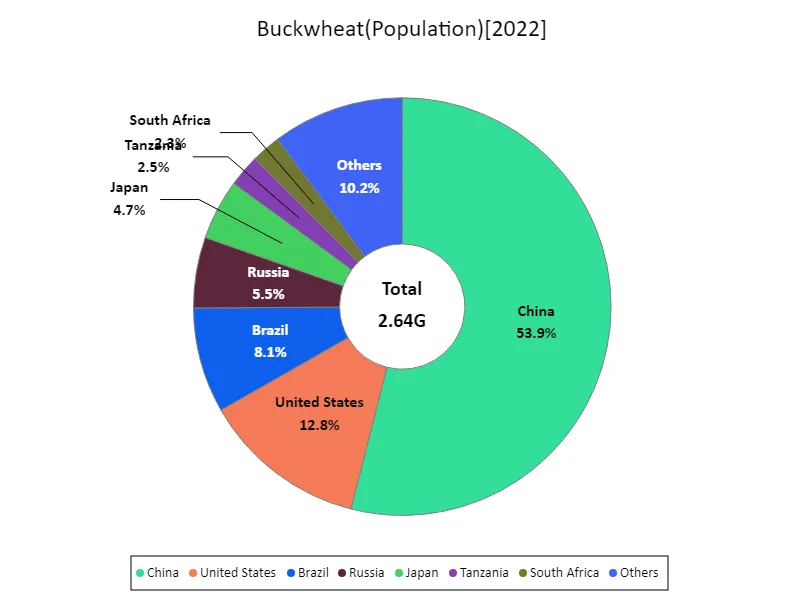
The maximum is 1.43G of China, the average is 126M, and the total is 2.64G
Buckwheat production (continent)
Analysis of buckwheat production data from 1961 to 2022 reveals some interesting features and trends. The peak production in Asia was recorded in 1992 at 3.37 Mt, and the rate of decline since then has been 19.5%. This indicates that buckwheat production in the Asian region has peaked and is now declining. Multiple factors are responsible for this decline. First, there is a change in the agricultural structure in the Asian region. As economies develop and urbanization progresses, the decline in agricultural labor force and urbanization of farmland may be affecting buckwheat production. Climate change and natural disasters are also affecting production. In particular, extreme weather and changes in long-term weather patterns due to climate change may threaten the environment suitable for buckwheat cultivation. In addition, consumption patterns may also be changing due to changes in the economy and demographics. Considering these factors, the decline in buckwheat production in the Asian region is multifaceted and requires the introduction of sustainable agricultural policies and technological innovations. It is expected that such efforts will help maintain buckwheat production in Asia at a sustainable level.
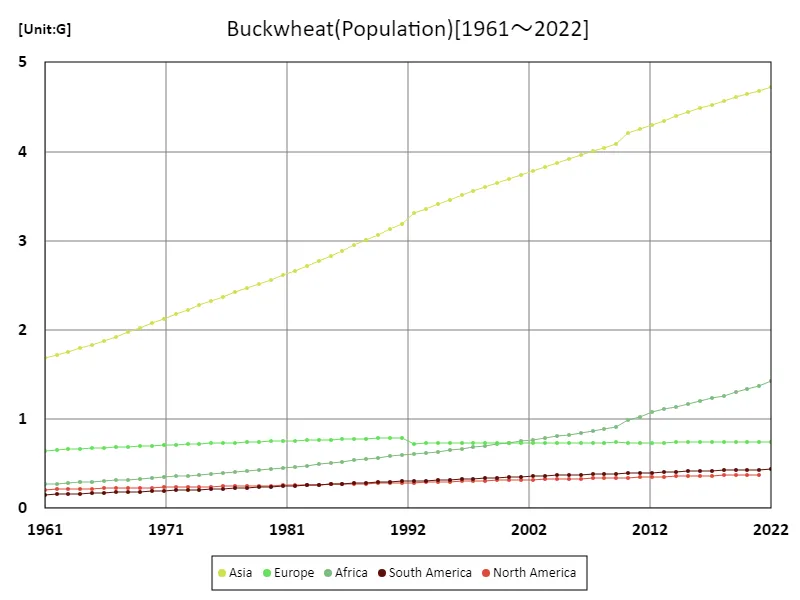
The maximum is the latest one, 4.72G of Asia
Buckwheat production (latest year, continent)
Looking at the world buckwheat production data for 2022, Europe has the largest overall production, recording 1.39 Mt. The average production is 447 kt, with a total of 2.24 Mt. This suggests that Europe is a major region in world buckwheat production. One of the reasons for the high buckwheat production in Europe is the presence of many climatic conditions and soils suitable for buckwheat cultivation. Advances in agricultural technology and sustainable agricultural efforts may also contribute to buckwheat production in Europe. On the other hand, the fact that Europe’s production stands out compared to other regions suggests that buckwheat occupies an important position in European food culture. It is also possible that the demand for buckwheat is stable. Therefore, Europe is actively working on buckwheat cultivation and production, which may support the high production. However, the effects of environmental changes and economic factors should also be taken into account, and the promotion of sustainable agriculture will become increasingly important in the future.
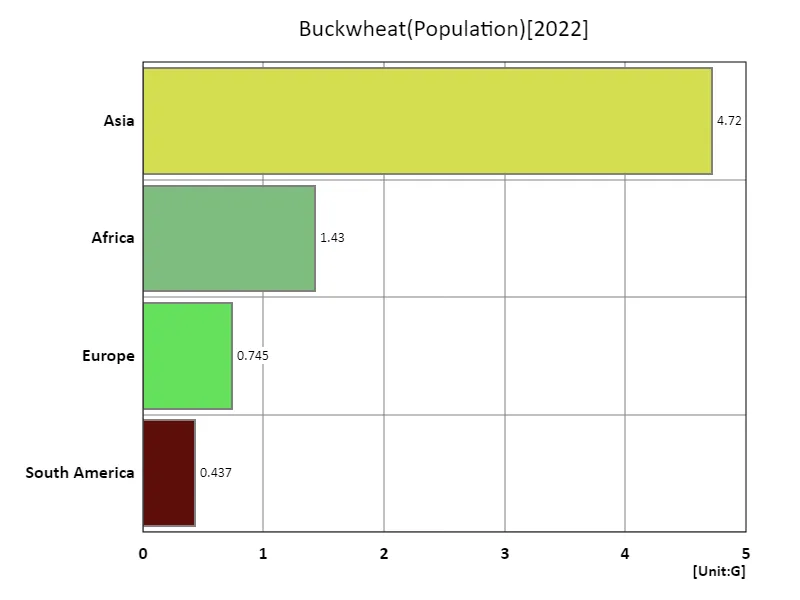
The maximum is 4.72G of Asia, the average is 1.83G, and the total is 7.33G
Main data
| Others(Buckwheat, Population) [G] | ||||||||||
|---|---|---|---|---|---|---|---|---|---|---|
| World | Asia | Lower-middle-income countries | Upper-middle-income countries | Africa | China | High-income countries | Europe | North America | South America | |
| 2022 | 7.98 | 4.72 | 3.45 | 2.56 | 1.43 | 1.43 | 1.22 | 0.74 | 0.6 | 0.44 |
| 2021 | 7.91 | 4.68 | 3.41 | 2.55 | 1.37 | 1.46 | 1.22 | 0.74 | 0.6 | 0.43 |
| 2020 | 7.84 | 4.65 | 3.37 | 2.54 | 1.34 | 1.46 | 1.22 | 0.74 | 0.59 | 0.43 |
| 2019 | 7.76 | 4.61 | 3.33 | 2.53 | 1.3 | 1.45 | 1.21 | 0.74 | 0.59 | 0.43 |
| 2018 | 7.68 | 4.57 | 3.28 | 2.52 | 1.26 | 1.45 | 1.21 | 0.74 | 0.59 | 0.42 |
| 2017 | 7.6 | 4.53 | 3.24 | 2.5 | 1.23 | 1.44 | 1.2 | 0.74 | 0.58 | 0.42 |
| 2016 | 7.51 | 4.48 | 3.19 | 2.48 | 1.2 | 1.43 | 1.2 | 0.74 | 0.58 | 0.42 |
| 2015 | 7.43 | 4.44 | 3.14 | 2.46 | 1.17 | 1.43 | 1.19 | 0.74 | 0.57 | 0.41 |
| 2014 | 7.34 | 4.39 | 3.1 | 2.44 | 1.14 | 1.42 | 1.18 | 0.74 | 0.57 | 0.41 |
| 2013 | 7.25 | 4.35 | 3.05 | 2.42 | 1.11 | 1.41 | 1.18 | 0.74 | 0.56 | 0.4 |
| 2012 | 7.16 | 4.3 | 3.01 | 2.4 | 1.08 | 1.4 | 1.17 | 0.74 | 0.55 | 0.4 |
| 2011 | 7.07 | 4.25 | 2.96 | 2.38 | 1.02 | 1.39 | 1.16 | 0.73 | 0.55 | 0.4 |
| 2010 | 6.99 | 4.2 | 2.91 | 2.36 | 0.99 | 1.38 | 1.15 | 0.73 | 0.54 | 0.39 |
| 2009 | 6.9 | 4.09 | 2.87 | 2.35 | 0.91 | 1.38 | 1.15 | 0.74 | 0.54 | 0.39 |
| 2008 | 6.81 | 4.04 | 2.82 | 2.33 | 0.89 | 1.37 | 1.14 | 0.74 | 0.53 | 0.39 |
| 2007 | 6.73 | 4 | 2.78 | 2.31 | 0.87 | 1.36 | 1.13 | 0.74 | 0.53 | 0.38 |
| 2006 | 6.64 | 3.96 | 2.74 | 2.29 | 0.85 | 1.36 | 1.12 | 0.73 | 0.52 | 0.38 |
| 2005 | 6.56 | 3.91 | 2.69 | 2.28 | 0.83 | 1.35 | 1.11 | 0.73 | 0.51 | 0.37 |
| 2004 | 6.48 | 3.87 | 2.65 | 2.26 | 0.81 | 1.34 | 1.1 | 0.73 | 0.51 | 0.37 |
| 2003 | 6.39 | 3.83 | 2.6 | 2.24 | 0.79 | 1.33 | 1.09 | 0.73 | 0.5 | 0.36 |
| 2002 | 6.31 | 3.78 | 2.56 | 2.23 | 0.77 | 1.32 | 1.09 | 0.73 | 0.5 | 0.36 |
| 2001 | 6.23 | 3.74 | 2.51 | 2.21 | 0.75 | 1.32 | 1.08 | 0.73 | 0.49 | 0.35 |
| 2000 | 6.15 | 3.69 | 2.47 | 2.19 | 0.74 | 1.31 | 1.07 | 0.73 | 0.49 | 0.35 |
| 1999 | 6.07 | 3.65 | 2.42 | 2.17 | 0.72 | 1.3 | 1.07 | 0.73 | 0.48 | 0.34 |
| 1998 | 5.99 | 3.6 | 2.38 | 2.16 | 0.7 | 1.29 | 1.06 | 0.73 | 0.47 | 0.34 |
| 1997 | 5.91 | 3.56 | 2.33 | 2.14 | 0.68 | 1.29 | 1.05 | 0.73 | 0.47 | 0.33 |
| 1996 | 5.83 | 3.51 | 2.29 | 2.12 | 0.67 | 1.28 | 1.05 | 0.73 | 0.46 | 0.33 |
| 1995 | 5.74 | 3.46 | 2.24 | 2.1 | 0.65 | 1.27 | 1.04 | 0.73 | 0.45 | 0.32 |
| 1994 | 5.66 | 3.41 | 2.2 | 2.08 | 0.64 | 1.25 | 1.03 | 0.73 | 0.45 | 0.32 |
| 1993 | 5.58 | 3.36 | 2.15 | 2.05 | 0.62 | 1.24 | 1.02 | 0.73 | 0.44 | 0.31 |
| 1992 | 5.49 | 3.31 | 2.11 | 2.03 | 0.61 | 1.23 | 1.02 | 0.73 | 0.43 | 0.31 |
| 1991 | 5.41 | 3.18 | 2.07 | 2.01 | 0.6 | 1.21 | 1.01 | 0.79 | 0.43 | 0.3 |
| 1990 | 5.32 | 3.13 | 2.02 | 1.98 | 0.58 | 1.19 | 1 | 0.79 | 0.42 | 0.3 |
| 1989 | 5.22 | 3.07 | 1.98 | 1.95 | 0.57 | 1.17 | 0.99 | 0.79 | 0.42 | 0.29 |
| 1988 | 5.13 | 3.01 | 1.93 | 1.92 | 0.55 | 1.15 | 0.99 | 0.78 | 0.41 | 0.28 |
| 1987 | 5.04 | 2.95 | 1.89 | 1.88 | 0.54 | 1.13 | 0.98 | 0.78 | 0.4 | 0.28 |
| 1986 | 4.95 | 2.89 | 1.84 | 1.85 | 0.52 | 1.11 | 0.97 | 0.77 | 0.4 | 0.27 |
| 1985 | 4.86 | 2.83 | 1.8 | 1.82 | 0.51 | 1.09 | 0.96 | 0.77 | 0.39 | 0.27 |
| 1984 | 4.78 | 2.77 | 1.76 | 1.79 | 0.49 | 1.07 | 0.96 | 0.77 | 0.39 | 0.26 |
| 1983 | 4.69 | 2.72 | 1.72 | 1.76 | 0.48 | 1.05 | 0.95 | 0.76 | 0.38 | 0.26 |
| 1982 | 4.61 | 2.67 | 1.67 | 1.73 | 0.47 | 1.04 | 0.94 | 0.76 | 0.38 | 0.25 |
| 1981 | 4.52 | 2.61 | 1.63 | 1.71 | 0.45 | 1.02 | 0.94 | 0.75 | 0.37 | 0.25 |
| 1980 | 4.44 | 2.56 | 1.59 | 1.68 | 0.44 | 1.01 | 0.93 | 0.75 | 0.37 | 0.24 |
| 1979 | 4.37 | 2.51 | 1.55 | 1.65 | 0.43 | 0.99 | 0.92 | 0.75 | 0.36 | 0.24 |
| 1978 | 4.29 | 2.47 | 1.51 | 1.63 | 0.42 | 0.98 | 0.91 | 0.74 | 0.36 | 0.23 |
| 1977 | 4.22 | 2.42 | 1.48 | 1.6 | 0.41 | 0.97 | 0.9 | 0.74 | 0.35 | 0.23 |
| 1976 | 4.14 | 2.37 | 1.44 | 1.58 | 0.4 | 0.95 | 0.9 | 0.73 | 0.35 | 0.22 |
| 1975 | 4.07 | 2.32 | 1.41 | 1.55 | 0.39 | 0.93 | 0.89 | 0.73 | 0.34 | 0.22 |
| 1974 | 4 | 2.27 | 1.38 | 1.52 | 0.38 | 0.92 | 0.88 | 0.72 | 0.34 | 0.21 |
| 1973 | 3.92 | 2.22 | 1.35 | 1.49 | 0.37 | 0.9 | 0.87 | 0.72 | 0.33 | 0.21 |
| 1972 | 3.84 | 2.17 | 1.32 | 1.46 | 0.36 | 0.88 | 0.87 | 0.71 | 0.33 | 0.2 |
| 1971 | 3.77 | 2.12 | 1.29 | 1.43 | 0.35 | 0.85 | 0.86 | 0.71 | 0.32 | 0.2 |
| 1970 | 3.7 | 2.07 | 1.26 | 1.4 | 0.34 | 0.83 | 0.85 | 0.7 | 0.32 | 0.19 |
| 1969 | 3.62 | 2.02 | 1.23 | 1.37 | 0.33 | 0.81 | 0.84 | 0.7 | 0.31 | 0.19 |
| 1968 | 3.55 | 1.97 | 1.2 | 1.34 | 0.32 | 0.79 | 0.83 | 0.69 | 0.31 | 0.18 |
| 1967 | 3.48 | 1.92 | 1.17 | 1.31 | 0.31 | 0.77 | 0.82 | 0.69 | 0.3 | 0.18 |
| 1966 | 3.41 | 1.88 | 1.14 | 1.28 | 0.31 | 0.75 | 0.81 | 0.68 | 0.3 | 0.17 |
| 1965 | 3.34 | 1.83 | 1.12 | 1.25 | 0.3 | 0.73 | 0.8 | 0.68 | 0.29 | 0.17 |
| 1964 | 3.27 | 1.79 | 1.09 | 1.22 | 0.29 | 0.71 | 0.79 | 0.67 | 0.29 | 0.16 |
| 1963 | 3.2 | 1.75 | 1.07 | 1.18 | 0.28 | 0.7 | 0.78 | 0.66 | 0.28 | 0.16 |
| 1962 | 3.13 | 1.72 | 1.04 | 1.15 | 0.28 | 0.69 | 0.78 | 0.65 | 0.28 | 0.16 |
| 1961 | 3.07 | 1.69 | 1.02 | 1.13 | 0.27 | 0.68 | 0.77 | 0.65 | 0.27 | 0.15 |

Comments