Abstract
Pineapple production has seen steady growth globally, with tropical countries dominating output due to favorable climates. Historically, the Philippines, Thailand, and Costa Rica led the market, but recent years have seen Indonesia emerge as a major producer, surpassing others with 3.2 million tonnes in 2022. This shift highlights Indonesia’s focus on enhancing agricultural output through improved farming practices and export-oriented strategies. Pineapples are prized for their versatility and nutritional value, with fresh fruit and processed goods in high demand. The industry’s expansion reflects growing global consumption and advancements in supply chain efficiency, enabling tropical nations to meet international demand effectively.
Pineapple production (worldwide)
Pineapple production from 1961 to 2022 reveals dynamic shifts, with Thailand peaking in 1980 at 3.69 million tonnes, the highest on record. Since then, Thailand’s production has declined to 46.5% of its peak, reflecting changing agricultural priorities, land use, and market conditions. Global production, however, has steadily increased, driven by rising demand for fresh and processed pineapples. Emerging producers like Indonesia have gained prominence, leveraging tropical climates and enhanced farming practices. The data highlights the evolving balance between traditional and emerging players, shaped by global trade trends, consumer preferences, and agricultural innovations.
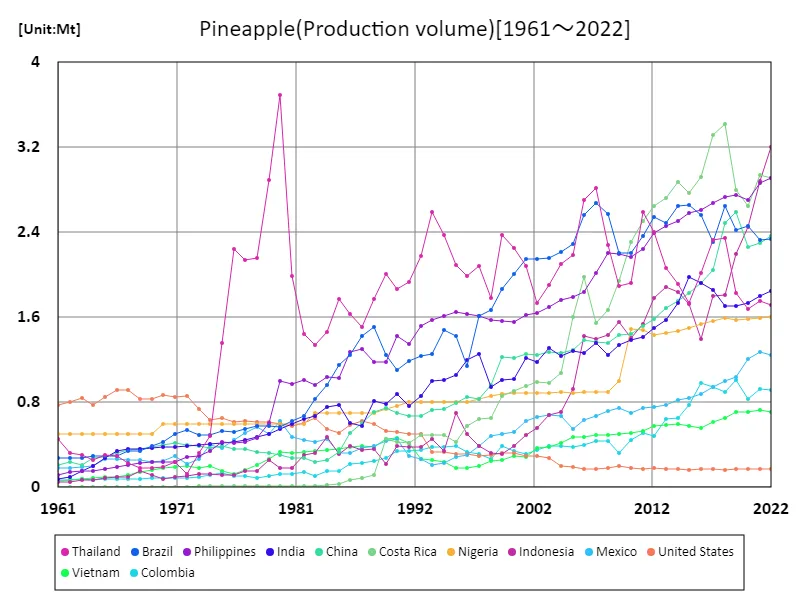
The maximum is 3.69Mt[1980] of Thailand, and the current value is about 46.5%
Pineapple production (latest year, world)
In 2022, global pineapple production reached 29.4 million tonnes, with Indonesia leading at 3.2 million tonnes, far exceeding the global average of 338,000 tonnes. This highlights the dominance of a few major producers in tropical regions with ideal growing conditions. Pineapple production has grown steadily, driven by global demand for fresh and processed fruit. While countries like Thailand, once leaders, have seen declines, others like Indonesia have surged due to enhanced agricultural practices and export-focused strategies. The data underscores the increasing specialization and market-oriented nature of pineapple cultivation in world agriculture.
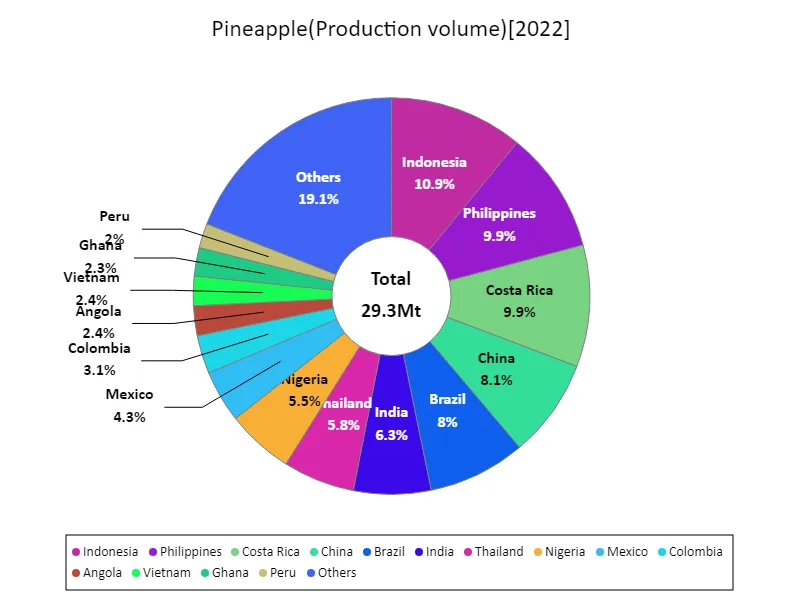
The maximum is 3.2Mt of Indonesia, the average is 341kt, and the total is 29.3Mt
Pineapple production (continent)
In 2022, Asia led global pineapple production with 13.4 million tonnes, reflecting the region’s favorable tropical climate, large agricultural base, and export-oriented economies. Asia’s dominance highlights its pivotal role in meeting global demand for fresh and processed pineapples. Over time, production has shifted within the region, with countries like Indonesia emerging as top producers, while others, like Thailand, have seen declines from historical peaks. This trend illustrates evolving agricultural priorities, technological advancements, and competitive global trade dynamics, cementing Asia’s central position in pineapple cultivation.
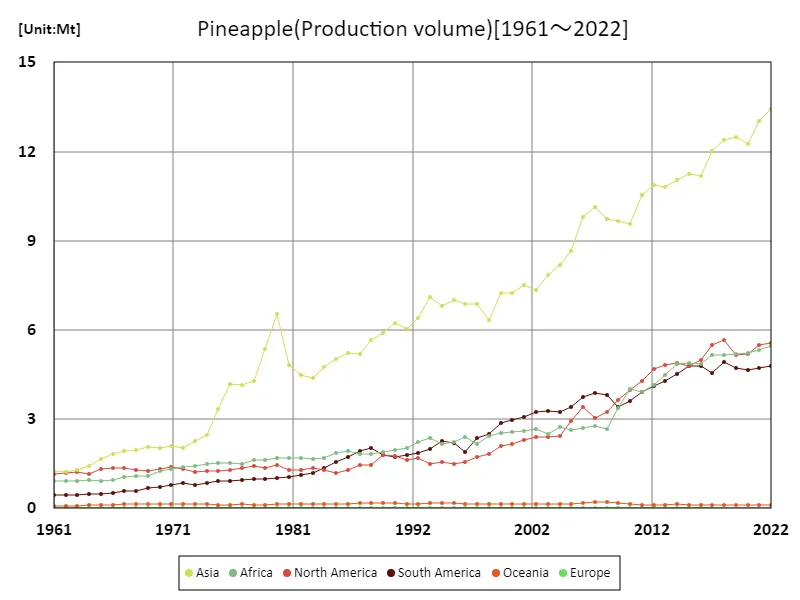
The maximum is the latest one, 13.4Mt of Asia
Pineapple production (latest year, continent)
In 2022, global pineapple production totaled 29.4 million tonnes, with Asia contributing the largest share at 13.4 million tonnes, significantly above the regional average of 5.87 million tonnes. This underscores Asia’s dominance in pineapple cultivation, driven by tropical climates, diverse producers, and strong export markets. While traditional leaders like Thailand have experienced declines, emerging producers like Indonesia are gaining prominence. Globally, rising demand for fresh and processed pineapples has spurred steady growth, supported by improved farming practices and international trade networks, highlighting the crop’s significance in global agriculture.
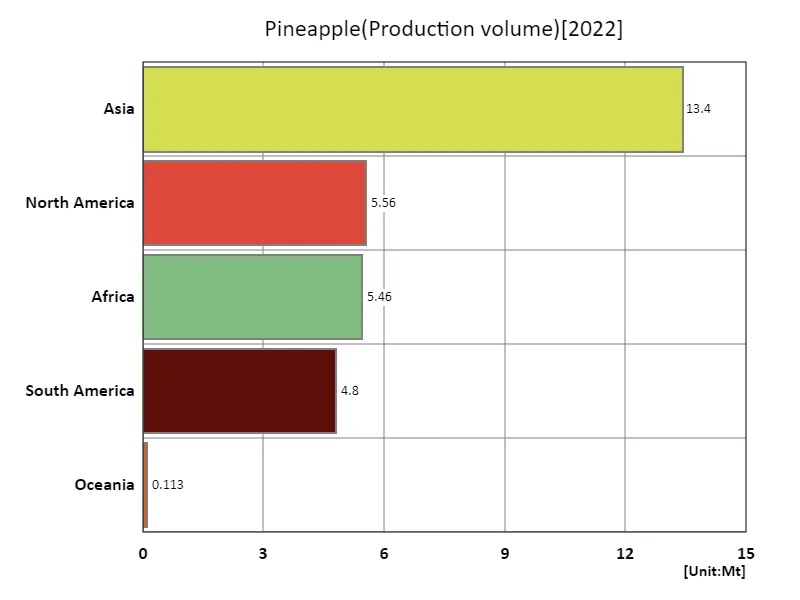
The maximum is 13.4Mt of Asia, the average is 5.87Mt, and the total is 29.4Mt
Main data
| Production(Pineapple, Production volume, t) [Mt] | ||||||||||
|---|---|---|---|---|---|---|---|---|---|---|
| World | Upper-middle-income countries | Asia | Lower-middle-income countries | Americas | South-eastern Asia | North America | Africa | Net Food Importing Developing Countries | Central America | |
| 2022 | 29.36 | 17.07 | 13.43 | 10.72 | 10.36 | 8.93 | 5.56 | 5.46 | 4.85 | 4.8 |
| 2021 | 28.71 | 16.69 | 13.03 | 10.51 | 10.23 | 8.64 | 5.5 | 5.34 | 4.71 | 4.8 |
| 2020 | 27.45 | 15.7 | 12.25 | 10.21 | 9.84 | 7.95 | 5.18 | 5.24 | 4.63 | 4.49 |
| 2019 | 27.66 | 15.95 | 12.47 | 10.15 | 9.89 | 7.88 | 5.16 | 5.17 | 4.57 | 4.44 |
| 2018 | 28.29 | 16.72 | 12.39 | 10.03 | 10.6 | 7.92 | 5.68 | 5.17 | 4.45 | 5.01 |
| 2017 | 27.34 | 15.59 | 12.01 | 10.11 | 10.05 | 7.81 | 5.5 | 5.15 | 4.41 | 4.86 |
| 2016 | 25.93 | 14.55 | 11.17 | 9.88 | 9.78 | 7.05 | 5 | 4.87 | 4.18 | 4.37 |
| 2015 | 25.83 | 14.45 | 11.25 | 9.87 | 9.59 | 7.16 | 4.79 | 4.87 | 4.16 | 4.14 |
| 2014 | 25.43 | 14.39 | 11.04 | 9.57 | 9.39 | 7.27 | 4.87 | 4.86 | 4.2 | 4.18 |
| 2013 | 24.49 | 14.15 | 10.82 | 9.17 | 9.09 | 7.3 | 4.81 | 4.47 | 4.07 | 4.03 |
| 2012 | 23.96 | 14.08 | 10.89 | 8.69 | 8.81 | 7.54 | 4.69 | 4.14 | 3.71 | 3.95 |
| 2011 | 22.77 | 13.34 | 10.54 | 8.28 | 8.19 | 7.3 | 4.28 | 3.93 | 3.28 | 3.78 |
| 2010 | 21.3 | 11.84 | 9.55 | 8.23 | 7.59 | 6.41 | 3.99 | 4.01 | 3.24 | 3.54 |
| 2009 | 20.26 | 11.46 | 9.65 | 7.52 | 7.04 | 6.58 | 3.64 | 3.37 | 3 | 3.2 |
| 2008 | 19.67 | 11.72 | 9.74 | 6.69 | 7.04 | 6.86 | 3.24 | 2.68 | 2.7 | 2.86 |
| 2007 | 20.04 | 12.06 | 10.14 | 6.72 | 6.94 | 7.1 | 3.05 | 2.76 | 2.78 | 2.69 |
| 2006 | 19.83 | 12.18 | 9.79 | 6.39 | 7.15 | 6.81 | 3.4 | 2.7 | 2.73 | 3.06 |
| 2005 | 17.78 | 10.36 | 8.65 | 6.27 | 6.36 | 5.77 | 2.95 | 2.63 | 2.58 | 2.6 |
| 2004 | 16.73 | 9.35 | 8.17 | 6.21 | 5.68 | 5.38 | 2.43 | 2.74 | 2.69 | 2.03 |
| 2003 | 16.12 | 8.97 | 7.84 | 5.93 | 5.65 | 5.04 | 2.39 | 2.49 | 2.39 | 1.91 |
| 2002 | 15.78 | 8.67 | 7.33 | 5.89 | 5.63 | 4.68 | 2.4 | 2.68 | 2.56 | 1.89 |
| 2001 | 15.65 | 8.72 | 7.52 | 5.73 | 5.37 | 4.82 | 2.3 | 2.61 | 2.44 | 1.77 |
| 2000 | 15.11 | 8.48 | 7.24 | 5.41 | 5.14 | 4.79 | 2.15 | 2.57 | 2.34 | 1.67 |
| 1999 | 14.9 | 8.37 | 7.25 | 5.32 | 4.96 | 4.81 | 2.08 | 2.53 | 2.27 | 1.61 |
| 1998 | 13.21 | 6.91 | 6.34 | 5.15 | 4.3 | 4.22 | 1.82 | 2.42 | 2.11 | 1.38 |
| 1997 | 13.3 | 6.95 | 6.88 | 5.22 | 4.1 | 4.57 | 1.73 | 2.17 | 1.87 | 1.28 |
| 1996 | 12.87 | 6.35 | 6.88 | 5.4 | 3.44 | 4.59 | 1.55 | 2.39 | 2.08 | 1.11 |
| 1995 | 13.07 | 6.82 | 7 | 5.11 | 3.68 | 4.89 | 1.47 | 2.23 | 2 | 0.96 |
| 1994 | 12.95 | 6.71 | 6.81 | 4.97 | 3.8 | 4.82 | 1.54 | 2.16 | 2.02 | 0.97 |
| 1993 | 13.12 | 6.72 | 7.1 | 5.1 | 3.48 | 5.13 | 1.5 | 2.37 | 2.07 | 0.96 |
| 1992 | 12.31 | 6.21 | 6.39 | 4.73 | 3.54 | 4.62 | 1.68 | 2.22 | 1.78 | 0.98 |
| 1991 | 11.62 | 5.79 | 6.04 | 4.47 | 3.4 | 4.36 | 1.61 | 2.04 | 1.6 | 0.94 |
| 1990 | 11.84 | 5.85 | 6.24 | 4.67 | 3.48 | 4.4 | 1.77 | 1.96 | 1.55 | 1.08 |
| 1989 | 11.56 | 6.05 | 5.9 | 4.21 | 3.58 | 4.13 | 1.78 | 1.9 | 1.44 | 1.09 |
| 1988 | 11.15 | 5.71 | 5.67 | 4.07 | 3.49 | 3.92 | 1.47 | 1.81 | 1.36 | 0.7 |
| 1987 | 10.55 | 5.2 | 5.18 | 4.01 | 3.37 | 3.77 | 1.46 | 1.83 | 1.41 | 0.65 |
| 1986 | 10.31 | 5.02 | 5.22 | 4.05 | 3.02 | 3.89 | 1.3 | 1.92 | 1.43 | 0.56 |
| 1985 | 9.75 | 4.71 | 5.01 | 3.88 | 2.73 | 3.7 | 1.17 | 1.86 | 1.37 | 0.51 |
| 1984 | 9.23 | 4.33 | 4.76 | 3.77 | 2.65 | 3.54 | 1.3 | 1.68 | 1.25 | 0.63 |
| 1983 | 8.7 | 3.91 | 4.38 | 3.56 | 2.54 | 3.2 | 1.36 | 1.64 | 1.19 | 0.58 |
| 1982 | 8.72 | 3.97 | 4.48 | 3.52 | 2.41 | 3.31 | 1.3 | 1.68 | 1.25 | 0.58 |
| 1981 | 9.02 | 4.3 | 4.82 | 3.49 | 2.35 | 3.7 | 1.3 | 1.71 | 1.31 | 0.61 |
| 1980 | 10.83 | 6.08 | 6.54 | 3.46 | 2.46 | 5.43 | 1.45 | 1.69 | 1.29 | 0.75 |
| 1979 | 9.48 | 5.23 | 5.37 | 2.95 | 2.35 | 4.25 | 1.35 | 1.63 | 1.3 | 0.64 |
| 1978 | 8.41 | 4.39 | 4.28 | 2.72 | 2.39 | 3.21 | 1.41 | 1.62 | 1.29 | 0.7 |
| 1977 | 8.08 | 4.27 | 4.16 | 2.45 | 2.3 | 3.11 | 1.36 | 1.5 | 1.16 | 0.64 |
| 1976 | 8.04 | 4.26 | 4.19 | 2.42 | 2.2 | 3.13 | 1.29 | 1.54 | 1.17 | 0.57 |
| 1975 | 7.19 | 3.33 | 3.36 | 2.34 | 2.19 | 2.3 | 1.26 | 1.51 | 1.11 | 0.49 |
| 1974 | 6.21 | 2.47 | 2.47 | 2.27 | 2.11 | 1.44 | 1.27 | 1.5 | 1.04 | 0.51 |
| 1973 | 5.82 | 2.09 | 2.25 | 2.14 | 2 | 1.22 | 1.23 | 1.43 | 0.99 | 0.38 |
| 1972 | 5.7 | 1.93 | 2.02 | 2.06 | 2.15 | 1.04 | 1.31 | 1.38 | 0.94 | 0.32 |
| 1971 | 5.7 | 2.04 | 2.1 | 1.94 | 2.15 | 1.1 | 1.37 | 1.32 | 0.86 | 0.4 |
| 1970 | 5.45 | 1.85 | 2.03 | 1.92 | 2.01 | 1.05 | 1.31 | 1.27 | 0.82 | 0.34 |
| 1969 | 5.24 | 1.79 | 2.05 | 1.75 | 1.96 | 1.06 | 1.27 | 1.09 | 0.8 | 0.33 |
| 1968 | 5.06 | 1.7 | 1.96 | 1.69 | 1.87 | 1.03 | 1.28 | 1.08 | 0.72 | 0.34 |
| 1967 | 5.02 | 1.7 | 1.92 | 1.63 | 1.93 | 0.99 | 1.35 | 1.05 | 0.66 | 0.34 |
| 1966 | 4.76 | 1.65 | 1.82 | 1.5 | 1.89 | 0.98 | 1.36 | 0.95 | 0.56 | 0.34 |
| 1965 | 4.48 | 1.61 | 1.66 | 1.39 | 1.8 | 0.96 | 1.31 | 0.92 | 0.51 | 0.34 |
| 1964 | 4.13 | 1.49 | 1.44 | 1.28 | 1.65 | 0.84 | 1.17 | 0.95 | 0.51 | 0.27 |
| 1963 | 4 | 1.47 | 1.3 | 1.18 | 1.69 | 0.84 | 1.23 | 0.92 | 0.5 | 0.26 |
| 1962 | 3.85 | 1.45 | 1.23 | 1.08 | 1.63 | 0.82 | 1.17 | 0.91 | 0.46 | 0.24 |
| 1961 | 3.83 | 1.57 | 1.24 | 0.99 | 1.58 | 0.88 | 1.14 | 0.92 | 0.43 | 0.24 |


Comments