
Abstract
Watermelon is a globally important agricultural crop, and its production is carried out in many countries. China is the largest producer, producing 60.5 Mt in 2022. This accounts for about half of the world’s total watermelon production. China’s vast land area and abundant water sources allow for large-scale cultivation of watermelons. Technological advances and agricultural policy support have also contributed to the increase in production in China. Other major producers include Turkey, Iran, Brazil, and Egypt. These countries also produce watermelons taking advantage of their respective climatic conditions and agricultural techniques. Watermelons are mainly grown in temperate regions, as they require a hot climate and sufficient water supply. Furthermore, global watermelon production is increasing sustainably due to increasing demand and the introduction of new production techniques. This gives watermelon an important position in the global agricultural market.
Watermelon production (Worldwide)
Watermelon production has seen remarkable growth over the past few decades. China’s production has been particularly notable, reaching a record 63.4 Mt in 2017. However, it has recently declined to about 95.6% of its peak. This decline is likely due to multiple factors. First of all, improvements in agricultural technology and productivity may be leading to a greater variety of produce being grown on Chinese farmland. Environmental changes and water resource constraints may also be contributing factors. In addition, changes in domestic and international demand and economic fluctuations are also affecting production. On the other hand, watermelon production has tended to increase in regions outside of China. This may be due to other countries making efforts to meet the demand for watermelon. Globally, watermelon production has been stable and is in line with the increase in demand. However, various factors are influencing individual countries and regions, and adjusting these appropriately will be the key to future watermelon production.
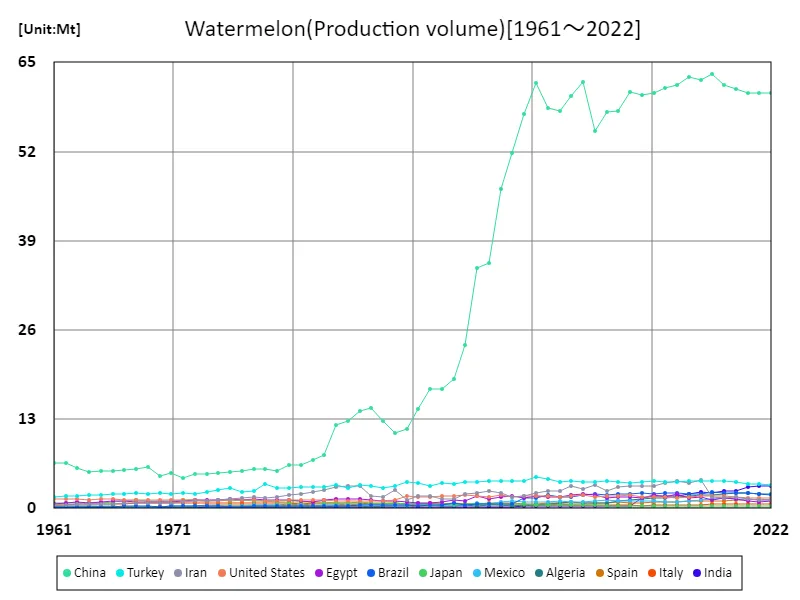
The maximum is 63.4Mt[2017] of China, and the current value is about 95.6%
Watermelon production (latest year, countries around the world)
Watermelon production is of global importance, and data for 2022 shows that China is the largest producer. China’s production reached 60.5Mt, which is about 60% of the global total. The average production was 740kt, which indicates a relatively stable level of global watermelon production. Overall watermelon production reached a total of 100Mt. This figure shows that watermelon is grown in a wide area, with many countries contributing to production. Watermelon production requires a suitable climate and water supply, which influences the selection of production sites. In addition, increasing demand and technological innovations also affect changes in production volume. In recent years, the demand for watermelon has increased, especially in the Asian region, and China’s production volume has become a key factor in meeting that demand. In addition, sustainable agricultural practices and improved production efficiency will be key challenges in future watermelon production.
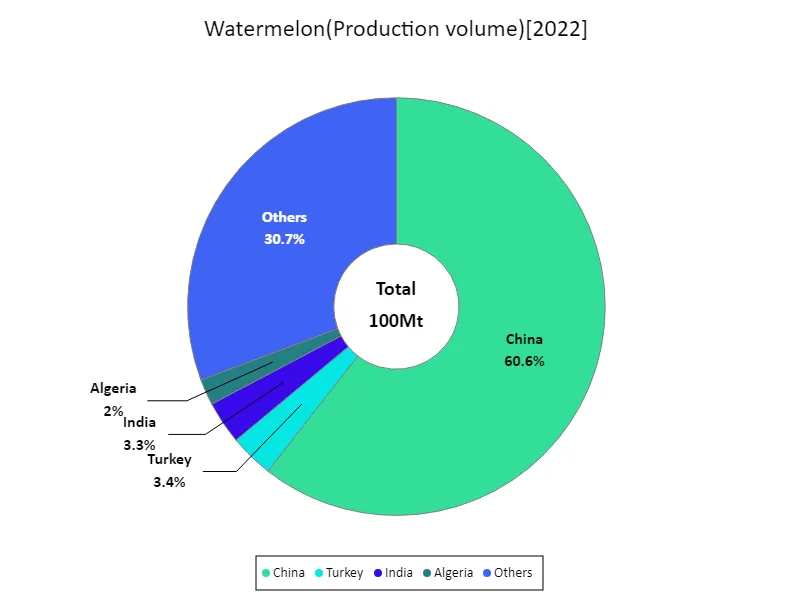
The maximum is 60.5Mt of China, the average is 740kt, and the total is 100Mt
Watermelon production (continent)
Asia was the largest producer of watermelon in the entire world in the latest year, 2022. This record figure shows that Asia is the main producer of watermelons. The climatic conditions and agricultural techniques in Asia, which are suitable for growing watermelons, contribute to this achievement. In addition, the increase in food demand due to the growth of the population in the Asian region may also affect watermelon production. While there are fluctuations in watermelon production in other regions, Asia tends to remain at the top. In addition, as the importance of sustainable agriculture increases, watermelon cultivation methods and production processes are required to be environmentally friendly and use resources efficiently. Against this background, watermelon production is expanding, mainly in the Asian region, and contributing to the world’s food supply. Watermelon production is expected to continue to progress further in the future in response to increasing demand and changes in the environment.
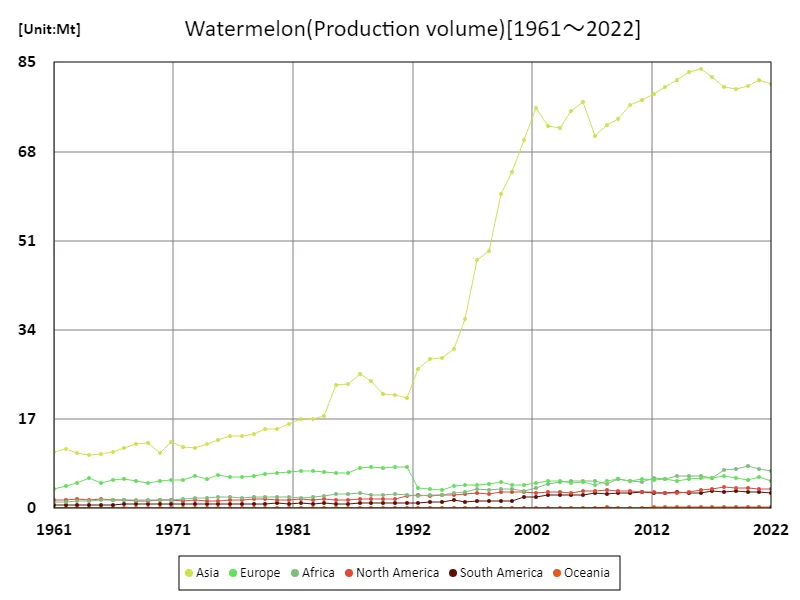
The maximum is 83.8Mt[2016] of Asia, and the current value is about 96.4%
Watermelon production (latest year, continent)
Watermelon production is important globally, and 2022 data reveals that Asia is the largest producing region. Asia’s production will reach 80.8Mt, which is about 80% of the world total. This figure reflects that Asia has suitable climatic conditions and agricultural techniques for growing watermelons. The average production is 16.7Mt, which is enough to meet the demand for watermelons. Overall watermelon production reached a total of 100Mt, but production varies from region to region. Watermelons are also grown in regions outside Asia, but their production is relatively small. Watermelon requires a warm climate and abundant water, so the selection of production sites is an important factor. Watermelon production is likely to continue to expand with increasing demand and economic growth. However, the importance of sustainable agricultural practices is also increasing, and farmers will need to address environmental concerns and efficient use of resources. Taking these factors into account, global watermelon production is expected to continue to grow steadily.
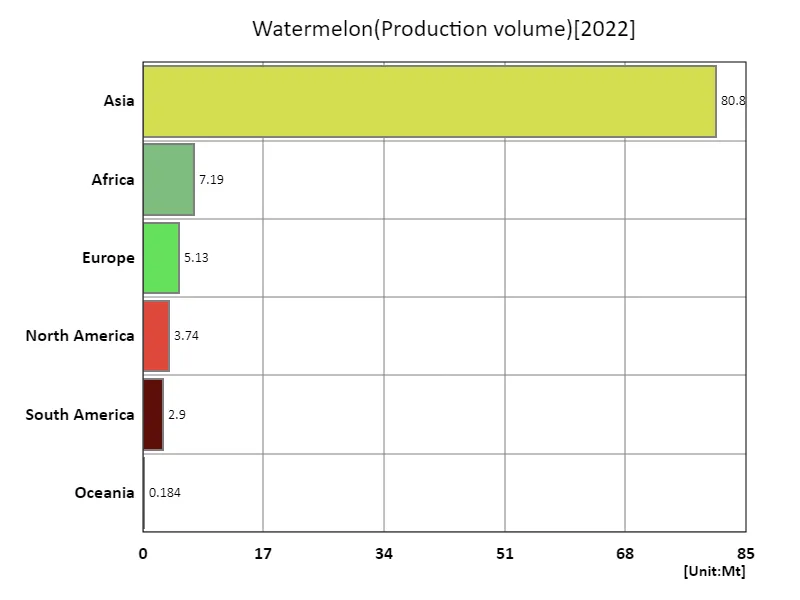
The maximum is 80.8Mt of Asia, the average is 16.7Mt, and the total is 100Mt
Main data
| Production(Watermelon, Production volume, t) [Mt] | ||||||||||
|---|---|---|---|---|---|---|---|---|---|---|
| World | Asia | Upper-middle-income countries | Eastern Asia | China | Lower-middle-income countries | Net Food Importing Developing Countries | Africa | Southern Asia | Land Locked Developing Countries | |
| 2022 | 99.96 | 80.81 | 74.85 | 61.41 | 60.54 | 16.6 | 8.83 | 7.19 | 7 | 6.88 |
| 2021 | 102.17 | 81.6 | 75.37 | 61.49 | 60.59 | 17.66 | 9.72 | 7.57 | 7.76 | 6.63 |
| 2020 | 100.98 | 80.39 | 75.16 | 61.4 | 60.53 | 16.99 | 8.6 | 7.97 | 6.57 | 6.75 |
| 2019 | 100.8 | 79.97 | 76.34 | 61.93 | 61.04 | 15.65 | 7.7 | 7.56 | 5.54 | 6.34 |
| 2018 | 101.01 | 80.23 | 76.86 | 62.65 | 61.76 | 15.74 | 6.87 | 7.24 | 4.86 | 6.03 |
| 2017 | 100.94 | 82.28 | 78.21 | 64.29 | 63.36 | 14.17 | 5.65 | 5.71 | 5.22 | 6.66 |
| 2016 | 102.39 | 83.79 | 76.63 | 63.42 | 62.41 | 17.06 | 6.18 | 6.14 | 7.82 | 6.91 |
| 2015 | 101 | 83.1 | 76.7 | 63.96 | 62.89 | 16.51 | 5.66 | 6.07 | 6.72 | 5.95 |
| 2014 | 99.22 | 81.68 | 75.29 | 62.84 | 61.7 | 16.39 | 5.98 | 6.15 | 6.66 | 5.28 |
| 2013 | 97.55 | 80.26 | 74.46 | 62.34 | 61.22 | 15.17 | 5.38 | 5.6 | 6.21 | 5.04 |
| 2012 | 96.19 | 78.98 | 73.85 | 61.64 | 60.53 | 14.34 | 5.28 | 5.71 | 5.5 | 4.67 |
| 2011 | 94.58 | 77.79 | 73.79 | 61.31 | 60.25 | 12.7 | 4.91 | 5 | 5.23 | 4.51 |
| 2010 | 93.52 | 76.8 | 73.48 | 61.89 | 60.74 | 11.53 | 5.16 | 5.17 | 4.26 | 4.51 |
| 2009 | 91.51 | 74.1 | 71.1 | 59.28 | 57.93 | 11.11 | 5.82 | 5.64 | 4.1 | 4.38 |
| 2008 | 89.26 | 73.03 | 71.17 | 59.08 | 57.71 | 9.92 | 5.06 | 4.69 | 3.53 | 3.52 |
| 2007 | 86.71 | 70.99 | 67.8 | 56.24 | 54.97 | 10.61 | 5.45 | 5.13 | 4.24 | 3.49 |
| 2006 | 93.65 | 77.4 | 74.88 | 63.38 | 62.08 | 10.32 | 5.38 | 5.13 | 3.77 | 3.1 |
| 2005 | 91.18 | 75.66 | 72.18 | 61.57 | 60.11 | 10.08 | 5.29 | 5.13 | 4.06 | 2.91 |
| 2004 | 88.21 | 72.43 | 69.62 | 59.21 | 57.83 | 9.23 | 5.16 | 4.95 | 3.29 | 2.76 |
| 2003 | 88.57 | 72.94 | 70.58 | 59.71 | 58.34 | 9.11 | 4.87 | 4.69 | 3.28 | 2.83 |
| 2002 | 90.45 | 76.32 | 73.94 | 63.52 | 62.04 | 8.04 | 4.31 | 3.92 | 2.98 | 2.6 |
| 2001 | 83.46 | 70.26 | 68.52 | 59.14 | 57.51 | 6.76 | 3.65 | 3.39 | 2.57 | 2.36 |
| 2000 | 76.68 | 64.13 | 61.93 | 53.43 | 51.82 | 6.74 | 3.94 | 3.6 | 2.46 | 2.24 |
| 1999 | 73.24 | 59.86 | 56.77 | 48.19 | 46.55 | 7.9 | 4.2 | 3.76 | 3.06 | 2.27 |
| 1998 | 61.28 | 49.06 | 45.1 | 37.31 | 35.8 | 7.69 | 4.01 | 3.47 | 3.33 | 1.94 |
| 1997 | 59.83 | 47.37 | 43.81 | 36.72 | 35 | 7.57 | 4.26 | 3.7 | 3.03 | 1.56 |
| 1996 | 47.64 | 36.02 | 32.37 | 25.42 | 23.82 | 6.9 | 3.53 | 3.07 | 2.86 | 1.73 |
| 1995 | 41.63 | 30.35 | 27.4 | 20.66 | 18.83 | 6.2 | 3.41 | 2.94 | 2.16 | 1.67 |
| 1994 | 38.4 | 28.61 | 25.44 | 19.02 | 17.4 | 5.56 | 3.09 | 2.62 | 2.05 | 1.72 |
| 1993 | 38.25 | 28.54 | 24.94 | 18.95 | 17.35 | 5.95 | 2.77 | 2.46 | 2.48 | 1.81 |
| 1992 | 36.3 | 26.54 | 22.72 | 16.22 | 14.54 | 6.13 | 2.63 | 2.39 | 2.44 | 2.17 |
| 1991 | 35.08 | 21.04 | 23.56 | 13.06 | 11.55 | 4.25 | 2.88 | 2.61 | 1.9 | 0.44 |
| 1990 | 34.87 | 21.55 | 22.51 | 12.4 | 10.96 | 5.79 | 3.15 | 2.64 | 3.37 | 0.42 |
| 1989 | 34.96 | 21.8 | 24.18 | 14.14 | 12.73 | 4.56 | 2.96 | 2.51 | 2.29 | 0.39 |
| 1988 | 37.56 | 24.27 | 26.13 | 16 | 14.58 | 4.68 | 3.02 | 2.53 | 2.38 | 0.39 |
| 1987 | 38.95 | 25.54 | 25.5 | 15.57 | 14.16 | 6.5 | 3.22 | 2.89 | 3.83 | 0.38 |
| 1986 | 35.61 | 23.67 | 22.47 | 14.16 | 12.75 | 6.31 | 3.01 | 2.69 | 3.85 | 0.42 |
| 1985 | 35.3 | 23.41 | 22.54 | 13.55 | 12.18 | 5.96 | 2.9 | 2.66 | 3.56 | 0.42 |
| 1984 | 29.57 | 17.61 | 18 | 9.17 | 7.84 | 5.22 | 2.65 | 2.35 | 3.18 | 0.41 |
| 1983 | 28.84 | 16.99 | 17.37 | 8.26 | 7.02 | 4.63 | 2.36 | 2.06 | 2.86 | 0.4 |
| 1982 | 28.75 | 16.93 | 17.15 | 7.63 | 6.27 | 4.54 | 2.33 | 2.05 | 2.58 | 0.39 |
| 1981 | 27.72 | 16.03 | 16.4 | 7.61 | 6.29 | 4.39 | 2.41 | 2.19 | 2.37 | 0.36 |
| 1980 | 26.41 | 15.04 | 15.42 | 6.84 | 5.47 | 4.12 | 2.34 | 2.11 | 2.17 | 0.34 |
| 1979 | 26.44 | 15.03 | 15.85 | 7.13 | 5.69 | 4.08 | 2.39 | 2.14 | 1.98 | 0.32 |
| 1978 | 25.15 | 14.18 | 14.72 | 7.11 | 5.72 | 4.07 | 2.41 | 2.17 | 2.06 | 0.31 |
| 1977 | 24.24 | 13.7 | 13.9 | 6.82 | 5.43 | 3.72 | 2.23 | 2.02 | 1.87 | 0.29 |
| 1976 | 24.39 | 13.75 | 14.27 | 6.61 | 5.23 | 3.7 | 2.48 | 2.22 | 1.78 | 0.34 |
| 1975 | 23.77 | 13.04 | 13.71 | 6.52 | 5.19 | 3.63 | 2.28 | 2.17 | 1.68 | 0.3 |
| 1974 | 21.99 | 12.17 | 13.07 | 6.27 | 4.99 | 3.42 | 2.28 | 2.03 | 1.58 | 0.29 |
| 1973 | 21.93 | 11.48 | 13.24 | 6.42 | 5.03 | 3.18 | 2.15 | 1.89 | 1.47 | 0.28 |
| 1972 | 21.12 | 11.68 | 12.23 | 5.81 | 4.49 | 2.92 | 1.98 | 1.72 | 1.32 | 0.27 |
| 1971 | 22.15 | 12.72 | 12.85 | 6.44 | 5.15 | 2.65 | 1.8 | 1.58 | 1.25 | 0.27 |
| 1970 | 19.58 | 10.61 | 11.84 | 5.78 | 4.64 | 2.6 | 1.79 | 1.59 | 1.16 | 0.26 |
| 1969 | 21.11 | 12.41 | 13.44 | 7.19 | 6.03 | 2.57 | 1.8 | 1.56 | 1.14 | 0.25 |
| 1968 | 21.26 | 12.22 | 13.41 | 7.13 | 5.79 | 2.53 | 1.82 | 1.53 | 1.16 | 0.24 |
| 1967 | 20.89 | 11.51 | 13.41 | 6.74 | 5.59 | 2.4 | 1.75 | 1.51 | 1.03 | 0.22 |
| 1966 | 20.09 | 10.68 | 13.17 | 6.43 | 5.5 | 2.47 | 1.83 | 1.63 | 0.98 | 0.22 |
| 1965 | 19.15 | 10.43 | 12.47 | 6.29 | 5.48 | 2.37 | 1.73 | 1.52 | 0.92 | 0.21 |
| 1964 | 19.62 | 10.22 | 12.89 | 6.08 | 5.25 | 2.22 | 1.61 | 1.36 | 0.9 | 0.2 |
| 1963 | 19.18 | 10.52 | 12.43 | 6.67 | 5.9 | 2.12 | 1.54 | 1.35 | 0.86 | 0.19 |
| 1962 | 19.14 | 11.21 | 12.83 | 7.34 | 6.58 | 2.01 | 1.47 | 1.29 | 0.82 | 0.19 |
| 1961 | 17.85 | 10.76 | 11.97 | 7.4 | 6.55 | 1.76 | 1.28 | 1.12 | 0.75 | 0.19 |


Comments