
Abstract
As part of global agriculture, apple production is an important indicator. According to the latest data for 2022, New Zealand has the largest apple production in the world, boasting a high productivity of 58.7 tons per hectare. Looking at the trends so far, New Zealand has maintained its position as a global apple production leader, supplying high-quality apples. Meanwhile, other major producing countries, while having larger production systems, tend to have slightly lower productivity. This is likely due to differences in regional climatic conditions and land use. In addition, with the increase in global demand, apple production is moving toward methods that emphasize sustainability. Examples include the minimal use of pesticides and the spread of organic farming. Overall, apple production is an important part of global agriculture, and producing countries continue to make efforts to improve productivity according to their respective characteristics and strategies.
Apple production (worldwide)
The data on apple production ranges from 1961 to 2022, making it possible to understand long-term trends. The highest production was recorded in Switzerland in 1967, at 174 tons per hectare. After this peak, apple production in Switzerland has declined and is currently at 32.6% of its peak. This is a trend seen not only in Switzerland but also in other countries, with many countries experiencing a decline in production from past peaks. This is likely due to factors such as advances in agricultural technology, changes in production methods, and climate change. Climate change in particular is likely to affect apple growth, which is one of the factors that leads to fluctuations in production. On the other hand, interest in sustainable agriculture has increased in recent years, and efforts such as organic farming and minimal use of pesticides have increased. These efforts have contributed to stabilizing production and improving quality. Overall, the long-term trends in apple production are diverse, and efforts toward sustainable production continue while responding to technological innovations and environmental changes.
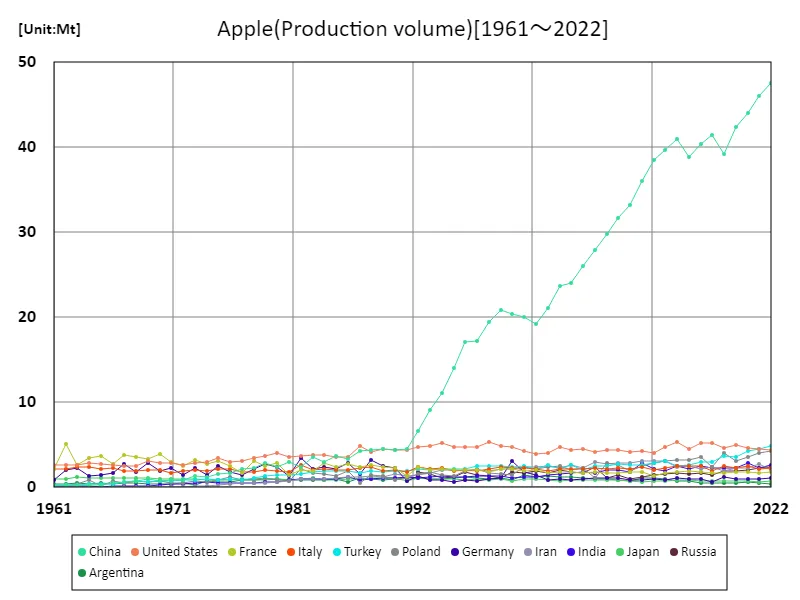
The maximum is the latest one, 47.6Mt of China
Apple production (latest year, countries around the world)
Looking at the 2022 production data for apples, New Zealand emerges as the global production leader, recording the highest yield of 58.7 tons per hectare. This high productivity could be the result of New Zealand’s climatic conditions and advanced agricultural techniques. Meanwhile, the overall average yield was 18.2 tons/hectare, which reflects New Zealand’s productivity. The productivity of other major producing countries is lower than the average, which is likely due to differences in climatic conditions and agricultural infrastructure in each region. The total production volume is 1.69 kilotons, which represents the total world apple production, but this is greatly boosted by New Zealand’s high productivity. As can be seen from this data, apple production varies greatly depending on regional characteristics and differences in technology, but it can be seen that developed countries like New Zealand are demonstrating global leadership. It is expected that the spread of sustainable agricultural methods and adaptation to climate change will continue to contribute to improving apple productivity.
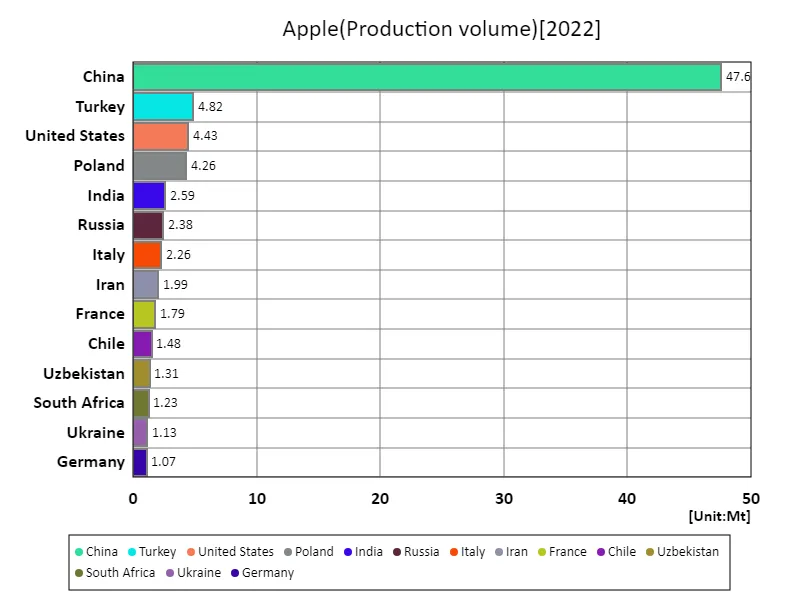
The maximum is 47.6Mt of China, the average is 1.02Mt, and the total is 95.8Mt
Apple production (continent)
According to the latest 2022 crop apple yield data, South America has the highest productivity at 38.9 tons per hectare. This figure breaks previous records and is the current maximum. The suitability of climatic conditions and recent developments in agricultural technology are speculated to be the reasons why South America’s apple production outperforms other regions. Agricultural investments and the development of production infrastructure throughout the South American region may also contribute to this achievement. This data suggests a regional shift in global apple production. Regions traditionally known as major apple producing countries may be becoming new production centers. The growth of South America will lead to an increased importance of agriculture within the region, which will also have a positive impact on the regional economy. In the future, emerging apple producing regions, including South America, may further expand, causing changes in global production patterns. In addition, the adoption of sustainable agricultural practices and responding to climate change are essential to improving the stability and quality of apple production. South America’s growth is part of important trends that will impact the entire global agriculture industry, and appropriate policies and technologies need to be put in place to address it.
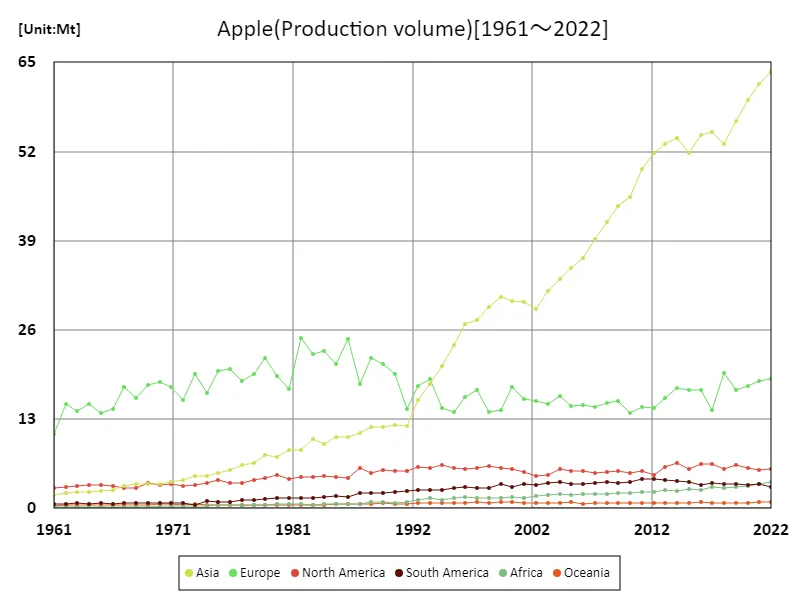
The maximum is the latest one, 63.5Mt of Asia
Apple production (latest year, continent)
According to the 2022 data on the yield of agricultural apples, the maximum overall productivity is 35.2 tonnes/hectare in South America, with an average of 25.6 tonnes/hectare. This figure indicates that South America plays a prominent role in apple production. The high productivity in this region is probably due to the climatic conditions and advances in agricultural technology in the region. In addition, agricultural policies and investment promotion throughout South America may also contribute to this achievement. With a total overall yield of 153 tonnes/hectare, it shows the total apple production in the world. This suggests that in addition to producing the amount required to meet demand, there is also a certain surplus production. However, in order to balance demand and supply, sustainability and efficiency in apple production are required. In particular, it is important to address the impacts of climate change and the risk of natural disasters in each production region. Global apple production is regionally concentrated mainly in South America, but production also takes place in other regions. From the trends so far, it is clear that climatic conditions and technological levels have a significant impact on productivity. It is expected that the spread of sustainable agricultural methods and adaptation to climate change will contribute to improving the stability and sustainability of apple production worldwide in the future.
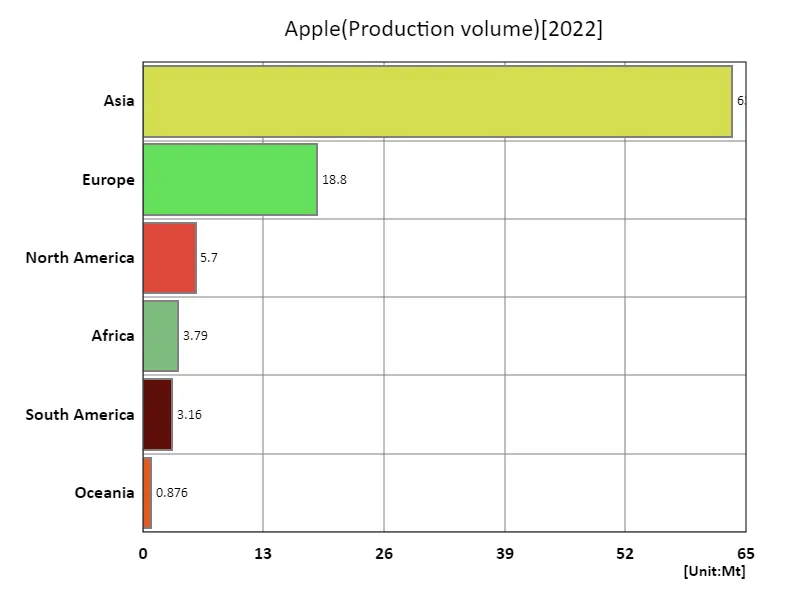
The maximum is 63.5Mt of Asia, the average is 16Mt, and the total is 95.8Mt
Main data
| Production(Apple, Production volume, t) [Mt] | ||||||||||
|---|---|---|---|---|---|---|---|---|---|---|
| World | Asia | Upper-middle-income countries | Eastern Asia | China | High-income countries | Europe | European Union | Lower-middle-income countries | Eastern Europe | |
| 2022 | 95.84 | 63.52 | 61.41 | 49.68 | 47.57 | 21.92 | 18.79 | 12.56 | 11.01 | 9.86 |
| 2021 | 93.92 | 61.8 | 59.45 | 47.96 | 45.98 | 21.61 | 18.53 | 12.41 | 11.4 | 10.04 |
| 2020 | 90.6 | 59.46 | 56.68 | 46.05 | 44.07 | 21.62 | 17.81 | 11.96 | 10.94 | 8.84 |
| 2019 | 87.46 | 56.45 | 54.23 | 44.46 | 42.43 | 21.59 | 17.25 | 11.59 | 10.28 | 8.3 |
| 2018 | 85.84 | 53.12 | 51.2 | 41.25 | 39.24 | 23.01 | 19.7 | 13.33 | 10.12 | 10.25 |
| 2017 | 83.09 | 54.81 | 51.7 | 43.46 | 41.39 | 19.88 | 14.27 | 9.64 | 10.21 | 6.82 |
| 2016 | 85.1 | 54.39 | 50.74 | 42.52 | 40.39 | 22.51 | 17.26 | 12.15 | 10.44 | 8.48 |
| 2015 | 82.37 | 51.82 | 49.12 | 41.07 | 38.9 | 21.96 | 17.21 | 12.32 | 10.09 | 7.87 |
| 2014 | 85.35 | 53.95 | 51.12 | 42.99 | 40.92 | 22.96 | 17.49 | 12.65 | 9.98 | 8.31 |
| 2013 | 82.83 | 53.04 | 50.71 | 41.7 | 39.68 | 20.94 | 16.12 | 11.37 | 10.05 | 7.82 |
| 2012 | 78.6 | 51.81 | 48.54 | 40.47 | 38.49 | 18.89 | 14.69 | 10.43 | 9.94 | 7.51 |
| 2011 | 77.07 | 49.48 | 45.62 | 37.77 | 35.99 | 19.92 | 14.83 | 11.12 | 10.39 | 6.17 |
| 2010 | 71.19 | 45.36 | 42.15 | 35.22 | 33.27 | 19.07 | 13.87 | 10.31 | 8.78 | 5.73 |
| 2009 | 71.64 | 44.01 | 41.42 | 33.71 | 31.68 | 20.58 | 15.65 | 11.71 | 8.49 | 6.87 |
| 2008 | 69.04 | 41.78 | 38.76 | 31.89 | 29.85 | 20.84 | 15.3 | 11.8 | 8.34 | 6.55 |
| 2007 | 65.66 | 39.28 | 37.8 | 29.78 | 27.87 | 18.84 | 14.72 | 10.12 | 8.02 | 5.84 |
| 2006 | 63.25 | 36.52 | 34.73 | 27.97 | 26.06 | 20.03 | 15.03 | 11.22 | 7.37 | 6.48 |
| 2005 | 61.91 | 35.06 | 33.16 | 25.87 | 24.02 | 20.05 | 14.95 | 11.15 | 7.7 | 6.45 |
| 2004 | 62.24 | 33.48 | 32.82 | 25.46 | 23.68 | 21.33 | 16.41 | 12.32 | 7.03 | 7.83 |
| 2003 | 58.1 | 31.6 | 30.33 | 22.96 | 21.11 | 19.51 | 15.24 | 11.32 | 7.26 | 7.19 |
| 2002 | 55.3 | 28.98 | 27.8 | 21.27 | 19.25 | 20.13 | 15.64 | 11.96 | 6.45 | 6.45 |
| 2001 | 57.1 | 30.13 | 28.45 | 22.02 | 20.02 | 21.34 | 15.91 | 12.77 | 6.34 | 6.38 |
| 2000 | 59.13 | 30.18 | 28.84 | 22.38 | 20.44 | 22.97 | 17.69 | 13.93 | 6.33 | 6 |
| 1999 | 56.99 | 30.74 | 28.8 | 22.88 | 20.81 | 20.74 | 14.4 | 11.78 | 5.91 | 4.63 |
| 1998 | 54.93 | 29.33 | 27.27 | 21.47 | 19.49 | 20.1 | 14.08 | 10.91 | 6.09 | 5.3 |
| 1997 | 56 | 27.51 | 26.41 | 19.51 | 17.23 | 20.63 | 17.18 | 11.95 | 7.57 | 8.26 |
| 1996 | 54.34 | 26.83 | 25.82 | 19.24 | 17.06 | 20.62 | 16.26 | 11.8 | 6.63 | 7.22 |
| 1995 | 48.85 | 23.79 | 21.87 | 16.33 | 14.02 | 19.08 | 14.03 | 10.32 | 6.51 | 5.49 |
| 1994 | 46.47 | 20.79 | 18.81 | 13.39 | 11.14 | 20.31 | 14.62 | 11.14 | 5.93 | 5.42 |
| 1993 | 47.73 | 18.05 | 17.92 | 11.3 | 9.08 | 21.69 | 18.81 | 12.92 | 6.72 | 9.21 |
| 1992 | 44.26 | 15.76 | 15.33 | 8.96 | 6.57 | 21.75 | 17.87 | 12.73 | 5.73 | 6.98 |
| 1991 | 35.99 | 11.92 | 15.03 | 6.51 | 4.56 | 16.42 | 14.44 | 8.34 | 3.51 | 7.79 |
| 1990 | 40.91 | 12.08 | 16.22 | 6.66 | 4.33 | 20.1 | 19.52 | 11.85 | 3.49 | 9.23 |
| 1989 | 42.46 | 11.92 | 16.81 | 6.88 | 4.52 | 21.25 | 21.08 | 12.87 | 3.22 | 10.25 |
| 1988 | 42.69 | 11.81 | 16.26 | 6.67 | 4.36 | 22.16 | 21.93 | 14.21 | 3.14 | 9.85 |
| 1987 | 38.46 | 10.99 | 15.04 | 6.46 | 4.28 | 19.61 | 18.05 | 11.3 | 2.79 | 8.25 |
| 1986 | 42.6 | 10.45 | 16.91 | 5.48 | 3.35 | 21.65 | 24.73 | 14.95 | 2.99 | 13.12 |
| 1985 | 38.91 | 10.37 | 16.15 | 5.65 | 3.63 | 19.13 | 20.97 | 12.33 | 2.67 | 10.95 |
| 1984 | 39.81 | 9.35 | 15.89 | 4.85 | 2.95 | 20.58 | 22.87 | 13.91 | 2.4 | 11.46 |
| 1983 | 39.8 | 10.13 | 16.73 | 5.72 | 3.55 | 19.73 | 22.48 | 12.8 | 2.44 | 12.6 |
| 1982 | 40.5 | 8.51 | 15.16 | 4.39 | 2.44 | 22.09 | 24.81 | 15.2 | 2.3 | 12.48 |
| 1981 | 32.67 | 8.43 | 13.95 | 4.87 | 3.02 | 16.07 | 17.33 | 9.79 | 1.9 | 9.47 |
| 1980 | 33.94 | 7.41 | 11.96 | 4.21 | 2.38 | 19.47 | 19.22 | 12.62 | 1.61 | 8.01 |
| 1979 | 36.56 | 7.76 | 14.5 | 4.63 | 2.89 | 19.62 | 21.97 | 13.06 | 1.57 | 10.53 |
| 1978 | 32.49 | 6.58 | 11.97 | 3.99 | 2.29 | 18.43 | 19.6 | 12.27 | 1.29 | 8.63 |
| 1977 | 30.49 | 6.25 | 12.96 | 3.87 | 2.12 | 15.63 | 18.61 | 9.89 | 1.29 | 10.64 |
| 1976 | 31.41 | 5.59 | 12.24 | 3.29 | 1.74 | 17.37 | 20.36 | 12.09 | 1.1 | 10.1 |
| 1975 | 31.14 | 5.16 | 10.55 | 3.09 | 1.59 | 18.92 | 20.04 | 12.83 | 1 | 8.28 |
| 1974 | 27.12 | 4.74 | 9.44 | 2.6 | 1.16 | 16.06 | 16.85 | 10.58 | 1.04 | 7.12 |
| 1973 | 29.14 | 4.74 | 9.62 | 2.81 | 1.3 | 18.02 | 19.58 | 12.45 | 0.92 | 7.88 |
| 1972 | 24.76 | 4.1 | 8.39 | 2.27 | 0.85 | 14.98 | 15.73 | 9.92 | 0.85 | 6.66 |
| 1971 | 26.58 | 3.85 | 8.6 | 2.25 | 0.85 | 16.77 | 17.61 | 11.09 | 0.7 | 7 |
| 1970 | 27.01 | 3.52 | 8.44 | 2.15 | 0.8 | 17.61 | 18.45 | 11.97 | 0.54 | 7.17 |
| 1969 | 26.78 | 3.59 | 7.21 | 2.42 | 1 | 18.64 | 18.01 | 12.78 | 0.45 | 6.01 |
| 1968 | 24.09 | 3.47 | 7.14 | 2.2 | 0.75 | 16.11 | 16.13 | 11.09 | 0.49 | 5.89 |
| 1967 | 25.37 | 3.23 | 6.76 | 2.03 | 0.63 | 17.72 | 17.63 | 12.55 | 0.44 | 5.67 |
| 1966 | 21.76 | 2.73 | 5.39 | 1.83 | 0.5 | 15.64 | 14.43 | 10.46 | 0.36 | 4.76 |
| 1965 | 21.32 | 2.51 | 4.9 | 1.72 | 0.32 | 15.74 | 13.96 | 10.19 | 0.36 | 3.9 |
| 1964 | 22.23 | 2.39 | 4.74 | 1.6 | 0.3 | 16.78 | 15.14 | 11.08 | 0.38 | 4.56 |
| 1963 | 21.01 | 2.34 | 4.5 | 1.6 | 0.25 | 15.88 | 14.16 | 10.41 | 0.35 | 3.88 |
| 1962 | 21.69 | 2.18 | 3.8 | 1.44 | 0.23 | 17.25 | 15.23 | 11.93 | 0.36 | 2.95 |
| 1961 | 17.05 | 2 | 3.65 | 1.29 | 0.17 | 12.75 | 10.89 | 8.02 | 0.4 | 2.91 |


Comments