
Abstract
Blueberry farming is attracting worldwide attention, and the latest data for 2022 confirms that Spain has the largest production. Spain’s blueberry production has reached 14.6 tons per hectare, maintaining a high level compared to other countries. This is likely due to Spain’s climatic conditions and advances in agricultural technology. Other major blueberry producing countries include the United States and Canada in North America, Chile in South America, and European countries. These countries are also expanding blueberry production according to their respective regional characteristics. Demand for blueberries is increasing worldwide due to increased health consciousness and increased demand in the food industry, and production is expected to increase. In addition, with the increasing importance of sustainable agriculture and organic cultivation, environmentally friendly blueberry cultivation is attracting attention. Blueberry production is expected to continue to increase in line with demand, but factors such as climate change and changes in agricultural policies must also be taken into account.
Blueberry production (worldwide)
Looking at the data on blueberry production, Spain achieved an astounding record of 17 tons per hectare in 1995. However, since then, blueberry production in Spain has fallen to 86% of its peak. This suggests that there are various factors that affect blueberry production. Possible factors include climate change, changes in the agricultural environment, and fluctuations in market demand. In addition, other countries are also increasing their blueberry production, which may be intensifying competition. Blueberries are becoming more popular worldwide due to increased health consciousness and increased demand from the food industry, but there are various challenges to increasing production. The adoption of sustainable agriculture and efficient cultivation methods will be an important factor in the future of blueberry production. It is expected that data on blueberry production will continue to be analyzed in the future to promote sustainable production.
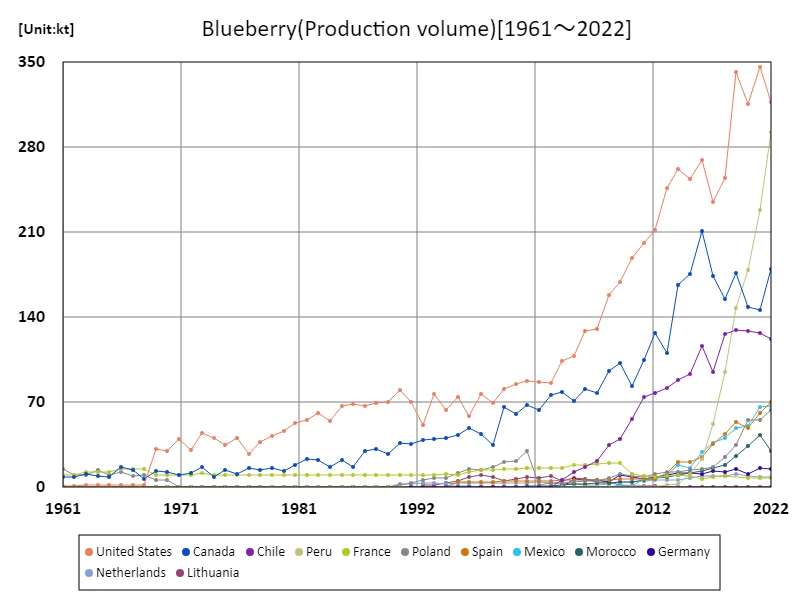
The maximum is 346kt[2021] of United States, and the current value is about 91.7%
Blueberry production (latest year, countries around the world)
In blueberry agriculture, the 2022 data shows some notable features and trends. First, Spain has the highest overall production, achieving a high yield of 14.6 tons per hectare. This may be due to the development of Spain’s climatic conditions and agricultural techniques. On the other hand, the overall average yield is 5.17 tons/ha, which is lower than the figure for Spain. This difference shows the variation in blueberry production conditions around the world. In addition, the overall total production of 171 tons/ha shows that blueberries are a globally important agricultural crop. From this data, it can be inferred that blueberry production varies by region, with producer techniques and environmental conditions influencing production. Furthermore, blueberry cultivation is likely to continue to expand in response to increasing global demand, but the adoption of sustainable agricultural practices is important.
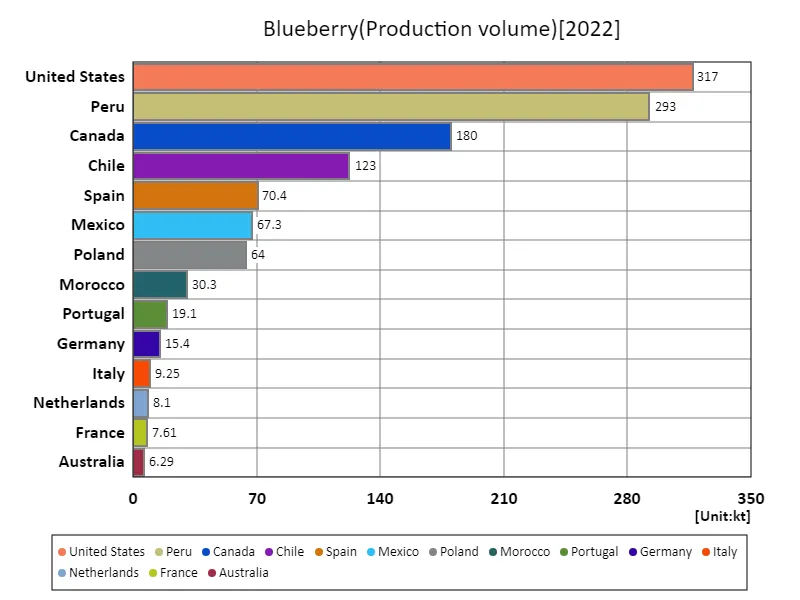
The maximum is 317kt of United States, the average is 32.3kt, and the total is 1.23Mt
Blueberry production (continent)
The latest 2022 data on blueberry production reveals that South America has the largest overall production. South America’s blueberry production is 10.5 tons per hectare, the highest value in global blueberry production. This data suggests that the blueberry industry in South America is growing rapidly. South America is known as a major producer of blueberries, especially in countries such as Chile and Argentina, and its geographical advantages and favorable climatic conditions are factors in the expansion of production. Blueberries are also becoming more popular worldwide due to increased health consciousness and increased demand. For this reason, South American producers are likely to expand production in response to market demand. However, blueberry cultivation requires specific climatic conditions and management techniques, and maintaining them requires investment and effort. In the future, the blueberry industry around the world, including South America, will continue to grow in order to achieve sustainable production while responding to changes in demand and increasing competition.
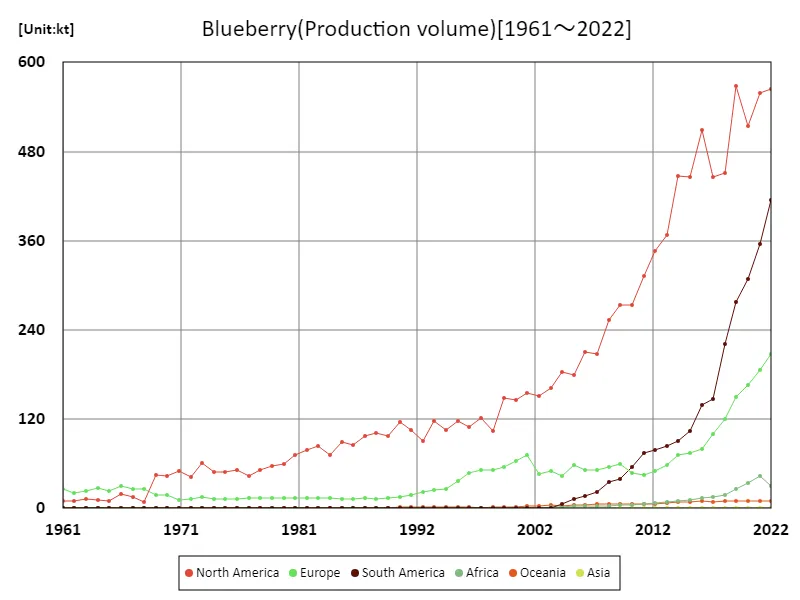
The maximum is 568kt[2019] of North America, and the current value is about 99.4%
Blueberry production (latest year, continental)
Data on blueberry production in 2022 reveals that South America recorded the largest overall production. Blueberry production in South America is 10.5 tons per hectare, which is the highest value in global blueberry production. This shows that the blueberry industry in South America is developing rapidly. South America is known as a major producer of blueberries, especially in countries such as Chile, and its geographical advantages and climatic conditions are factors that have contributed to the expansion of production. On the other hand, the overall average yield was 6.52 tons/ha, which is a somewhat low figure even including South American production. This indicates that there are regional differences and differences in technology in blueberry production. Blueberries are becoming more popular worldwide due to increased health consciousness and expanding demand. Therefore, producers in each country are making efforts to increase production in response to demand. However, blueberry cultivation requires specific climatic conditions and management techniques, and maintaining this requires a lot of effort and investment. Going forward, the blueberry industry in South America and around the world will continue to grow and adapt to changing demand and increased competition, while striving for sustainable production.
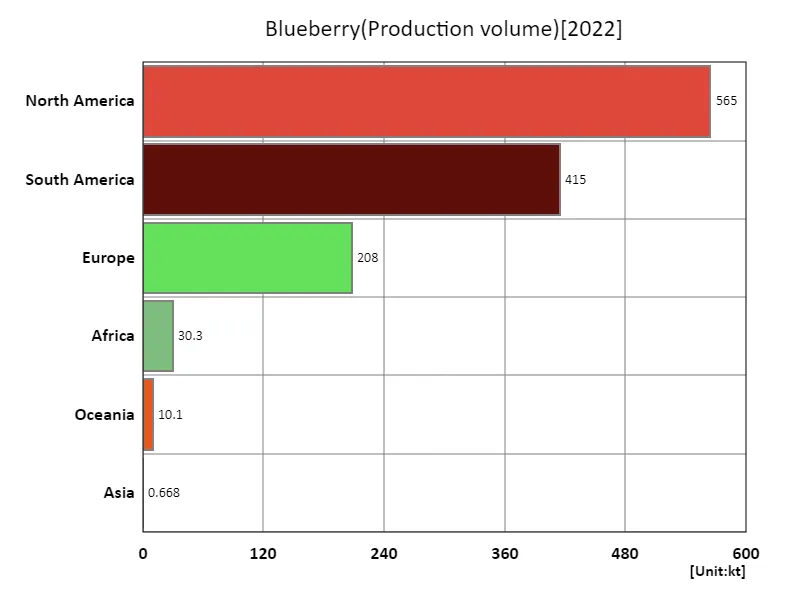
The maximum is 565kt of North America, the average is 205kt, and the total is 1.23Mt
Main data
| Production(Blueberry, Production volume, t) [Mt] | ||||||||||
|---|---|---|---|---|---|---|---|---|---|---|
| World | Americas | High-income countries | North America | Northern America | South America | Upper-middle-income countries | Net Food Importing Developing Countries | United States | Peru | |
| 2022 | 1.23 | 0.98 | 0.83 | 0.56 | 0.5 | 0.42 | 0.36 | 0.32 | 0.32 | 0.29 |
| 2021 | 1.15 | 0.91 | 0.81 | 0.56 | 0.49 | 0.36 | 0.3 | 0.27 | 0.35 | 0.23 |
| 2020 | 1.03 | 0.82 | 0.76 | 0.51 | 0.46 | 0.31 | 0.23 | 0.21 | 0.32 | 0.18 |
| 2019 | 1.03 | 0.85 | 0.79 | 0.57 | 0.52 | 0.28 | 0.2 | 0.17 | 0.34 | 0.15 |
| 2018 | 0.82 | 0.67 | 0.66 | 0.45 | 0.41 | 0.22 | 0.14 | 0.11 | 0.26 | 0.09 |
| 2017 | 0.72 | 0.59 | 0.61 | 0.45 | 0.41 | 0.15 | 0.09 | 0.07 | 0.24 | 0.05 |
| 2016 | 0.75 | 0.65 | 0.68 | 0.51 | 0.48 | 0.14 | 0.06 | 0.04 | 0.27 | 0.02 |
| 2015 | 0.64 | 0.55 | 0.6 | 0.45 | 0.43 | 0.1 | 0.03 | 0.02 | 0.25 | 0.01 |
| 2014 | 0.63 | 0.54 | 0.59 | 0.45 | 0.43 | 0.09 | 0.02 | 0.01 | 0.26 | 0 |
| 2013 | 0.53 | 0.45 | 0.5 | 0.37 | 0.36 | 0.08 | 0.01 | 0.01 | 0.25 | 0 |
| 2012 | 0.49 | 0.43 | 0.47 | 0.35 | 0.34 | 0.08 | 0.01 | 0.01 | 0.21 | 0 |
| 2011 | 0.44 | 0.39 | 0.43 | 0.31 | 0.31 | 0.07 | 0.01 | 0.01 | 0.2 | 0 |
| 2010 | 0.39 | 0.33 | 0.38 | 0.27 | 0.27 | 0.06 | 0 | 0 | 0.19 | 0 |
| 2009 | 0.38 | 0.31 | 0.37 | 0.27 | 0.27 | 0.04 | 0 | 0 | 0.17 | |
| 2008 | 0.35 | 0.29 | 0.34 | 0.25 | 0.25 | 0.04 | 0 | 0 | 0.16 | |
| 2007 | 0.29 | 0.23 | 0.28 | 0.21 | 0.21 | 0.02 | 0 | 0 | 0.13 | |
| 2006 | 0.29 | 0.23 | 0.28 | 0.21 | 0.21 | 0.02 | 0 | 0 | 0.13 | |
| 2005 | 0.26 | 0.19 | 0.25 | 0.18 | 0.18 | 0.01 | 0 | 0 | 0.11 | |
| 2004 | 0.24 | 0.19 | 0.23 | 0.18 | 0.18 | 0.01 | 0 | 0 | 0.1 | |
| 2003 | 0.22 | 0.16 | 0.21 | 0.16 | 0.16 | 0 | 0 | 0 | 0.09 | |
| 2002 | 0.2 | 0.15 | 0.19 | 0.15 | 0.15 | 0 | 0 | 0 | 0.09 | |
| 2001 | 0.23 | 0.16 | 0.23 | 0.16 | 0.16 | 0 | 0 | 0 | 0.09 | |
| 2000 | 0.21 | 0.15 | 0.2 | 0.15 | 0.15 | 0 | 0 | 0 | 0.08 | |
| 1999 | 0.21 | 0.15 | 0.2 | 0.15 | 0.15 | 0 | 0 | 0 | 0.08 | |
| 1998 | 0.16 | 0.1 | 0.16 | 0.1 | 0.1 | 0 | 0 | 0 | 0.07 | |
| 1997 | 0.17 | 0.12 | 0.17 | 0.12 | 0.12 | 0 | 0 | 0 | 0.08 | |
| 1996 | 0.16 | 0.11 | 0.16 | 0.11 | 0.11 | 0 | 0 | 0 | 0.06 | |
| 1995 | 0.16 | 0.12 | 0.16 | 0.12 | 0.12 | 0 | 0 | 0 | 0.07 | |
| 1994 | 0.13 | 0.11 | 0.13 | 0.11 | 0.1 | 0 | 0 | 0 | 0.06 | |
| 1993 | 0.14 | 0.12 | 0.14 | 0.12 | 0.12 | 0 | 0 | 0 | 0.08 | |
| 1992 | 0.12 | 0.09 | 0.12 | 0.09 | 0.09 | 0 | 0 | 0.05 | ||
| 1991 | 0.13 | 0.11 | 0.13 | 0.11 | 0.11 | 0 | 0 | 0 | 0.07 | |
| 1990 | 0.13 | 0.12 | 0.13 | 0.12 | 0.12 | 0 | 0 | 0.08 | ||
| 1989 | 0.11 | 0.1 | 0.11 | 0.1 | 0.1 | 0 | 0 | 0.07 | ||
| 1988 | 0.12 | 0.1 | 0.11 | 0.1 | 0.1 | 0 | 0.07 | |||
| 1987 | 0.11 | 0.1 | 0.11 | 0.1 | 0.1 | 0 | 0.07 | |||
| 1986 | 0.1 | 0.09 | 0.1 | 0.09 | 0.09 | 0.07 | ||||
| 1985 | 0.1 | 0.09 | 0.1 | 0.09 | 0.09 | 0.07 | ||||
| 1984 | 0.09 | 0.07 | 0.09 | 0.07 | 0.07 | 0.05 | ||||
| 1983 | 0.1 | 0.08 | 0.1 | 0.08 | 0.08 | 0.06 | ||||
| 1982 | 0.09 | 0.08 | 0.09 | 0.08 | 0.08 | 0.06 | ||||
| 1981 | 0.09 | 0.07 | 0.09 | 0.07 | 0.07 | 0.05 | ||||
| 1980 | 0.07 | 0.06 | 0.07 | 0.06 | 0.06 | 0.05 | ||||
| 1979 | 0.07 | 0.06 | 0.07 | 0.06 | 0.06 | 0.04 | ||||
| 1978 | 0.07 | 0.05 | 0.07 | 0.05 | 0.05 | 0.04 | ||||
| 1977 | 0.06 | 0.04 | 0.06 | 0.04 | 0.04 | 0.03 | ||||
| 1976 | 0.06 | 0.05 | 0.06 | 0.05 | 0.05 | 0.04 | ||||
| 1975 | 0.06 | 0.05 | 0.06 | 0.05 | 0.05 | 0.04 | ||||
| 1974 | 0.06 | 0.05 | 0.06 | 0.05 | 0.05 | 0.04 | ||||
| 1973 | 0.08 | 0.06 | 0.08 | 0.06 | 0.06 | 0.04 | ||||
| 1972 | 0.06 | 0.04 | 0.06 | 0.04 | 0.04 | 0.03 | ||||
| 1971 | 0.06 | 0.05 | 0.06 | 0.05 | 0.05 | 0.04 | ||||
| 1970 | 0.06 | 0.04 | 0.06 | 0.04 | 0.04 | 0.03 | ||||
| 1969 | 0.06 | 0.04 | 0.06 | 0.04 | 0.04 | 0.03 | ||||
| 1968 | 0.04 | 0.01 | 0.04 | 0.01 | 0.01 | 0 | ||||
| 1967 | 0.04 | 0.02 | 0.04 | 0.02 | 0.02 | 0 | ||||
| 1966 | 0.05 | 0.02 | 0.05 | 0.02 | 0.02 | 0 | ||||
| 1965 | 0.03 | 0.01 | 0.03 | 0.01 | 0.01 | 0 | ||||
| 1964 | 0.04 | 0.01 | 0.04 | 0.01 | 0.01 | 0 | ||||
| 1963 | 0.04 | 0.01 | 0.04 | 0.01 | 0.01 | 0 | ||||
| 1962 | 0.03 | 0.01 | 0.03 | 0.01 | 0.01 | 0 | ||||
| 1961 | 0.04 | 0.01 | 0.04 | 0.01 | 0.01 | 0 | ||||


Comments