
Abstract
Considering the production of grapes in global agriculture based on data from 2022, Saudi Arabia recorded a high production of 23.4t/ha. This suggests that the country has achieved efficient grape cultivation by combining dry climatic conditions with innovative agricultural techniques. On the other hand, some other major grape-producing countries tend to have different production volumes due to differences in climatic conditions and soil. For example, European countries such as France and Italy take advantage of their Mediterranean climate and rich soil, which are suitable for grape cultivation, to produce high-quality wine grapes. In addition, emerging grape-producing countries such as the United States and China have seen improvements in production volume and quality due to recent advances in agricultural technology and increased investment. These trends suggest that regional climatic conditions and technological levels have a significant impact on grape production, and that each country is developing its own strategy. In the future, the grape production environment and performance may change due to climate change and technological innovation.
Grape production (worldwide)
Based on grape production data from the past 60 years, Saudi Arabia achieved an astonishingly high production of 42.3 t/ha in 1973. This was the result of the country’s active agricultural development at that time, and it can be said that the results of technological innovation and investment are clearly evident. However, production has declined in the following decades, falling to 55.4% of its peak as of 2022. There are several factors behind this decline. First, there is the deterioration of production conditions due to climate change and environmental changes. In addition, changes in agricultural policies and the economy, as well as water resource constraints, may have also played a role. On the other hand, some other major grape-producing countries have made efforts to increase or stabilize production over a similar period. This is likely the result of active efforts to build sustainable agricultural systems and innovate. The importance of appropriate agricultural policies and technological investment in grape production is even more apparent. In the future, environmental considerations and technological innovation will become increasingly important for countries, including Saudi Arabia, to aim for sustainable grape production.
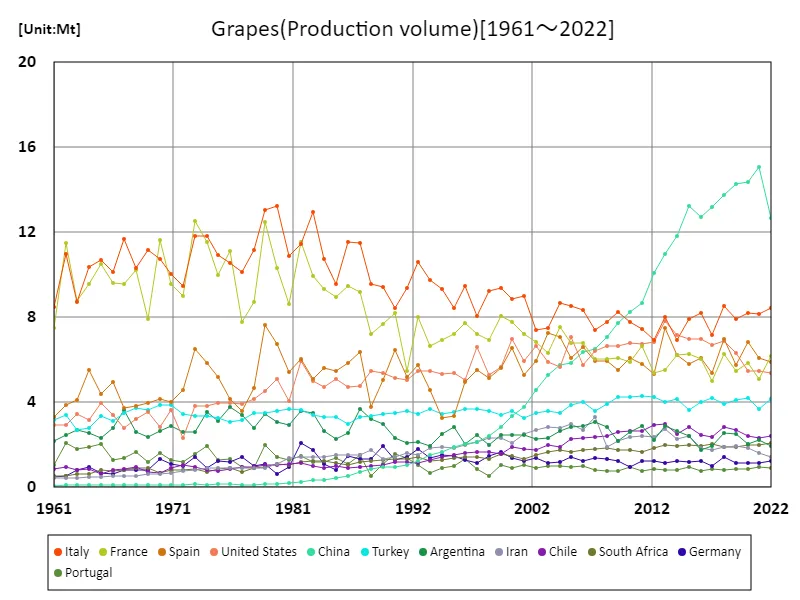
The maximum is 15.1Mt[2021] of China, and the current value is about 84.1%
Grape production (latest year, world)
Analyzing the grape production in world agriculture in 2022, Peru took the top spot with a high production of 24.8 t/ha. In recent years, Peru has expanded grape production through proactive agricultural policies and investments, and the results are evident. On the other hand, the overall average production was 9.62 t/ha, which shows the wide range of production in each country. Grape production is greatly affected by differences in climatic conditions and soil, so the production volume reflects the characteristics of each region. In addition, the total overall production volume of 885 t/ha indicates that grapes are an important agricultural crop around the world and many countries are working on their production. In addition, grapes are not only in high demand for food, but also for processed products such as wine and juice, so increasing and stabilizing production volume has economic importance. In the future, efforts toward sustainable grape production will become increasingly important while responding to climate change and changes in market demand.
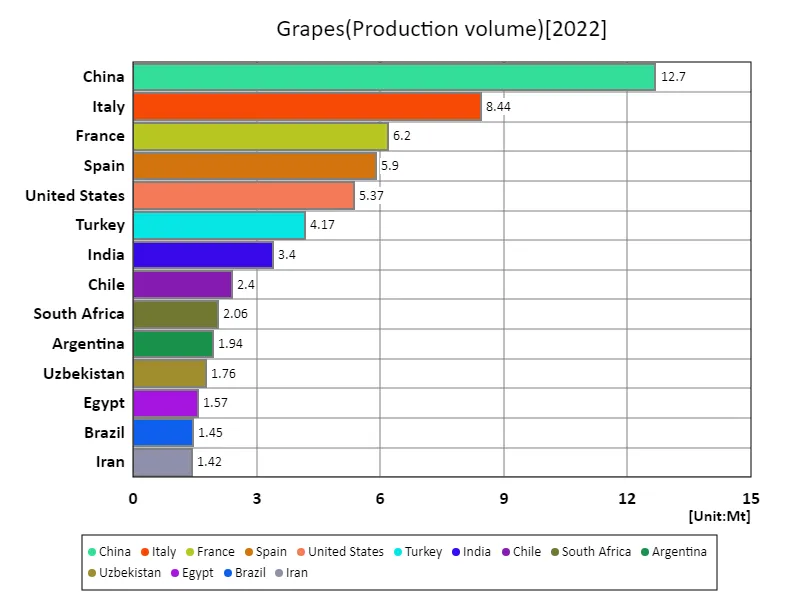
The maximum is 12.7Mt of China, the average is 781kt, and the total is 74.9Mt
Grape production (continent)
Considering the grape production in global agriculture in 2022, North America recorded the largest production of 18.5t/ha. This is seen as a result of North America’s rich grape-producing regions and advanced agricultural techniques. Compared to past data, the largest value in 2022 suggests that North American grape production is growing sustainably. This trend is likely due to technological innovation in agriculture, improved efficiency in production processes, and the spread of sustainable agricultural practices. In addition, the increasing demand for grapes may also contribute to the increase in production. Grapes are in demand not only for food but also for processed products such as wine and juice, and the expansion of these markets is an opportunity for producers. In addition, stability of climatic conditions and consideration for the environment are also important factors. In the future, efforts toward sustainable grape production will become increasingly important, and focusing on technological innovation and environmental protection will be essential for the growth and stabilization of the global grape industry.
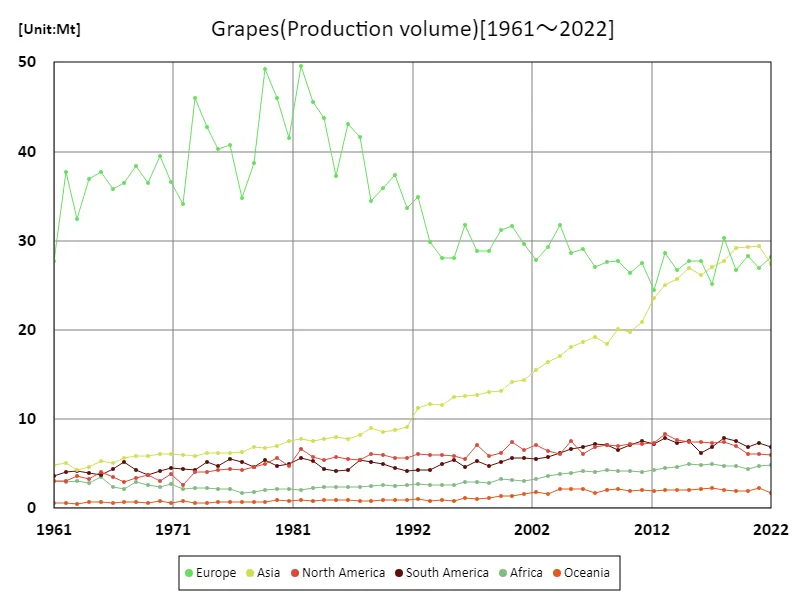
The maximum is 49.6Mt[1982] of Europe, and the current value is about 56.7%
Grape production (latest year, continental)
Considering the grape production in global agriculture in 2022, North America recorded the largest production of 14.5t/ha. This is seen as the result of North America’s excellent grape-producing regions and advanced agricultural technology. On the other hand, the overall average production was 12.8t/ha, which shows the wide range of production in each country. Grape production is affected by different climatic conditions and soils in each region, so regionality is strongly reflected in the production volume. In addition, the total overall production volume of 76.5t/ha shows that grapes are an important agricultural crop around the world. Grapes are not only in high demand for food, but also for processed products such as wine and juice, so increasing and stabilizing production volume has economic importance. From this data, it can be seen that although global grape production has shown a certain growth, differences in productivity and technological levels in each region still exist, and the establishment of a sustainable production system is required. In the future, efforts to promote the development and sustainability of the grape industry in each region while adapting to climate change and changes in market demand will be important.
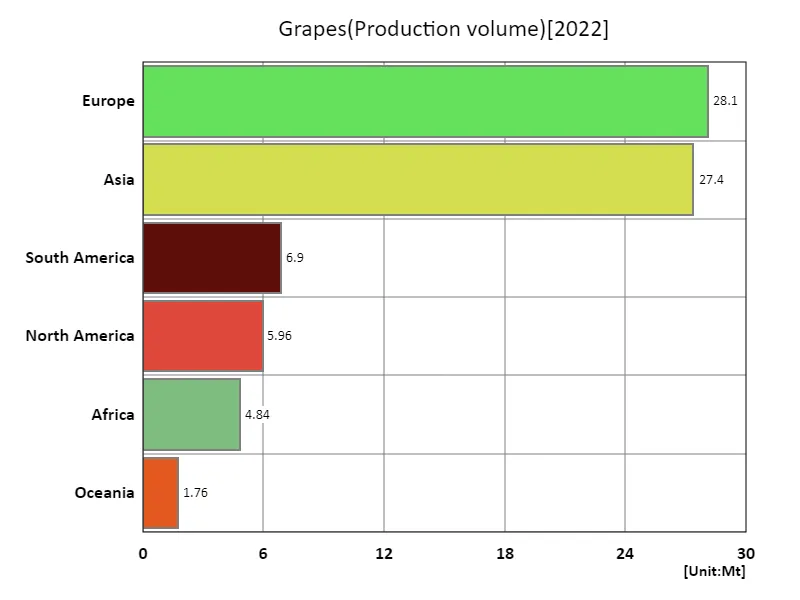
The maximum is 28.1Mt of Europe, the average is 12.5Mt, and the total is 74.9Mt
Main data
| Production(Grapes, Production volume, t) [Mt] | ||||||||||
|---|---|---|---|---|---|---|---|---|---|---|
| World | High-income countries | Europe | Upper-middle-income countries | Asia | European Union | Southern Europe | Eastern Asia | Americas | China | |
| 2022 | 74.94 | 35.85 | 28.13 | 27.74 | 27.35 | 25.58 | 16.95 | 12.99 | 12.86 | 12.67 |
| 2021 | 76.75 | 35.34 | 26.9 | 29.92 | 29.44 | 24.6 | 16.95 | 15.4 | 13.39 | 15.07 |
| 2020 | 76.83 | 36.52 | 28.26 | 29.21 | 29.35 | 25.97 | 17.68 | 14.72 | 12.91 | 14.39 |
| 2019 | 77.05 | 35.97 | 26.73 | 29.34 | 29.15 | 24.22 | 16.21 | 14.62 | 14.51 | 14.28 |
| 2018 | 80.1 | 40.13 | 30.3 | 28.49 | 27.67 | 27.63 | 18.2 | 14.11 | 15.32 | 13.76 |
| 2017 | 73.6 | 34.78 | 25.14 | 27.47 | 27.11 | 22.78 | 15.06 | 13.54 | 14.18 | 13.18 |
| 2016 | 74.52 | 37.62 | 27.7 | 25.93 | 26.11 | 25.22 | 16.88 | 13.12 | 13.68 | 12.71 |
| 2015 | 76.59 | 37.92 | 27.77 | 27.23 | 26.88 | 25.44 | 16.73 | 13.65 | 14.97 | 13.25 |
| 2014 | 73.91 | 36.93 | 26.67 | 26.1 | 25.69 | 24.43 | 15.82 | 12.27 | 14.9 | 11.81 |
| 2013 | 76.51 | 39.74 | 28.64 | 25.63 | 25.01 | 26.16 | 17.98 | 11.39 | 16.21 | 10.98 |
| 2012 | 68.97 | 34.98 | 24.51 | 23.78 | 23.6 | 22.41 | 14.75 | 10.58 | 14.6 | 10.11 |
| 2011 | 69.17 | 37.31 | 27.45 | 22.94 | 20.92 | 24.98 | 15.76 | 9.08 | 14.7 | 8.68 |
| 2010 | 66.7 | 36.54 | 26.43 | 21.84 | 19.82 | 24.27 | 16.65 | 8.73 | 14.28 | 8.24 |
| 2009 | 67.65 | 37.4 | 27.67 | 21.18 | 20.09 | 25.19 | 16.47 | 8.23 | 13.58 | 7.75 |
| 2008 | 66.59 | 37.31 | 27.63 | 20.86 | 18.47 | 25.36 | 16.29 | 7.6 | 14.13 | 7.07 |
| 2007 | 66.18 | 36.24 | 27.05 | 20.34 | 19.25 | 24.9 | 15.91 | 7.07 | 14.1 | 6.53 |
| 2006 | 66.98 | 38.34 | 29.08 | 19.68 | 18.62 | 27.18 | 17.77 | 6.91 | 12.96 | 6.37 |
| 2005 | 66.98 | 39.07 | 28.64 | 18.68 | 18.05 | 26.6 | 17.31 | 6.47 | 14.17 | 5.87 |
| 2004 | 67.21 | 40.22 | 31.78 | 18.18 | 17.12 | 29.53 | 18.63 | 6.35 | 12.29 | 5.77 |
| 2003 | 63.05 | 37.05 | 29.25 | 17.45 | 16.41 | 26.84 | 17.59 | 5.87 | 12.15 | 5.27 |
| 2002 | 61.16 | 37.03 | 27.84 | 16 | 15.56 | 25.9 | 15.8 | 5.22 | 12.6 | 4.56 |
| 2001 | 60.86 | 37.99 | 29.61 | 14.97 | 14.43 | 27.73 | 17.07 | 4.44 | 12.15 | 3.77 |
| 2000 | 63.55 | 40.61 | 31.69 | 15.24 | 14.13 | 29.42 | 18.02 | 4.09 | 13.12 | 3.37 |
| 1999 | 60.48 | 39.19 | 31.24 | 14.12 | 13.11 | 29.63 | 17.76 | 3.51 | 11.49 | 2.81 |
| 1998 | 56.43 | 36.15 | 28.82 | 13 | 13.02 | 27.18 | 16.98 | 3.05 | 10.52 | 2.43 |
| 1997 | 57.96 | 36.91 | 28.87 | 13.9 | 12.66 | 27.01 | 16.6 | 2.76 | 12.49 | 2.11 |
| 1996 | 58.63 | 37.76 | 31.78 | 13.67 | 12.64 | 29.29 | 17.78 | 2.62 | 10.15 | 2.02 |
| 1995 | 55.38 | 34.04 | 28.11 | 14.62 | 12.44 | 25.75 | 14.64 | 2.46 | 11.39 | 1.9 |
| 1994 | 54.08 | 34.25 | 28.09 | 13.37 | 11.53 | 25.91 | 15.39 | 2.14 | 10.9 | 1.68 |
| 1993 | 55.29 | 35.47 | 29.86 | 13.19 | 11.75 | 27.25 | 16.79 | 1.94 | 10.26 | 1.52 |
| 1992 | 60.27 | 39.8 | 34.85 | 13.94 | 11.26 | 31.87 | 19.95 | 1.68 | 10.36 | 1.25 |
| 1991 | 56.07 | 34.44 | 33.66 | 16.95 | 9.16 | 27.02 | 18.84 | 1.45 | 9.78 | 1.03 |
| 1990 | 59.75 | 37.72 | 37.35 | 17.72 | 8.77 | 30.21 | 18.79 | 1.37 | 10.2 | 0.96 |
| 1989 | 58.82 | 37.28 | 35.86 | 17.36 | 8.59 | 29.59 | 18.25 | 1.41 | 10.9 | 0.98 |
| 1988 | 58.13 | 34.91 | 34.46 | 18.48 | 9.01 | 27.43 | 16.58 | 1.33 | 11.32 | 0.88 |
| 1987 | 63.97 | 40.9 | 41.67 | 18.92 | 8.23 | 34.21 | 22.19 | 1.17 | 10.85 | 0.71 |
| 1986 | 64.05 | 41.55 | 43.09 | 18.1 | 7.77 | 34.81 | 21.71 | 0.98 | 9.79 | 0.51 |
| 1985 | 58.67 | 37.69 | 37.26 | 16.69 | 8.03 | 30.48 | 19.14 | 0.91 | 9.97 | 0.45 |
| 1984 | 64.51 | 40.39 | 43.8 | 20.17 | 7.72 | 33.98 | 20.79 | 0.8 | 9.72 | 0.36 |
| 1983 | 67.26 | 44.03 | 45.59 | 19.42 | 7.59 | 37.14 | 22.69 | 0.79 | 11 | 0.33 |
| 1982 | 72.56 | 47.36 | 49.57 | 21.48 | 7.74 | 39.56 | 22.38 | 0.67 | 12.28 | 0.24 |
| 1981 | 61.66 | 38.55 | 41.48 | 19.28 | 7.59 | 32.85 | 20.57 | 0.6 | 9.68 | 0.22 |
| 1980 | 66.49 | 44.52 | 46.02 | 18.53 | 7.01 | 37.62 | 24.57 | 0.54 | 10.39 | 0.16 |
| 1979 | 69.22 | 47.82 | 49.22 | 18.27 | 6.8 | 41.6 | 25.45 | 0.58 | 10.45 | 0.17 |
| 1978 | 57.36 | 37.38 | 38.67 | 16.92 | 6.87 | 31.87 | 19.44 | 0.5 | 9.27 | 0.12 |
| 1977 | 53.16 | 34.59 | 34.83 | 15.49 | 6.35 | 29.04 | 17.35 | 0.49 | 9.48 | 0.1 |
| 1976 | 59.64 | 39.07 | 40.77 | 17.32 | 6.16 | 33.86 | 18.77 | 0.5 | 9.84 | 0.13 |
| 1975 | 58.36 | 39.04 | 40.29 | 16.14 | 6.18 | 33.65 | 20.02 | 0.47 | 9 | 0.14 |
| 1974 | 61.04 | 41.77 | 42.74 | 15.83 | 6.15 | 36.9 | 22.32 | 0.48 | 9.27 | 0.12 |
| 1973 | 63.18 | 44.56 | 46.04 | 15.49 | 5.86 | 39.68 | 22.83 | 0.46 | 8.39 | 0.13 |
| 1972 | 50.1 | 34.02 | 34.09 | 13 | 5.94 | 29.99 | 17.78 | 0.44 | 7.03 | 0.12 |
| 1971 | 54.3 | 35.58 | 36.53 | 15.34 | 6.09 | 30.86 | 17.96 | 0.4 | 8.41 | 0.12 |
| 1970 | 55.94 | 38.13 | 39.52 | 14.58 | 6.05 | 34.22 | 19.22 | 0.36 | 7.22 | 0.1 |
| 1969 | 52.97 | 34.87 | 36.46 | 14.92 | 5.89 | 30.7 | 19.57 | 0.38 | 7.47 | 0.1 |
| 1968 | 55.39 | 36.61 | 38.33 | 15.39 | 5.85 | 32.46 | 18.85 | 0.4 | 7.67 | 0.11 |
| 1967 | 53.18 | 35.85 | 36.45 | 14.44 | 5.66 | 31.73 | 19.38 | 0.38 | 8.16 | 0.09 |
| 1966 | 51.8 | 35.52 | 35.82 | 13.32 | 5.1 | 31.13 | 19.16 | 0.35 | 7.93 | 0.1 |
| 1965 | 55.08 | 37.37 | 37.72 | 13.63 | 5.26 | 32.8 | 19.72 | 0.35 | 7.84 | 0.1 |
| 1964 | 52.35 | 37.27 | 36.96 | 11.59 | 4.63 | 32.91 | 20.37 | 0.32 | 7.3 | 0.1 |
| 1963 | 48.03 | 32.57 | 32.41 | 11.84 | 4.26 | 28.47 | 16.96 | 0.27 | 7.77 | 0.09 |
| 1962 | 53.44 | 37.53 | 37.67 | 12.32 | 5.12 | 33.49 | 19.7 | 0.29 | 7.09 | 0.09 |
| 1961 | 42.99 | 28.76 | 27.76 | 10.47 | 4.87 | 24.49 | 15.25 | 0.25 | 6.74 | 0.07 |


Comments