
Abstract
Kiwi fruit is a globally important fruit, with New Zealand in particular taking a leading position in its production. According to 2022 data, New Zealand’s kiwi production is 41.1 tonnes per hectare, well above the global average. This high productivity is due in part to New Zealand’s warm climate and rich soil conditions, with a long growing season and ample rainfall suitable for kiwi cultivation. On the other hand, there are other kiwi producing countries, but the reason New Zealand’s exceptionally high production is due to advanced agricultural technology and management. Kiwi cultivation requires a lot of labor and technology, and advanced technology is required to maintain quality and improve harvesting efficiency. Thus, New Zealand’s kiwi industry is supported by a combination of local climatic conditions and agricultural technology, which allows it to remain competitive in the global market.
Kiwi fruit production (worldwide)
Looking back at the data on kiwi production, we can see significant changes worldwide between 1970 and 2022. Of particular note is that in 2022, New Zealand achieved its highest ever record in kiwi production. At this peak, production per hectare reached 41.1 tons, which is significantly higher than the previous record. On the other hand, compared to the peak, production in other countries has declined, leading to a situation where New Zealand’s production accounts for 100% of the total. This shows that New Zealand has established an overwhelming position in kiwi production. As a general trend, New Zealand has played a leading role in kiwi production, while the production of other countries has declined relatively. This is largely due to New Zealand’s climatic conditions and advances in agricultural technology. However, other countries are still working on kiwi production and are trying to maintain their productivity while responding to conditions and challenges unique to each region.
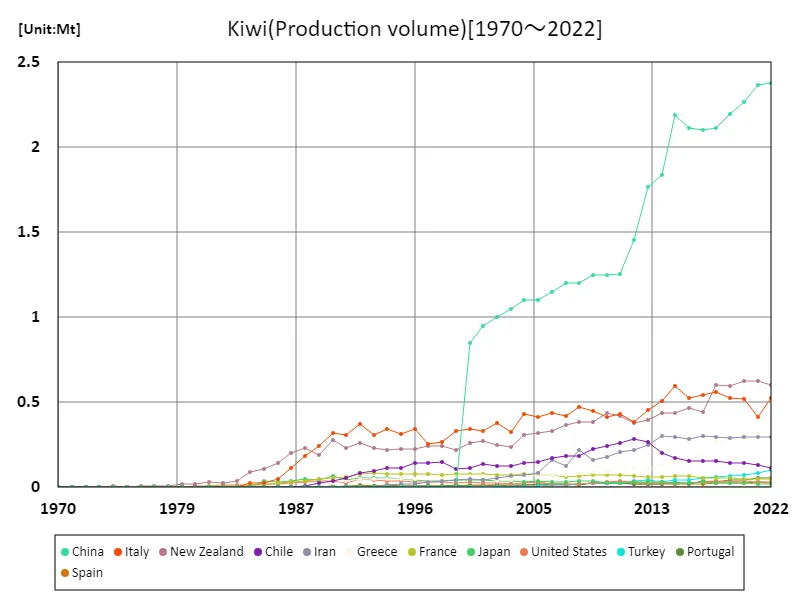
The maximum is the latest one, 2.38Mt of China
Kiwi fruit production (latest year, countries around the world)
Kiwi production occupies an important position in world agriculture. According to data for 2022, New Zealand has an overwhelming presence in kiwi production, with production per hectare reaching 41.1 tons. This is the largest overall, indicating that New Zealand’s kiwi production stands out globally. Meanwhile, the overall average production is 17.2 tons/hectare, with New Zealand’s production far exceeding this average. The total production is 429 tons/hectare, with New Zealand’s production accounting for the majority of the total. This trend is due to New Zealand having favorable climatic conditions and rich soil for kiwi cultivation, and utilizing advanced agricultural techniques. Although there are other kiwi-producing countries, these factors play an important role behind New Zealand’s overwhelming production. As global demand for kiwi grows, New Zealand has maintained its productivity while remaining competitive in the market.
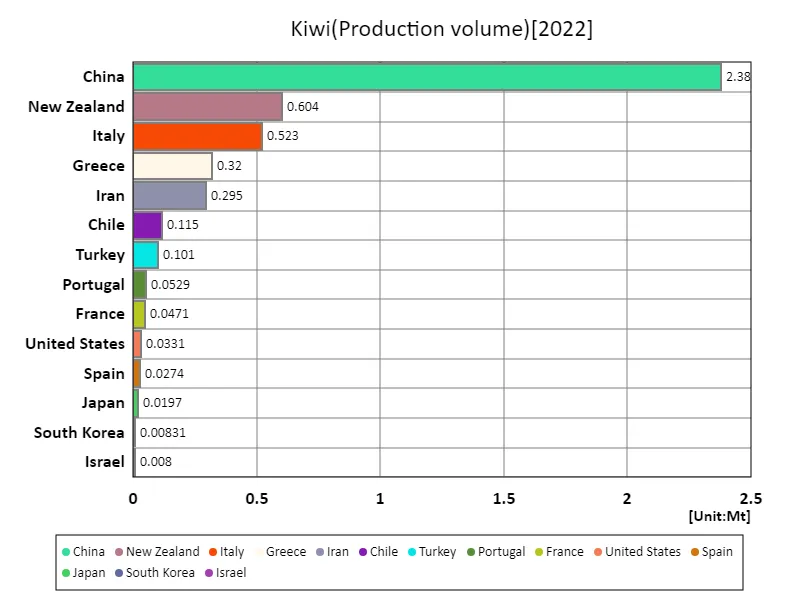
The maximum is 2.38Mt of China, the average is 108kt, and the total is 4.54Mt
Kiwi production (continent)
The latest data on the yield of the agricultural crop kiwi is interesting. According to the data for 2022, Oceania is the world leader in kiwi production, with production per hectare reaching 40.8 tons. This figure is the highest ever, indicating that the Oceania region occupies a prominent position in kiwi production. One of the reasons why the Oceania region is particularly good at kiwi production is due to its excellent climatic conditions and abundant soil resources. This provides an ideal environment for kiwi cultivation and high productivity. Advances in agricultural technology in the Oceania region also play an important role in kiwi production. This allows for more efficient production methods and quality control, contributing to increased production. This trend is more noticeable compared to other regions and indicates that Oceania continues to maintain its position as a global leader in kiwi production.
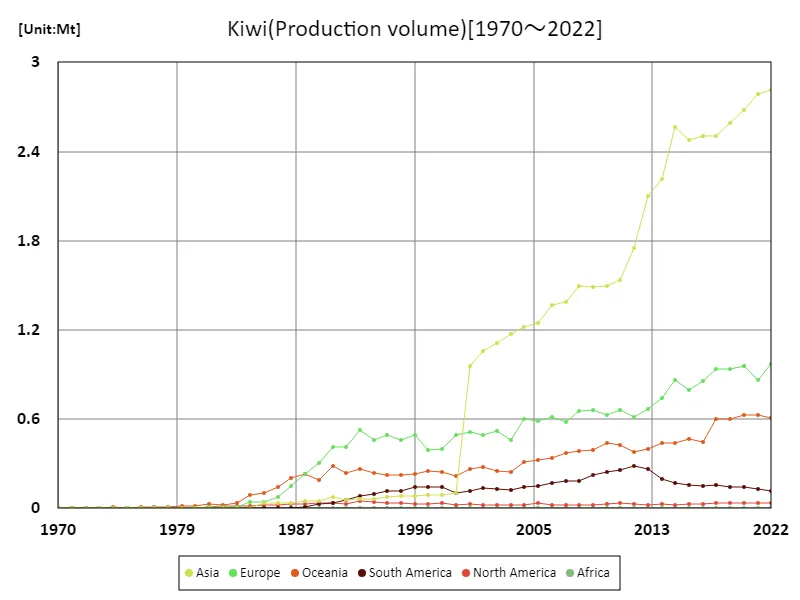
The maximum is the latest one, 2.81Mt of Asia
Kiwi fruit production (latest year, continental)
The 2022 data on the yield of the agricultural crop kiwi is interesting. According to this data, Oceania is the world leader in kiwi production, with production reaching 40.8 tons per hectare. This figure is the highest ever, indicating that the Oceania region occupies a prominent position in kiwi production. One of the factors that makes kiwi production in the Oceania region stand out compared to other regions is the excellent climatic conditions and abundant soil resources. This creates an ideal environment for kiwi cultivation and achieves high productivity. Advances in agricultural technology in the Oceania region also play an important role in kiwi production. This allows for more efficient production methods and quality control, contributing to increased production. On the other hand, the average production in other regions is 19.1 tons per hectare, which is slightly lower than Oceania. However, kiwi production is widespread worldwide and is grown in a variety of regions. This diversity stabilizes kiwi supply sources and supports the market. Overall, while Oceania plays a major role in kiwi production, other regions are also actively expanding their production, increasing competition in the global market.
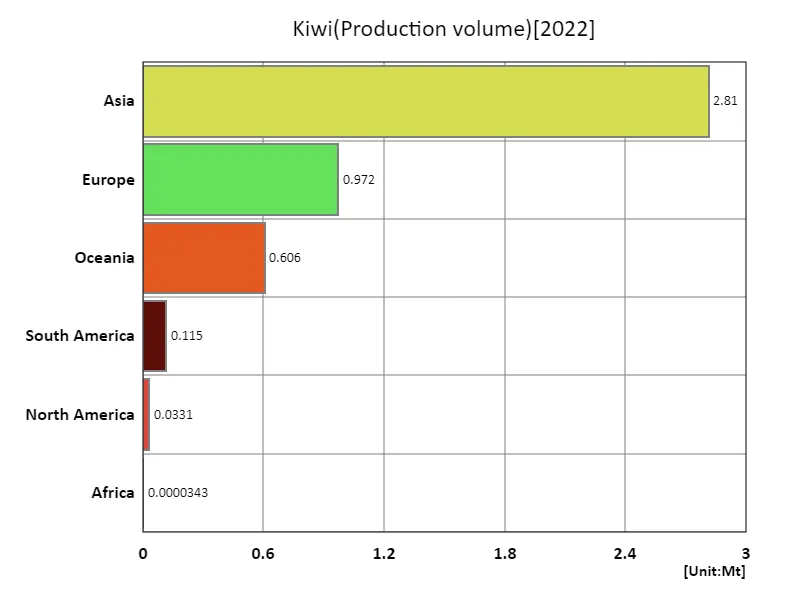
The maximum is 2.81Mt of Asia, the average is 757kt, and the total is 4.54Mt
Main data
| Production(Kiwi, Production volume, t) [Mt] | ||||||||||
|---|---|---|---|---|---|---|---|---|---|---|
| World | Asia | Upper-middle-income countries | Eastern Asia | China | High-income countries | Europe | European Union | Southern Europe | Oceania | |
| 2022 | 4.54 | 2.81 | 2.48 | 2.41 | 2.38 | 1.76 | 0.97 | 0.97 | 0.92 | 0.61 |
| 2021 | 4.44 | 2.78 | 2.46 | 2.4 | 2.37 | 1.69 | 0.87 | 0.87 | 0.82 | 0.63 |
| 2020 | 4.44 | 2.68 | 2.34 | 2.3 | 2.27 | 1.79 | 0.95 | 0.95 | 0.9 | 0.63 |
| 2019 | 4.3 | 2.59 | 2.26 | 2.23 | 2.2 | 1.75 | 0.94 | 0.94 | 0.88 | 0.6 |
| 2018 | 4.24 | 2.51 | 2.18 | 2.15 | 2.11 | 1.77 | 0.94 | 0.94 | 0.89 | 0.6 |
| 2017 | 3.99 | 2.51 | 2.16 | 2.14 | 2.1 | 1.53 | 0.86 | 0.86 | 0.8 | 0.44 |
| 2016 | 3.92 | 2.48 | 2.16 | 2.15 | 2.12 | 1.48 | 0.8 | 0.8 | 0.73 | 0.47 |
| 2015 | 4.06 | 2.56 | 2.23 | 2.22 | 2.19 | 1.54 | 0.87 | 0.87 | 0.8 | 0.44 |
| 2014 | 3.62 | 2.22 | 1.87 | 1.88 | 1.84 | 1.45 | 0.74 | 0.74 | 0.68 | 0.44 |
| 2013 | 3.46 | 2.1 | 1.81 | 1.81 | 1.77 | 1.4 | 0.67 | 0.66 | 0.6 | 0.4 |
| 2012 | 3.05 | 1.75 | 1.49 | 1.49 | 1.45 | 1.34 | 0.61 | 0.61 | 0.54 | 0.38 |
| 2011 | 2.91 | 1.53 | 1.29 | 1.29 | 1.26 | 1.41 | 0.66 | 0.66 | 0.58 | 0.42 |
| 2010 | 2.84 | 1.5 | 1.28 | 1.29 | 1.25 | 1.38 | 0.63 | 0.63 | 0.56 | 0.44 |
| 2009 | 2.79 | 1.49 | 1.27 | 1.3 | 1.25 | 1.35 | 0.66 | 0.66 | 0.59 | 0.39 |
| 2008 | 2.75 | 1.5 | 1.22 | 1.25 | 1.2 | 1.3 | 0.66 | 0.66 | 0.59 | 0.39 |
| 2007 | 2.55 | 1.39 | 1.22 | 1.24 | 1.2 | 1.21 | 0.58 | 0.58 | 0.52 | 0.37 |
| 2006 | 2.51 | 1.37 | 1.16 | 1.19 | 1.15 | 1.19 | 0.62 | 0.62 | 0.54 | 0.34 |
| 2005 | 2.34 | 1.24 | 1.11 | 1.14 | 1.1 | 1.14 | 0.59 | 0.59 | 0.51 | 0.32 |
| 2004 | 2.3 | 1.22 | 1.1 | 1.14 | 1.1 | 1.13 | 0.6 | 0.6 | 0.52 | 0.31 |
| 2003 | 2.02 | 1.17 | 1.06 | 1.1 | 1.05 | 0.9 | 0.46 | 0.46 | 0.39 | 0.24 |
| 2002 | 2.04 | 1.11 | 1 | 1.05 | 1 | 0.98 | 0.52 | 0.52 | 0.45 | 0.25 |
| 2001 | 1.98 | 1.06 | 0.95 | 1.01 | 0.95 | 0.98 | 0.49 | 0.49 | 0.42 | 0.27 |
| 2000 | 1.89 | 0.96 | 0.85 | 0.91 | 0.85 | 0.99 | 0.52 | 0.52 | 0.44 | 0.27 |
| 1999 | 0.94 | 0.1 | 0 | 0.05 | 0.9 | 0.49 | 0.49 | 0.41 | 0.22 | |
| 1998 | 0.91 | 0.09 | 0 | 0.05 | 0.88 | 0.4 | 0.4 | 0.33 | 0.24 | |
| 1997 | 0.9 | 0.09 | 0 | 0.05 | 0.87 | 0.39 | 0.39 | 0.32 | 0.25 | |
| 1996 | 0.98 | 0.08 | 0 | 0.06 | 0.95 | 0.49 | 0.49 | 0.41 | 0.23 | |
| 1995 | 0.92 | 0.08 | 0 | 0.06 | 0.9 | 0.46 | 0.46 | 0.38 | 0.23 | |
| 1994 | 0.95 | 0.08 | 0 | 0.06 | 0.93 | 0.49 | 0.49 | 0.41 | 0.23 | |
| 1993 | 0.9 | 0.06 | 0.06 | 0.9 | 0.46 | 0.46 | 0.38 | 0.24 | ||
| 1992 | 0.99 | 0.06 | 0.06 | 0.99 | 0.53 | 0.53 | 0.45 | 0.27 | ||
| 1991 | 0.79 | 0.05 | 0.05 | 0.79 | 0.41 | 0.41 | 0.35 | 0.24 | ||
| 1990 | 0.84 | 0.08 | 0.07 | 0.84 | 0.41 | 0.41 | 0.36 | 0.28 | ||
| 1989 | 0.61 | 0.05 | 0.05 | 0.61 | 0.31 | 0.31 | 0.26 | 0.19 | ||
| 1988 | 0.55 | 0.05 | 0.05 | 0.55 | 0.23 | 0.23 | 0.19 | 0.23 | ||
| 1987 | 0.42 | 0.03 | 0.03 | 0.42 | 0.15 | 0.15 | 0.12 | 0.2 | ||
| 1986 | 0.27 | 0.03 | 0.03 | 0.27 | 0.08 | 0.08 | 0.05 | 0.14 | ||
| 1985 | 0.2 | 0.04 | 0.04 | 0.2 | 0.04 | 0.04 | 0.03 | 0.11 | ||
| 1984 | 0.15 | 0.15 | 0.04 | 0.04 | 0.02 | 0.09 | ||||
| 1983 | 0.06 | 0.06 | 0.01 | 0.01 | 0 | 0.04 | ||||
| 1982 | 0.05 | 0.05 | 0.01 | 0.01 | 0 | 0.03 | ||||
| 1981 | 0.04 | 0.04 | 0.01 | 0.01 | 0 | 0.03 | ||||
| 1980 | 0.03 | 0.03 | 0 | 0 | 0 | 0.02 | ||||
| 1979 | 0.02 | 0.02 | 0 | 0 | 0.02 | |||||
| 1978 | 0.01 | 0.01 | 0 | 0 | 0.01 | |||||
| 1977 | 0.01 | 0.01 | 0 | 0 | 0.01 | |||||
| 1976 | 0.01 | 0.01 | 0.01 | |||||||
| 1975 | 0 | 0 | 0 | |||||||
| 1974 | 0.01 | 0.01 | 0.01 | |||||||
| 1973 | 0 | 0 | 0 | |||||||
| 1972 | 0 | 0 | 0 | |||||||
| 1971 | 0 | 0 | 0 | |||||||
| 1970 | 0 | 0 | 0 | |||||||
| 1969 | ||||||||||
| 1968 | ||||||||||
| 1967 | ||||||||||
| 1966 | ||||||||||
| 1965 | ||||||||||
| 1964 | ||||||||||
| 1963 | ||||||||||
| 1962 | ||||||||||
| 1961 | ||||||||||


Comments