
Abstract
Global strawberry production has shown significant growth over the past few decades. In 2022, China led the world with 3.36 million tons (Mt) of production, continuing its dominance in the sector. Historically, the U.S. and Mexico have been major producers, with California being a key region for U.S. production. The shift in global production patterns has seen countries like Spain and Poland also increasing their output. Technological advancements in farming, such as improved irrigation and greenhouse techniques, have contributed to higher yields. Additionally, the growing demand for strawberries, driven by consumer preferences for healthy and fresh produce, has spurred international growth.
Strawberry production (worldwide)
Since 1961, global strawberry production has seen steady growth, with China emerging as the leader by 2022, reaching a peak of 3.36 million tons (Mt). China’s rapid expansion reflects the country’s increasing agricultural output, supported by advanced farming techniques and extensive cultivation areas. Historically, the U.S. and Mexico were significant producers, with California being a major contributor. Over time, other countries, particularly in Europe, such as Spain and Poland, have boosted their production. The global rise in demand for fresh, healthy produce has further driven these trends.
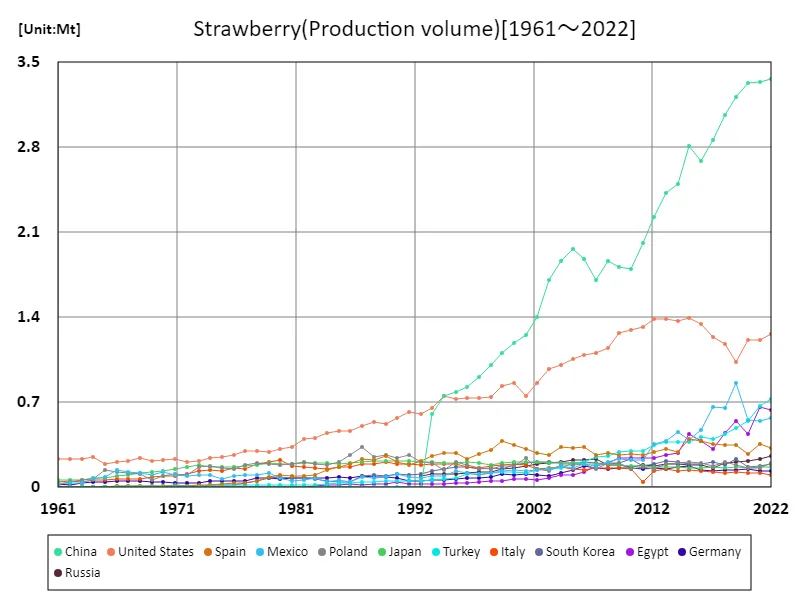
The maximum is the latest one, 3.36Mt of China
Strawberry production (latest year, countries around the world)
Global strawberry production in 2022 reached a total of 9.57 million tons (Mt), with China leading at a record 3.36 Mt, marking its peak production. The global average was 120,000 tons, highlighting the significant contribution of a few key countries. While China’s dominance continues to grow, traditional producers like the U.S. and Mexico remain influential, particularly in regions such as California. The increasing global demand for fresh, healthy produce, combined with advancements in farming techniques, has driven steady growth in strawberry production across various regions.
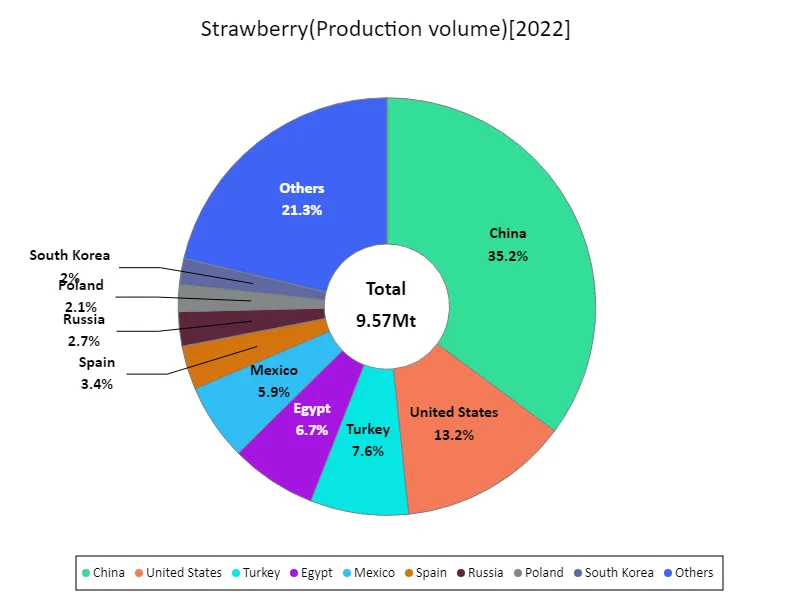
The maximum is 3.36Mt of China, the average is 120kt, and the total is 9.57Mt
Strawberry production (continent)
In 2022, global strawberry production reached a total of 9.57 million tons, with Asia leading at 4.59 million tons, marking its peak production. China, as the largest contributor in Asia, continues to dominate global output. Historically, the U.S. and Mexico have been key producers, particularly California. Over time, other countries in Asia and Europe, such as Spain and Poland, have expanded their production. This growth reflects the rising global demand for fresh strawberries, driven by health-conscious consumer preferences and advancements in agricultural practices.
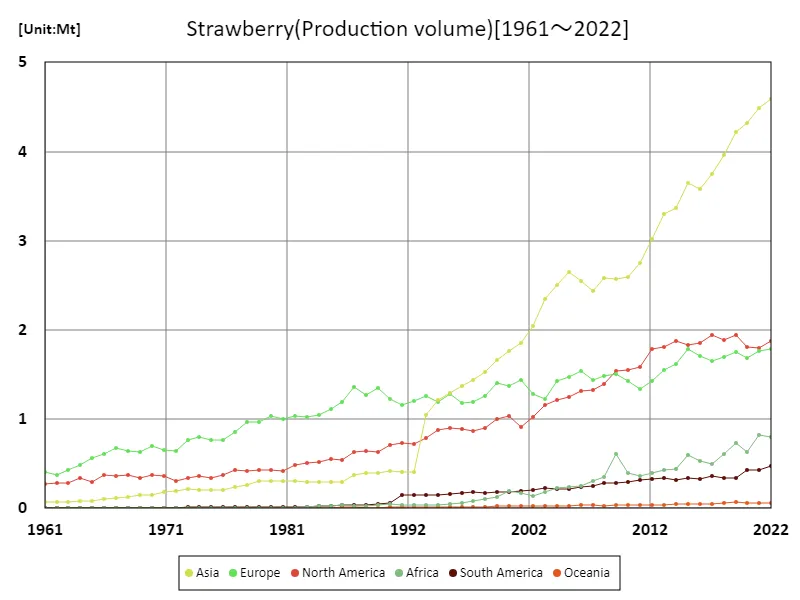
The maximum is the latest one, 4.59Mt of Asia
Strawberry production (latest year, continent)
In 2022, global strawberry production totaled 9.57 million tons, with Asia leading at 4.59 million tons, the highest regional production. The average for strawberry-producing regions was 1.59 million tons. Asia’s dominance is largely driven by China, which remains the largest global producer. Historically, the U.S. and Mexico have been key contributors, particularly from California. Over time, other regions, including Europe, have increased production. The steady rise in demand for fresh, healthy produce, alongside agricultural advancements, continues to fuel growth in strawberry cultivation worldwide.
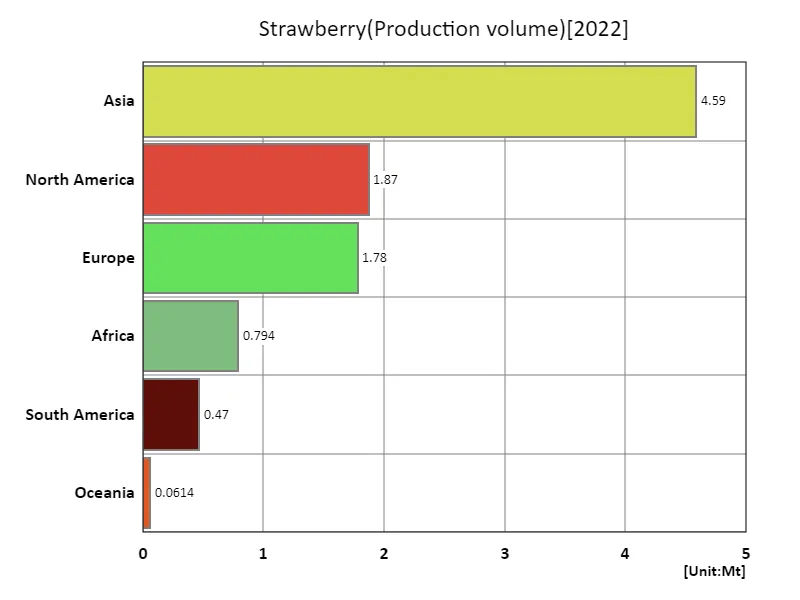
The maximum is 4.59Mt of Asia, the average is 1.59Mt, and the total is 9.57Mt
Main data
| Production(Strawberry, Production volume, t) [Mt] | ||||||||||
|---|---|---|---|---|---|---|---|---|---|---|
| World | Upper-middle-income countries | Asia | Eastern Asia | China | High-income countries | Americas | North America | Europe | Northern America | |
| 2022 | 9.57 | 5.54 | 4.59 | 3.72 | 3.36 | 3.1 | 2.34 | 1.87 | 1.78 | 1.29 |
| 2021 | 9.36 | 5.38 | 4.48 | 3.68 | 3.34 | 3.02 | 2.23 | 1.8 | 1.76 | 1.24 |
| 2020 | 8.94 | 5.23 | 4.32 | 3.65 | 3.33 | 2.94 | 2.24 | 1.81 | 1.68 | 1.23 |
| 2019 | 9.05 | 5.25 | 4.22 | 3.61 | 3.21 | 2.94 | 2.28 | 1.94 | 1.75 | 1.06 |
| 2018 | 8.56 | 4.84 | 3.97 | 3.41 | 3.07 | 2.98 | 2.23 | 1.88 | 1.7 | 1.21 |
| 2017 | 8.25 | 4.58 | 3.75 | 3.23 | 2.86 | 3.04 | 2.3 | 1.94 | 1.65 | 1.27 |
| 2016 | 8.06 | 4.21 | 3.58 | 3.04 | 2.69 | 3.17 | 2.19 | 1.86 | 1.71 | 1.37 |
| 2015 | 8.24 | 4.24 | 3.65 | 3.16 | 2.81 | 3.28 | 2.17 | 1.83 | 1.78 | 1.42 |
| 2014 | 7.66 | 3.93 | 3.37 | 2.87 | 2.5 | 3.14 | 2.19 | 1.87 | 1.61 | 1.39 |
| 2013 | 7.46 | 3.81 | 3.3 | 2.81 | 2.43 | 3.08 | 2.15 | 1.8 | 1.55 | 1.41 |
| 2012 | 6.99 | 3.52 | 3.02 | 2.58 | 2.23 | 2.97 | 2.11 | 1.78 | 1.42 | 1.41 |
| 2011 | 6.39 | 3.14 | 2.75 | 2.36 | 2.02 | 2.79 | 1.9 | 1.58 | 1.34 | 1.34 |
| 2010 | 6.3 | 2.88 | 2.59 | 2.21 | 1.8 | 2.92 | 1.85 | 1.55 | 1.43 | 1.31 |
| 2009 | 6.54 | 2.9 | 2.57 | 2.2 | 1.81 | 2.93 | 1.82 | 1.54 | 1.5 | 1.29 |
| 2008 | 6.11 | 2.88 | 2.58 | 2.25 | 1.86 | 2.8 | 1.67 | 1.39 | 1.48 | 1.17 |
| 2007 | 5.78 | 2.69 | 2.44 | 2.1 | 1.7 | 2.7 | 1.57 | 1.32 | 1.44 | 1.13 |
| 2006 | 5.93 | 2.84 | 2.55 | 2.28 | 1.88 | 2.76 | 1.55 | 1.32 | 1.54 | 1.11 |
| 2005 | 5.85 | 2.82 | 2.65 | 2.36 | 1.96 | 2.68 | 1.46 | 1.25 | 1.47 | 1.08 |
| 2004 | 5.61 | 2.67 | 2.5 | 2.27 | 1.87 | 2.61 | 1.42 | 1.21 | 1.43 | 1.03 |
| 2003 | 5.16 | 2.46 | 2.34 | 2.11 | 1.7 | 2.41 | 1.38 | 1.16 | 1.22 | 1 |
| 2002 | 4.73 | 2.14 | 2.04 | 1.82 | 1.4 | 2.34 | 1.23 | 1.03 | 1.28 | 0.88 |
| 2001 | 4.58 | 1.91 | 1.85 | 1.67 | 1.26 | 2.4 | 1.1 | 0.91 | 1.44 | 0.78 |
| 2000 | 4.58 | 1.84 | 1.76 | 1.57 | 1.19 | 2.46 | 1.22 | 1.04 | 1.38 | 0.89 |
| 1999 | 4.4 | 1.73 | 1.66 | 1.46 | 1.11 | 2.41 | 1.19 | 1.01 | 1.41 | 0.86 |
| 1998 | 3.98 | 1.57 | 1.52 | 1.34 | 1 | 2.17 | 1.07 | 0.9 | 1.25 | 0.77 |
| 1997 | 3.78 | 1.45 | 1.43 | 1.26 | 0.9 | 2.13 | 1.05 | 0.87 | 1.19 | 0.77 |
| 1996 | 3.7 | 1.38 | 1.37 | 1.21 | 0.83 | 2.13 | 1.06 | 0.89 | 1.19 | 0.77 |
| 1995 | 3.68 | 1.29 | 1.29 | 1.15 | 0.78 | 2.23 | 1.06 | 0.9 | 1.28 | 0.76 |
| 1994 | 3.49 | 1.21 | 1.22 | 1.1 | 0.76 | 2.15 | 1.03 | 0.88 | 1.19 | 0.78 |
| 1993 | 3.29 | 1.06 | 1.05 | 0.95 | 0.61 | 2.1 | 0.94 | 0.79 | 1.26 | 0.69 |
| 1992 | 2.52 | 0.44 | 0.41 | 0.32 | 0 | 1.91 | 0.86 | 0.72 | 1.2 | 0.64 |
| 1991 | 2.49 | 0.46 | 0.4 | 0.32 | 0 | 1.95 | 0.88 | 0.74 | 1.16 | 0.64 |
| 1990 | 2.46 | 0.4 | 0.41 | 0.33 | 0 | 1.97 | 0.76 | 0.71 | 1.23 | 0.6 |
| 1989 | 2.46 | 0.4 | 0.4 | 0.32 | 0 | 1.99 | 0.68 | 0.63 | 1.35 | 0.54 |
| 1988 | 2.38 | 0.37 | 0.39 | 0.33 | 0 | 1.95 | 0.68 | 0.64 | 1.27 | 0.57 |
| 1987 | 2.44 | 0.36 | 0.37 | 0.31 | 0.01 | 2.01 | 0.66 | 0.63 | 1.36 | 0.54 |
| 1986 | 2.1 | 0.3 | 0.3 | 0.25 | 0.01 | 1.74 | 0.57 | 0.54 | 1.19 | 0.49 |
| 1985 | 2.02 | 0.31 | 0.29 | 0.25 | 0.01 | 1.67 | 0.58 | 0.55 | 1.11 | 0.5 |
| 1984 | 1.91 | 0.27 | 0.29 | 0.26 | 0.01 | 1.6 | 0.55 | 0.52 | 1.04 | 0.48 |
| 1983 | 1.87 | 0.3 | 0.3 | 0.27 | 0 | 1.53 | 0.53 | 0.51 | 1.02 | 0.43 |
| 1982 | 1.86 | 0.26 | 0.31 | 0.28 | 1.57 | 0.5 | 0.49 | 1.03 | 0.43 | |
| 1981 | 1.75 | 0.27 | 0.3 | 0.27 | 1.45 | 0.43 | 0.42 | 1 | 0.36 | |
| 1980 | 1.8 | 0.28 | 0.31 | 0.28 | 1.49 | 0.44 | 0.42 | 1.03 | 0.35 | |
| 1979 | 1.73 | 0.28 | 0.3 | 0.27 | 1.42 | 0.45 | 0.43 | 0.97 | 0.31 | |
| 1978 | 1.68 | 0.3 | 0.26 | 0.23 | 1.36 | 0.44 | 0.42 | 0.97 | 0.32 | |
| 1977 | 1.54 | 0.31 | 0.24 | 0.21 | 1.21 | 0.44 | 0.42 | 0.86 | 0.32 | |
| 1976 | 1.36 | 0.25 | 0.21 | 0.19 | 1.09 | 0.38 | 0.37 | 0.76 | 0.28 | |
| 1975 | 1.32 | 0.23 | 0.2 | 0.18 | 1.06 | 0.35 | 0.34 | 0.76 | 0.27 | |
| 1974 | 1.39 | 0.27 | 0.21 | 0.18 | 1.09 | 0.37 | 0.36 | 0.8 | 0.26 | |
| 1973 | 1.34 | 0.27 | 0.22 | 0.2 | 1.04 | 0.35 | 0.34 | 0.77 | 0.23 | |
| 1972 | 1.17 | 0.23 | 0.2 | 0.18 | 0.91 | 0.32 | 0.31 | 0.65 | 0.22 | |
| 1971 | 1.22 | 0.28 | 0.18 | 0.16 | 0.9 | 0.37 | 0.36 | 0.66 | 0.26 | |
| 1970 | 1.23 | 0.32 | 0.15 | 0.14 | 0.88 | 0.38 | 0.37 | 0.69 | 0.24 | |
| 1969 | 1.13 | 0.26 | 0.15 | 0.13 | 0.83 | 0.34 | 0.34 | 0.63 | 0.24 | |
| 1968 | 1.15 | 0.29 | 0.13 | 0.12 | 0.84 | 0.38 | 0.37 | 0.64 | 0.26 | |
| 1967 | 1.16 | 0.29 | 0.12 | 0.11 | 0.84 | 0.37 | 0.36 | 0.68 | 0.23 | |
| 1966 | 1.1 | 0.27 | 0.11 | 0.1 | 0.8 | 0.38 | 0.37 | 0.61 | 0.23 | |
| 1965 | 0.96 | 0.19 | 0.09 | 0.08 | 0.74 | 0.3 | 0.29 | 0.57 | 0.21 | |
| 1964 | 0.91 | 0.17 | 0.08 | 0.08 | 0.72 | 0.34 | 0.34 | 0.48 | 0.27 | |
| 1963 | 0.79 | 0.14 | 0.07 | 0.06 | 0.63 | 0.28 | 0.28 | 0.43 | 0.25 | |
| 1962 | 0.74 | 0.12 | 0.07 | 0.06 | 0.6 | 0.29 | 0.28 | 0.38 | 0.25 | |
| 1961 | 0.75 | 0.14 | 0.07 | 0.06 | 0.59 | 0.27 | 0.27 | 0.41 | 0.24 | |


Comments