
Abstract
Grape production is one of the most important agricultural crops globally, and data from 2022 confirms that China is the largest producer. China recorded an impressive production of 12.7 megatons (mt). This reflects the fact that China’s vast farmland and diverse climatic conditions are suitable for grape cultivation. Meanwhile, other major producers include European Union countries, especially Italy, France, and Spain, which boast high production. These countries are historical grape growing regions and have been working to improve grape quality and innovate cultivation techniques for many years. In addition, emerging wine producing countries such as the United States and Chile have also rapidly increased production in recent years. This is in response to the expansion of the global wine market and increasing demand, and looking ahead, climate change and environmental issues may affect grape production. Therefore, the adoption of sustainable cultivation methods and technological innovation will become increasingly important.
Grape production (worldwide)
Grape production has been increasing globally for a long time. China, in particular, has seen steady growth from 1961 to 2021, reaching a historic peak of 15.1 megatons in 2021. Although China’s production has fallen to 84.1% compared to its peak, it still produces the most grapes in the world. Meanwhile, among other major producing countries, European Union countries have played an important role in grape cultivation and production. Italy, France, and Spain in particular are known as traditional wine-producing regions and produce high-quality grapes. In addition, in recent years, emerging wine-producing countries such as the United States and Chile have rapidly increased their production. This is to meet the increasing global demand for wine, and grape production and demand are closely related. However, the effects of climate change and environmental changes must also be taken into account. These factors may affect future grape production, making it important to adopt sustainable agricultural practices and innovate technologically.
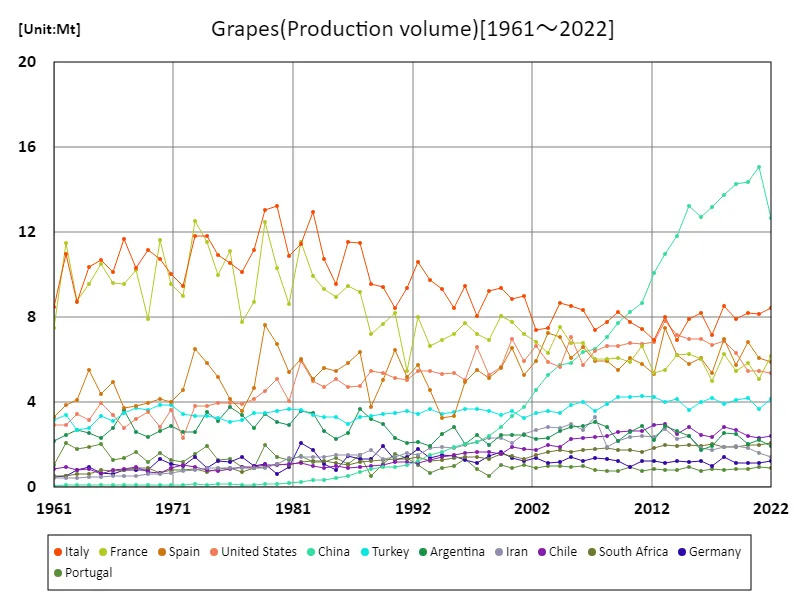
The maximum is 15.1Mt[2021] of China, and the current value is about 84.1%
Grape production (latest year, world)
It is noteworthy that as of 2022, China is the largest producer of grapes in global agriculture. China’s production is 12.7 megatons, which is about 17% of the world’s total grape production. This figure also shows that China plays a major role in grape production. Meanwhile, the average global grape production is 781 kilotons, which indicates that grape cultivation is widespread around the world. In addition, the total production is 74.9 megatons, which shows that the global grape industry is quite large. This data shows that grapes are in high demand and are widely cultivated in many countries around the world. Grapes are used for many products such as wine and juice, and the demand is continuously increasing. However, factors such as climate change and environmental changes may also affect grape production. Therefore, the adoption of sustainable agricultural practices and technological innovation will become increasingly important in the future.
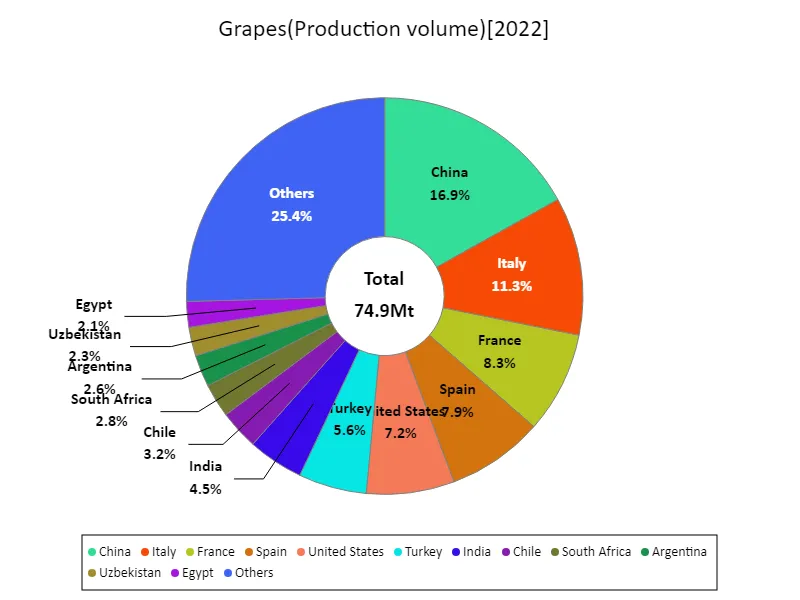
The maximum is 12.7Mt of China, the average is 781kt, and the total is 74.9Mt
Grape production (continent)
Grape production in 2022 increased year-on-year across the world, with Europe in particular showing remarkable growth. Grape production across Europe reached a record high of 49.6 megatons, which accounts for the majority of the world’s total grape production. This increase can be attributed mainly to improved climatic conditions and advances in agricultural technology. In particular, traditional grape-producing countries such as France, Italy and Spain achieved large harvests. These countries have a long history and rich viticultural tradition and are world-renowned for the production of wine and other grape products. However, there is also growing concern about the effects of climate change and the sustainability of agriculture. This may lead to uncertainties in future grape production. It is therefore important to adopt sustainable agricultural practices and invest in research and development. Such efforts are expected to stabilize grape production and promote quality improvements and environmental considerations.
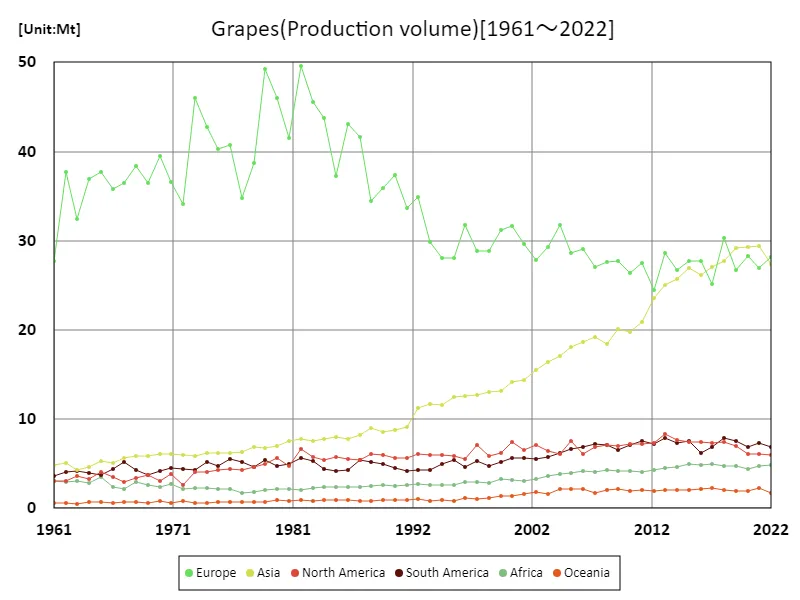
The maximum is 49.6Mt[1982] of Europe, and the current value is about 56.7%
Grape production (latest year, continental)
Europe accounted for the largest share of grape production worldwide in 2022. European grape production reached 28.1 megatons, accounting for approximately 37.5% of the world’s total grape production. This figure also shows that Europe plays a central role in grape production. One of the reasons for this is that Europe’s climatic conditions and long agricultural history are suitable for growing grapes. On the other hand, the average global grape production is 12.5 megatons, which indicates that grape cultivation is widespread around the world. In addition, the total production is 74.9 megatons, which indicates that grape production is quite large worldwide. This reflects the fact that grapes are used for various products such as wine and juice, and that the demand for them is stable and high. However, factors such as climate change and environmental changes may also affect grape production. To address these risks, the adoption of sustainable agricultural practices and technological innovation will become increasingly important.
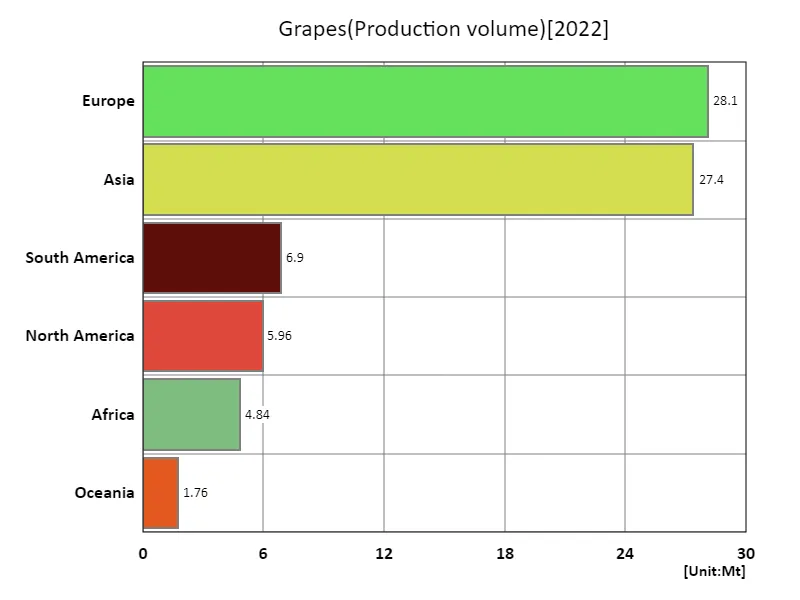
The maximum is 28.1Mt of Europe, the average is 12.5Mt, and the total is 74.9Mt
Main data
| Production(Grapes, Production volume, t) [Mt] | ||||||||||
|---|---|---|---|---|---|---|---|---|---|---|
| World | High-income countries | Europe | Upper-middle-income countries | Asia | European Union | Southern Europe | Eastern Asia | Americas | China | |
| 2022 | 74.94 | 35.85 | 28.13 | 27.74 | 27.35 | 25.58 | 16.95 | 12.99 | 12.86 | 12.67 |
| 2021 | 76.75 | 35.34 | 26.9 | 29.92 | 29.44 | 24.6 | 16.95 | 15.4 | 13.39 | 15.07 |
| 2020 | 76.83 | 36.52 | 28.26 | 29.21 | 29.35 | 25.97 | 17.68 | 14.72 | 12.91 | 14.39 |
| 2019 | 77.05 | 35.97 | 26.73 | 29.34 | 29.15 | 24.22 | 16.21 | 14.62 | 14.51 | 14.28 |
| 2018 | 80.1 | 40.13 | 30.3 | 28.49 | 27.67 | 27.63 | 18.2 | 14.11 | 15.32 | 13.76 |
| 2017 | 73.6 | 34.78 | 25.14 | 27.47 | 27.11 | 22.78 | 15.06 | 13.54 | 14.18 | 13.18 |
| 2016 | 74.52 | 37.62 | 27.7 | 25.93 | 26.11 | 25.22 | 16.88 | 13.12 | 13.68 | 12.71 |
| 2015 | 76.59 | 37.92 | 27.77 | 27.23 | 26.88 | 25.44 | 16.73 | 13.65 | 14.97 | 13.25 |
| 2014 | 73.91 | 36.93 | 26.67 | 26.1 | 25.69 | 24.43 | 15.82 | 12.27 | 14.9 | 11.81 |
| 2013 | 76.51 | 39.74 | 28.64 | 25.63 | 25.01 | 26.16 | 17.98 | 11.39 | 16.21 | 10.98 |
| 2012 | 68.97 | 34.98 | 24.51 | 23.78 | 23.6 | 22.41 | 14.75 | 10.58 | 14.6 | 10.11 |
| 2011 | 69.17 | 37.31 | 27.45 | 22.94 | 20.92 | 24.98 | 15.76 | 9.08 | 14.7 | 8.68 |
| 2010 | 66.7 | 36.54 | 26.43 | 21.84 | 19.82 | 24.27 | 16.65 | 8.73 | 14.28 | 8.24 |
| 2009 | 67.65 | 37.4 | 27.67 | 21.18 | 20.09 | 25.19 | 16.47 | 8.23 | 13.58 | 7.75 |
| 2008 | 66.59 | 37.31 | 27.63 | 20.86 | 18.47 | 25.36 | 16.29 | 7.6 | 14.13 | 7.07 |
| 2007 | 66.18 | 36.24 | 27.05 | 20.34 | 19.25 | 24.9 | 15.91 | 7.07 | 14.1 | 6.53 |
| 2006 | 66.98 | 38.34 | 29.08 | 19.68 | 18.62 | 27.18 | 17.77 | 6.91 | 12.96 | 6.37 |
| 2005 | 66.98 | 39.07 | 28.64 | 18.68 | 18.05 | 26.6 | 17.31 | 6.47 | 14.17 | 5.87 |
| 2004 | 67.21 | 40.22 | 31.78 | 18.18 | 17.12 | 29.53 | 18.63 | 6.35 | 12.29 | 5.77 |
| 2003 | 63.05 | 37.05 | 29.25 | 17.45 | 16.41 | 26.84 | 17.59 | 5.87 | 12.15 | 5.27 |
| 2002 | 61.16 | 37.03 | 27.84 | 16 | 15.56 | 25.9 | 15.8 | 5.22 | 12.6 | 4.56 |
| 2001 | 60.86 | 37.99 | 29.61 | 14.97 | 14.43 | 27.73 | 17.07 | 4.44 | 12.15 | 3.77 |
| 2000 | 63.55 | 40.61 | 31.69 | 15.24 | 14.13 | 29.42 | 18.02 | 4.09 | 13.12 | 3.37 |
| 1999 | 60.48 | 39.19 | 31.24 | 14.12 | 13.11 | 29.63 | 17.76 | 3.51 | 11.49 | 2.81 |
| 1998 | 56.43 | 36.15 | 28.82 | 13 | 13.02 | 27.18 | 16.98 | 3.05 | 10.52 | 2.43 |
| 1997 | 57.96 | 36.91 | 28.87 | 13.9 | 12.66 | 27.01 | 16.6 | 2.76 | 12.49 | 2.11 |
| 1996 | 58.63 | 37.76 | 31.78 | 13.67 | 12.64 | 29.29 | 17.78 | 2.62 | 10.15 | 2.02 |
| 1995 | 55.38 | 34.04 | 28.11 | 14.62 | 12.44 | 25.75 | 14.64 | 2.46 | 11.39 | 1.9 |
| 1994 | 54.08 | 34.25 | 28.09 | 13.37 | 11.53 | 25.91 | 15.39 | 2.14 | 10.9 | 1.68 |
| 1993 | 55.29 | 35.47 | 29.86 | 13.19 | 11.75 | 27.25 | 16.79 | 1.94 | 10.26 | 1.52 |
| 1992 | 60.27 | 39.8 | 34.85 | 13.94 | 11.26 | 31.87 | 19.95 | 1.68 | 10.36 | 1.25 |
| 1991 | 56.07 | 34.44 | 33.66 | 16.95 | 9.16 | 27.02 | 18.84 | 1.45 | 9.78 | 1.03 |
| 1990 | 59.75 | 37.72 | 37.35 | 17.72 | 8.77 | 30.21 | 18.79 | 1.37 | 10.2 | 0.96 |
| 1989 | 58.82 | 37.28 | 35.86 | 17.36 | 8.59 | 29.59 | 18.25 | 1.41 | 10.9 | 0.98 |
| 1988 | 58.13 | 34.91 | 34.46 | 18.48 | 9.01 | 27.43 | 16.58 | 1.33 | 11.32 | 0.88 |
| 1987 | 63.97 | 40.9 | 41.67 | 18.92 | 8.23 | 34.21 | 22.19 | 1.17 | 10.85 | 0.71 |
| 1986 | 64.05 | 41.55 | 43.09 | 18.1 | 7.77 | 34.81 | 21.71 | 0.98 | 9.79 | 0.51 |
| 1985 | 58.67 | 37.69 | 37.26 | 16.69 | 8.03 | 30.48 | 19.14 | 0.91 | 9.97 | 0.45 |
| 1984 | 64.51 | 40.39 | 43.8 | 20.17 | 7.72 | 33.98 | 20.79 | 0.8 | 9.72 | 0.36 |
| 1983 | 67.26 | 44.03 | 45.59 | 19.42 | 7.59 | 37.14 | 22.69 | 0.79 | 11 | 0.33 |
| 1982 | 72.56 | 47.36 | 49.57 | 21.48 | 7.74 | 39.56 | 22.38 | 0.67 | 12.28 | 0.24 |
| 1981 | 61.66 | 38.55 | 41.48 | 19.28 | 7.59 | 32.85 | 20.57 | 0.6 | 9.68 | 0.22 |
| 1980 | 66.49 | 44.52 | 46.02 | 18.53 | 7.01 | 37.62 | 24.57 | 0.54 | 10.39 | 0.16 |
| 1979 | 69.22 | 47.82 | 49.22 | 18.27 | 6.8 | 41.6 | 25.45 | 0.58 | 10.45 | 0.17 |
| 1978 | 57.36 | 37.38 | 38.67 | 16.92 | 6.87 | 31.87 | 19.44 | 0.5 | 9.27 | 0.12 |
| 1977 | 53.16 | 34.59 | 34.83 | 15.49 | 6.35 | 29.04 | 17.35 | 0.49 | 9.48 | 0.1 |
| 1976 | 59.64 | 39.07 | 40.77 | 17.32 | 6.16 | 33.86 | 18.77 | 0.5 | 9.84 | 0.13 |
| 1975 | 58.36 | 39.04 | 40.29 | 16.14 | 6.18 | 33.65 | 20.02 | 0.47 | 9 | 0.14 |
| 1974 | 61.04 | 41.77 | 42.74 | 15.83 | 6.15 | 36.9 | 22.32 | 0.48 | 9.27 | 0.12 |
| 1973 | 63.18 | 44.56 | 46.04 | 15.49 | 5.86 | 39.68 | 22.83 | 0.46 | 8.39 | 0.13 |
| 1972 | 50.1 | 34.02 | 34.09 | 13 | 5.94 | 29.99 | 17.78 | 0.44 | 7.03 | 0.12 |
| 1971 | 54.3 | 35.58 | 36.53 | 15.34 | 6.09 | 30.86 | 17.96 | 0.4 | 8.41 | 0.12 |
| 1970 | 55.94 | 38.13 | 39.52 | 14.58 | 6.05 | 34.22 | 19.22 | 0.36 | 7.22 | 0.1 |
| 1969 | 52.97 | 34.87 | 36.46 | 14.92 | 5.89 | 30.7 | 19.57 | 0.38 | 7.47 | 0.1 |
| 1968 | 55.39 | 36.61 | 38.33 | 15.39 | 5.85 | 32.46 | 18.85 | 0.4 | 7.67 | 0.11 |
| 1967 | 53.18 | 35.85 | 36.45 | 14.44 | 5.66 | 31.73 | 19.38 | 0.38 | 8.16 | 0.09 |
| 1966 | 51.8 | 35.52 | 35.82 | 13.32 | 5.1 | 31.13 | 19.16 | 0.35 | 7.93 | 0.1 |
| 1965 | 55.08 | 37.37 | 37.72 | 13.63 | 5.26 | 32.8 | 19.72 | 0.35 | 7.84 | 0.1 |
| 1964 | 52.35 | 37.27 | 36.96 | 11.59 | 4.63 | 32.91 | 20.37 | 0.32 | 7.3 | 0.1 |
| 1963 | 48.03 | 32.57 | 32.41 | 11.84 | 4.26 | 28.47 | 16.96 | 0.27 | 7.77 | 0.09 |
| 1962 | 53.44 | 37.53 | 37.67 | 12.32 | 5.12 | 33.49 | 19.7 | 0.29 | 7.09 | 0.09 |
| 1961 | 42.99 | 28.76 | 27.76 | 10.47 | 4.87 | 24.49 | 15.25 | 0.25 | 6.74 | 0.07 |


Comments