Abstract
The volume of orange imports in global agriculture fluctuates due to a wide range of factors. According to 2021 data, the United States is the largest importer, importing 8.31 Mt. Based on past trends, the demand for oranges is influenced by consumer preferences and economic conditions, as well as climatic conditions and the political situation of producing countries. In addition, changes in consumption patterns, such as increased health consciousness and increased demand for processed products, also affect the import volume. In addition, changes in global trade policies and responses to environmental issues are also considered as factors that affect the volume of orange imports. Overall, the orange import market is formed by a variety of factors, and a complex analysis is required to accurately predict its trends.
Orange imports (worldwide)
Looking at the data on orange imports, a long-term trend becomes clear. Over the past 60 years, global orange imports have increased. This is mainly due to changes in people’s diets and increased demand due to economic growth. In the case of the United States in particular, imports have doubled compared to their peak. This indicates that American consumers are increasingly placing importance on oranges and demand is expanding rapidly. In addition, global trade liberalization and technological innovation have improved the transportation and storage of oranges, stimulating trade in international markets. However, factors such as climate change and changes in agricultural policies mean that there is uncertainty about the supply volume of producing countries. As demand is expected to continue to grow, it will be important to establish sustainable agricultural production and effective supply chains.
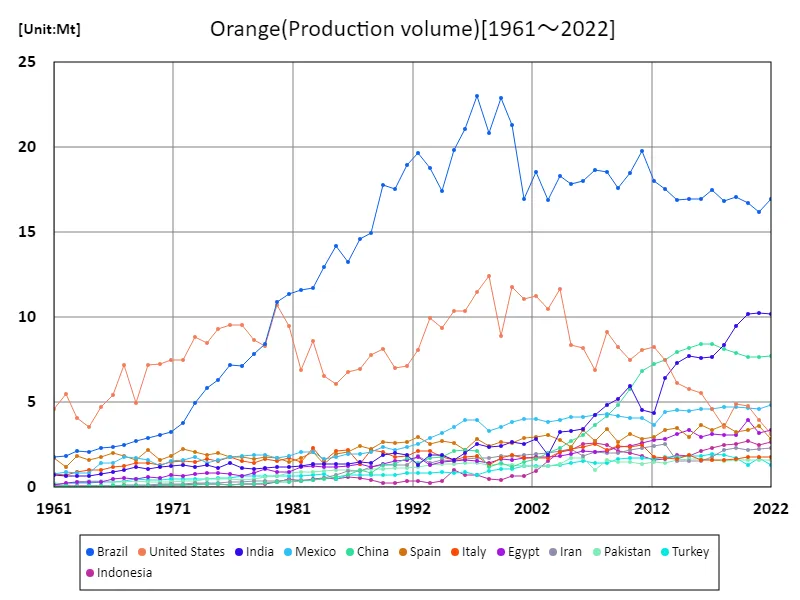
The maximum is 23Mt[1997] of Brazil, and the current value is about 73.5%
Orange imports (latest year, world)
Orange imports in global agriculture reached a total of 37.6Mt according to 2021 data. The United States was the largest importer, importing 8.31Mt. The average import volume was 204kt, suggesting the stable presence of global demand. Orange imports have been increasing over the past few decades. This is due to various factors, including people’s increasing health consciousness and demand for fruits, as well as the increasing demand for processed products. In addition, the liberalization of international trade and technological advances have improved the transportation and supply of oranges, expanding the market. On the other hand, the impact of climate change and weather irregularities are also factors to consider. Based on past trends, it appears that the orange import market is stable and the increase in demand is sustained. However, it is important to establish sustainable agricultural production and supply chains, and we need to prepare for future demand increases.
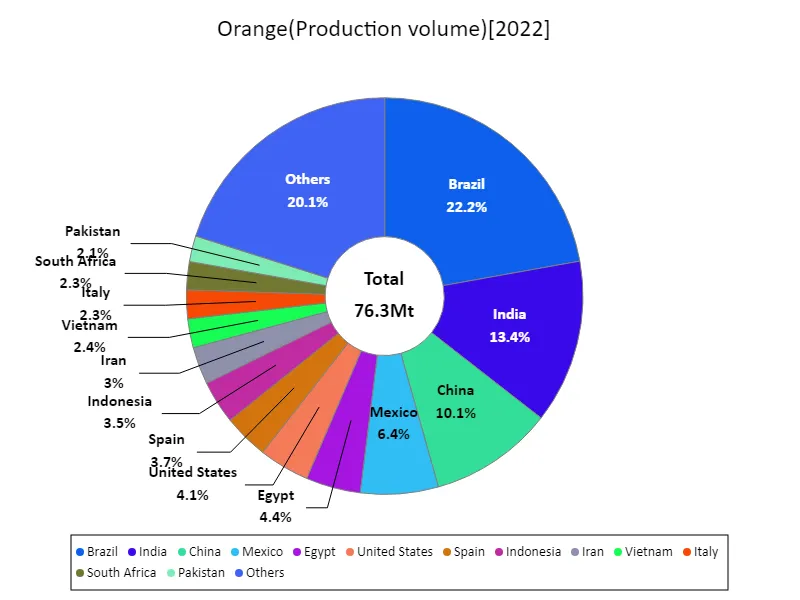
The maximum is 16.9Mt of Brazil, the average is 557kt, and the total is 76.3Mt
Orange imports (continent)
Europe’s orange imports in global agriculture reached a record high of 23.8 Mt in 2021. This data shows that Europe plays a leading role in the orange import market. A notable feature so far is the steady increase in demand for oranges in Europe. This is likely due to multiple factors, including an increase in health consciousness, an increase in demand for fruits, and an expansion of the processed product market. In addition, the European import market has been further stimulated by the liberalization of international trade and the development of logistics technology. However, supply-side uncertainties still exist due to factors such as climate change and changes in agricultural policies. In the future, the establishment of sustainable agricultural production and supply chains will become increasingly important, and strategic efforts will be required to meet demand.
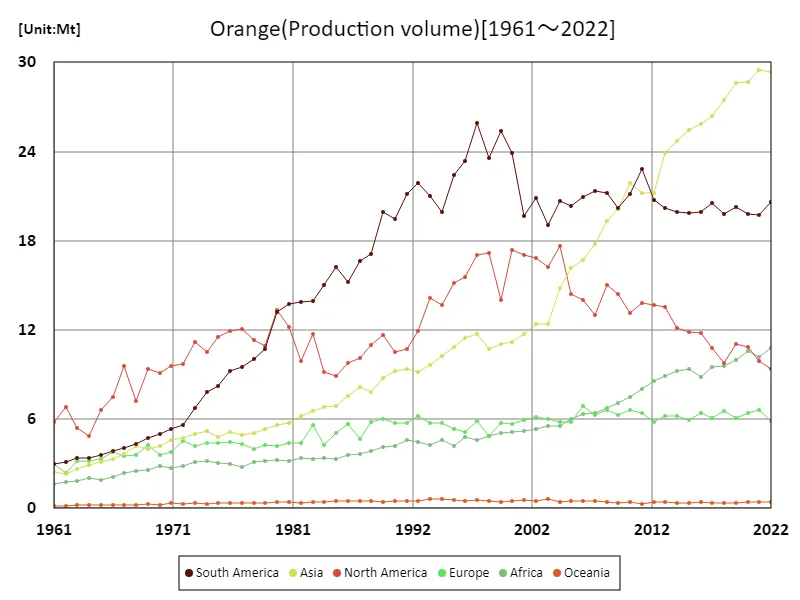
The maximum is 29.5Mt[2021] of Asia, and the current value is about 99.6%
Orange imports (latest year, continental)
The import volume of agricultural oranges in 2021 reached 37.6 Mt worldwide. Of this, Europe accounted for a large share of 20.9 Mt, the largest in the past data. This trend indicates that Europe is the main importer of oranges and its demand is steadily increasing. The average import volume of oranges was 6.26 Mt, which is an indicator of the stability of demand. The characteristics so far include the increasing global health consciousness and the expanding demand for fruits. In addition, the growth of the processed product market is also affecting the import volume of oranges. The liberalization of international trade and advances in logistics technology have also improved the transportation and supply of oranges, contributing to the expansion of the market. On the other hand, climate change and changes in agricultural policies are causing supply-side uncertainty. As demand is expected to continue to expand, it will be important to establish sustainable agricultural production and effective supply chains.
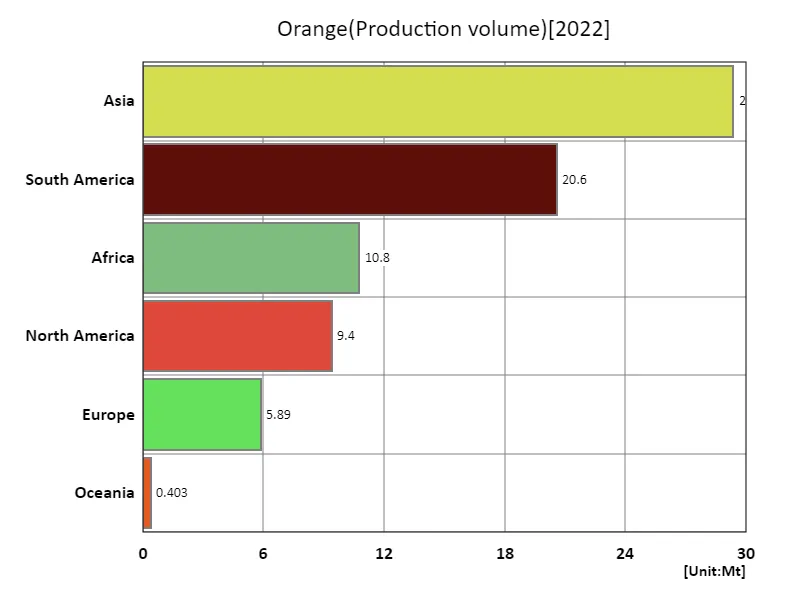
The maximum is 29.4Mt of Asia, the average is 12.7Mt, and the total is 76.4Mt
Main data
| Production(Orange, Production volume, t) [Mt] | ||||||||||
|---|---|---|---|---|---|---|---|---|---|---|
| World | Upper-middle-income countries | Americas | Asia | Lower-middle-income countries | South America | Brazil | Southern Asia | Africa | Net Food Importing Developing Countries | |
| 2022 | 76.41 | 39.83 | 30.02 | 29.35 | 24.82 | 20.62 | 16.93 | 14.21 | 10.75 | 10.46 |
| 2021 | 76.32 | 38.69 | 29.64 | 29.47 | 24.15 | 19.73 | 16.22 | 14.21 | 10.17 | 10.01 |
| 2020 | 76.68 | 38.59 | 30.66 | 28.65 | 24.13 | 19.8 | 16.72 | 14.06 | 10.59 | 10.45 |
| 2019 | 76.32 | 39.66 | 31.27 | 28.63 | 22.94 | 20.24 | 17.09 | 13.5 | 9.96 | 9.66 |
| 2018 | 73.48 | 39.72 | 29.52 | 27.45 | 21.02 | 19.77 | 16.84 | 12.21 | 9.59 | 9.16 |
| 2017 | 73.63 | 40.21 | 31.34 | 26.37 | 19.61 | 20.57 | 17.49 | 11.08 | 9.53 | 9.65 |
| 2016 | 73.24 | 39.27 | 31.74 | 25.84 | 18.9 | 19.96 | 16.98 | 10.88 | 8.86 | 9.41 |
| 2015 | 72.79 | 38.98 | 31.72 | 25.41 | 19.34 | 19.87 | 16.95 | 10.99 | 9.39 | 9.33 |
| 2014 | 72.52 | 38.85 | 32.01 | 24.71 | 18.63 | 19.9 | 16.93 | 10.54 | 9.26 | 9.08 |
| 2013 | 73.23 | 38.41 | 33.75 | 23.91 | 17.93 | 20.19 | 17.55 | 10.48 | 8.92 | 8.73 |
| 2012 | 70.44 | 37.74 | 34.43 | 21.23 | 15.8 | 20.74 | 18.01 | 8.42 | 8.59 | 8.83 |
| 2011 | 72.59 | 39.85 | 36.64 | 21.23 | 15.39 | 22.82 | 19.81 | 8.38 | 8.02 | 8.39 |
| 2010 | 70.67 | 37.13 | 34.26 | 21.89 | 16.41 | 21.11 | 18.5 | 9.76 | 7.49 | 8.23 |
| 2009 | 68.39 | 35.86 | 34.59 | 20.12 | 15.29 | 20.2 | 17.62 | 8.81 | 7.06 | 7.88 |
| 2008 | 69.32 | 36.21 | 36.22 | 19.29 | 14.64 | 21.19 | 18.54 | 8.59 | 6.77 | 7.6 |
| 2007 | 65.26 | 36.07 | 34.31 | 17.78 | 13.23 | 21.34 | 18.68 | 7.45 | 6.39 | 6.87 |
| 2006 | 65.4 | 34.8 | 34.95 | 16.73 | 12.94 | 20.91 | 18.03 | 7.11 | 6.33 | 7.51 |
| 2005 | 63.14 | 33.49 | 34.74 | 16.13 | 12.99 | 20.33 | 17.85 | 7.39 | 5.97 | 7.4 |
| 2004 | 64.94 | 33.08 | 38.36 | 14.79 | 12.03 | 20.69 | 18.31 | 6.84 | 5.55 | 6.89 |
| 2003 | 59.85 | 30.64 | 35.29 | 12.37 | 10.24 | 19.06 | 16.92 | 5.26 | 5.56 | 6.75 |
| 2002 | 62.07 | 31.54 | 37.74 | 12.37 | 10.87 | 20.9 | 18.53 | 6.12 | 5.33 | 6.3 |
| 2001 | 60.14 | 30.31 | 36.69 | 11.72 | 10.27 | 19.65 | 16.98 | 5.82 | 5.21 | 6.54 |
| 2000 | 63.85 | 33.59 | 41.3 | 11.21 | 10.41 | 23.91 | 21.33 | 5.92 | 5.12 | 6.59 |
| 1999 | 61.74 | 34.66 | 39.39 | 11.08 | 10.2 | 25.37 | 22.89 | 5.76 | 5.04 | 6.54 |
| 1998 | 61.67 | 32.01 | 40.74 | 10.69 | 9.95 | 23.56 | 20.85 | 5.49 | 4.88 | 6.38 |
| 1997 | 65.64 | 36.05 | 42.93 | 11.69 | 9.94 | 25.89 | 23.05 | 5.79 | 4.59 | 6.34 |
| 1996 | 60.77 | 33.39 | 38.93 | 11.44 | 9.64 | 23.39 | 21.08 | 5.2 | 4.82 | 6.42 |
| 1995 | 58.46 | 32.02 | 37.56 | 10.85 | 8.49 | 22.42 | 19.84 | 4.63 | 4.17 | 6.04 |
| 1994 | 54.81 | 28.33 | 33.6 | 10.24 | 8.91 | 19.9 | 17.45 | 4.93 | 4.61 | 6.22 |
| 1993 | 55.46 | 28.85 | 35.2 | 9.62 | 8.46 | 21.02 | 18.8 | 4.74 | 4.24 | 5.84 |
| 1992 | 54.07 | 29.01 | 33.75 | 9.16 | 8.43 | 21.86 | 19.68 | 4.42 | 4.49 | 6.04 |
| 1991 | 52 | 28.51 | 31.81 | 9.4 | 8.47 | 21.12 | 18.94 | 4.42 | 4.58 | 6.19 |
| 1990 | 49.7 | 26.34 | 30.03 | 9.26 | 8.18 | 19.49 | 17.52 | 4.57 | 4.16 | 5.84 |
| 1989 | 50.87 | 26.54 | 31.58 | 8.75 | 8.04 | 19.95 | 17.77 | 4.38 | 4.13 | 5.72 |
| 1988 | 46.05 | 23.38 | 28.1 | 7.8 | 7.1 | 17.12 | 14.98 | 3.74 | 3.83 | 5.39 |
| 1987 | 43.79 | 22.77 | 26.8 | 8.15 | 6.83 | 16.66 | 14.61 | 3.54 | 3.68 | 5.23 |
| 1986 | 42.23 | 21.15 | 25 | 7.53 | 6.56 | 15.19 | 13.23 | 3.35 | 3.57 | 5.12 |
| 1985 | 40.87 | 21.22 | 25.12 | 6.9 | 6.16 | 16.24 | 14.21 | 3.14 | 3.32 | 4.78 |
| 1984 | 38.98 | 20.07 | 24.17 | 6.83 | 5.99 | 14.99 | 12.94 | 2.9 | 3.36 | 4.75 |
| 1983 | 41.53 | 19.43 | 25.63 | 6.54 | 5.87 | 13.92 | 11.71 | 2.76 | 3.33 | 4.71 |
| 1982 | 38.12 | 18.88 | 23.78 | 6.21 | 5.71 | 13.88 | 11.6 | 2.63 | 3.38 | 4.56 |
| 1981 | 39.68 | 18.64 | 25.9 | 5.75 | 5.28 | 13.74 | 11.39 | 2.48 | 3.21 | 4.13 |
| 1980 | 40.01 | 17.65 | 26.57 | 5.58 | 5.23 | 13.22 | 10.89 | 2.27 | 3.27 | 4.06 |
| 1979 | 34.77 | 15.2 | 21.65 | 5.31 | 4.96 | 10.72 | 8.45 | 2.14 | 3.15 | 3.86 |
| 1978 | 33.86 | 14.37 | 21.31 | 5.09 | 4.76 | 10.02 | 7.83 | 1.99 | 3.13 | 3.74 |
| 1977 | 33.9 | 13.63 | 21.56 | 4.95 | 4.43 | 9.49 | 7.16 | 1.95 | 2.77 | 3.26 |
| 1976 | 34.03 | 13.02 | 21.12 | 5.15 | 4.81 | 9.2 | 7.17 | 2.25 | 2.96 | 3.28 |
| 1975 | 32.29 | 11.78 | 19.7 | 4.82 | 4.59 | 8.19 | 6.31 | 1.95 | 3.03 | 3.3 |
| 1974 | 31.43 | 11.14 | 18.33 | 5.21 | 4.84 | 7.82 | 5.86 | 2.07 | 3.17 | 3.4 |
| 1973 | 30.63 | 10.27 | 17.96 | 5.01 | 4.62 | 6.77 | 4.93 | 1.88 | 3.08 | 3.34 |
| 1972 | 27.7 | 8.97 | 15.28 | 4.76 | 4.36 | 5.58 | 3.79 | 1.91 | 2.85 | 3.08 |
| 1971 | 26.37 | 8.47 | 14.9 | 4.62 | 4.25 | 5.32 | 3.26 | 1.82 | 2.73 | 2.96 |
| 1970 | 24.92 | 7.94 | 14.1 | 4.16 | 4.21 | 4.99 | 3.1 | 1.74 | 2.82 | 3.03 |
| 1969 | 25.19 | 7.87 | 14.07 | 3.99 | 3.9 | 4.72 | 2.9 | 1.61 | 2.61 | 2.91 |
| 1968 | 22.02 | 7.69 | 11.56 | 4.17 | 3.89 | 4.34 | 2.72 | 1.76 | 2.48 | 2.79 |
| 1967 | 23.44 | 7.39 | 13.62 | 3.64 | 3.59 | 4.08 | 2.5 | 1.51 | 2.39 | 2.7 |
| 1966 | 20.77 | 6.69 | 11.3 | 3.32 | 3.29 | 3.85 | 2.35 | 1.38 | 2.14 | 2.51 |
| 1965 | 18.76 | 6.27 | 10.17 | 3.12 | 2.9 | 3.56 | 2.29 | 1.25 | 1.9 | 2.21 |
| 1964 | 16.6 | 5.49 | 8.26 | 2.91 | 2.9 | 3.37 | 2.05 | 1.16 | 2.05 | 2.27 |
| 1963 | 16.65 | 5.47 | 8.76 | 2.67 | 2.62 | 3.37 | 2.11 | 1.07 | 1.84 | 2.02 |
| 1962 | 16.62 | 5.14 | 9.94 | 2.33 | 2.43 | 3.12 | 1.85 | 0.96 | 1.8 | 1.83 |
| 1961 | 15.97 | 4.8 | 8.77 | 2.42 | 2.41 | 2.99 | 1.76 | 1.1 | 1.61 | 1.76 |


Comments