
Abstract
The Philippines is characterized by having the largest share of pineapple exports in global agriculture. According to 2021 data, the Philippines exported 4.1Mt of pineapples, far ahead of other countries. This is likely due to the Philippines’ climatic conditions and advances in agricultural technology. Other major producers include Costa Rica and Thailand, which also have a certain share in pineapple production and exports. Meanwhile, demand for pineapples is stable and their global popularity is increasing. Based on past trends, it is expected that pineapple production and exports led by the Philippines will continue in the future, but other countries may also strengthen their competition.
Pineapple exports (worldwide)
Pineapple exports have been on the rise globally between 1961 and 2021. In particular, in recent years, the Philippines has stood out as a major exporter, reaching an all-time high of 4.1 Mt in 2021, double the figure from the previous peak. This growth is likely due to efficiency gains and technological innovations in the Philippine agricultural sector. Meanwhile, other major producing countries are also showing an upward trend, suggesting that global demand for pineapples is expanding. In addition, environmental changes and the impact of trade policies are also factors to consider. Pineapple production and exports are expected to continue to grow in the future, but will require the adoption of sustainable agricultural practices and responding to changing market needs.
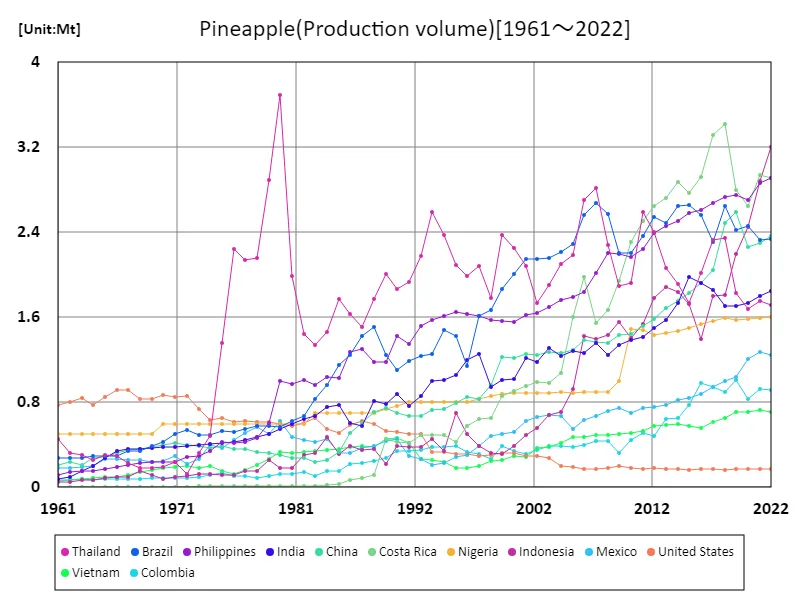
The maximum is 3.69Mt[1980] of Thailand, and the current value is about 46.5%
Pineapple exports (latest year, countries around the world)
Exports of agricultural pineapples occupy an important position globally in 2021. The Philippines is the largest exporter, exporting 4.1 Mt, far ahead of other countries in terms of share. This is likely due to the country’s climatic conditions and development of agricultural technology. Meanwhile, other major producing countries are also actively entering the market, suggesting that global demand for pineapples is expanding. The average export volume of 93.1 kt and the total figure of 13.3 Mt also show that pineapples occupy an important position in the international market. This trend reflects the fact that pineapples are widely loved by consumers and are used in a variety of dishes and beverages. Pineapple production and exports are expected to continue to grow steadily in the future, but the adoption of sustainable agricultural practices and measures against the effects of climate change are required.
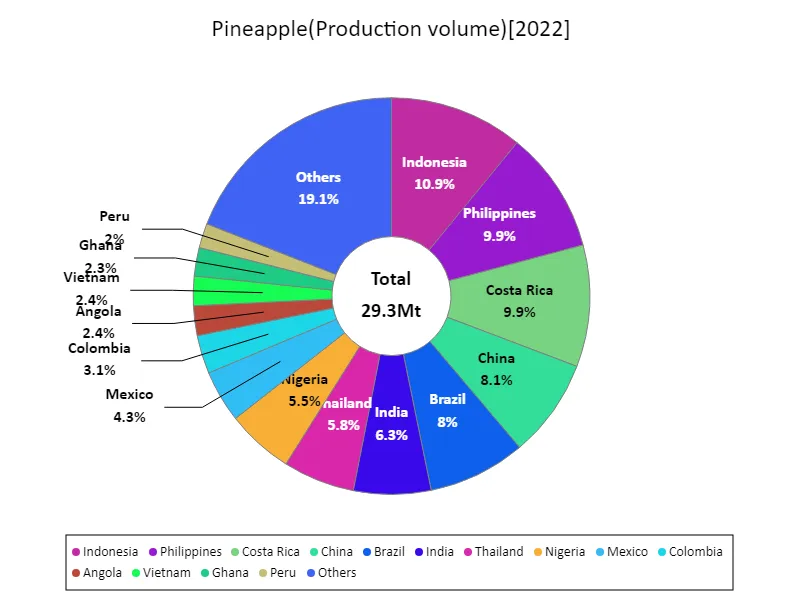
The maximum is 3.2Mt of Indonesia, the average is 341kt, and the total is 29.3Mt
Pineapple exports (continent)
Asia stands out as the largest export region for agricultural pineapple exports in 2021. Exports across Asia reached 6.19 Mt, a new record high. This growth is likely due to the development of the agricultural sector and technological innovations in Asian countries. In particular, major producing countries such as the Philippines and Thailand are likely to contribute significantly. Meanwhile, other regions are also increasing exports, suggesting that global demand for pineapple is expanding. This increase in demand is likely due to the health benefits of pineapple and its adaptability to various uses. In addition, the impact of environmental changes and trade policies are also factors to consider. Pineapple production and exports are expected to continue to grow, especially in Asia, but there will be a demand to adopt sustainable agricultural practices and adapt to changing market needs.
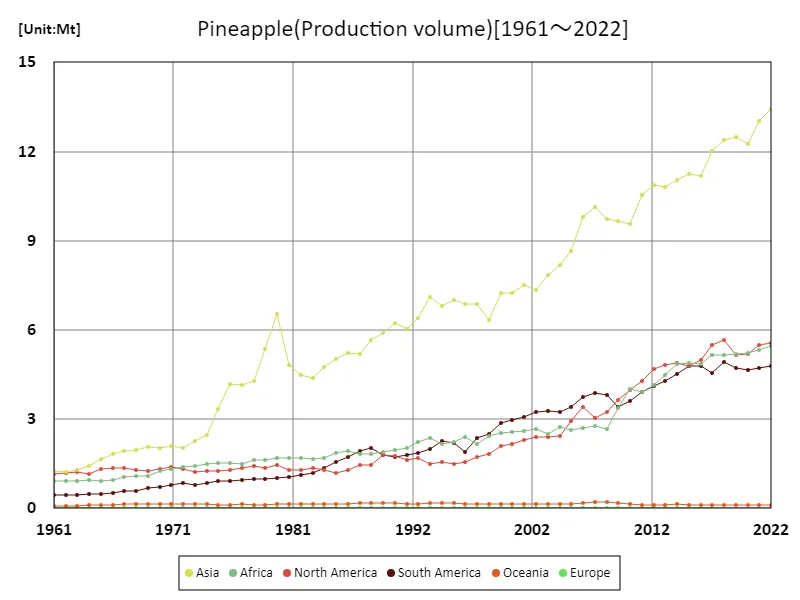
The maximum is the latest one, 13.4Mt of Asia
Pineapple exports (latest year, continental)
Asia accounts for the largest share of the total export volume of agricultural pineapple in 2021. Asia’s export volume reached 6.19 Mt, which is the highest overall. Meanwhile, the average global export volume was 2.22 Mt, totaling 13.3 Mt. This shows that pineapple is an important agricultural crop with global demand. Pineapple production in Asian countries is particularly prominent, with major producing countries such as the Philippines and Thailand contributing greatly. This trend is likely due to climatic conditions in Asia and advances in agricultural technology. Furthermore, the popularity of pineapple is backed by its health benefits and diverse uses, indicating that global demand is expanding. However, it is important to adopt sustainable agricultural practices and take the environment into consideration, and these points should also be taken into consideration. Pineapple production and exports are expected to continue to grow, mainly in Asia, but measures are required to deal with factors such as market changes and climate change.
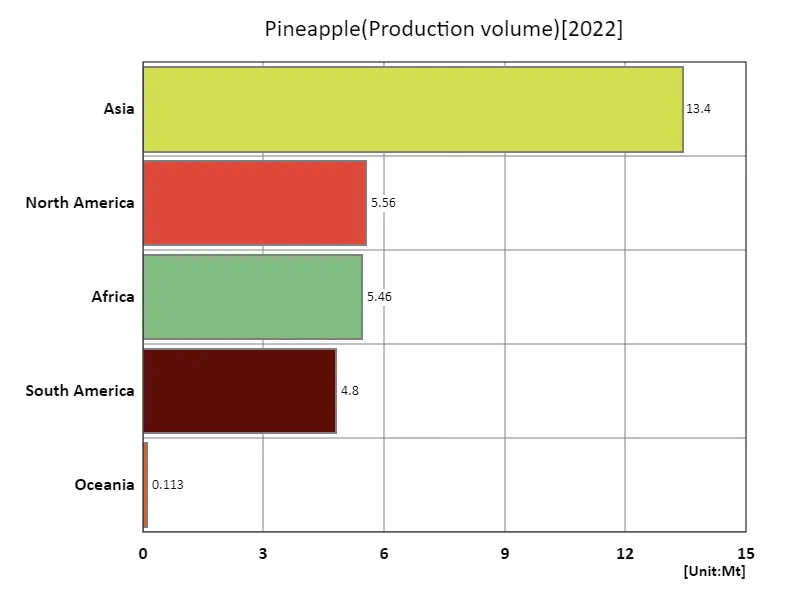
The maximum is 13.4Mt of Asia, the average is 5.87Mt, and the total is 29.4Mt
Main data
| Production(Pineapple, Production volume, t) [Mt] | ||||||||||
|---|---|---|---|---|---|---|---|---|---|---|
| World | Upper-middle-income countries | Asia | Lower-middle-income countries | Americas | South-eastern Asia | North America | Africa | Net Food Importing Developing Countries | Central America | |
| 2022 | 29.36 | 17.07 | 13.43 | 10.72 | 10.36 | 8.93 | 5.56 | 5.46 | 4.85 | 4.8 |
| 2021 | 28.71 | 16.69 | 13.03 | 10.51 | 10.23 | 8.64 | 5.5 | 5.34 | 4.71 | 4.8 |
| 2020 | 27.45 | 15.7 | 12.25 | 10.21 | 9.84 | 7.95 | 5.18 | 5.24 | 4.63 | 4.49 |
| 2019 | 27.66 | 15.95 | 12.47 | 10.15 | 9.89 | 7.88 | 5.16 | 5.17 | 4.57 | 4.44 |
| 2018 | 28.29 | 16.72 | 12.39 | 10.03 | 10.6 | 7.92 | 5.68 | 5.17 | 4.45 | 5.01 |
| 2017 | 27.34 | 15.59 | 12.01 | 10.11 | 10.05 | 7.81 | 5.5 | 5.15 | 4.41 | 4.86 |
| 2016 | 25.93 | 14.55 | 11.17 | 9.88 | 9.78 | 7.05 | 5 | 4.87 | 4.18 | 4.37 |
| 2015 | 25.83 | 14.45 | 11.25 | 9.87 | 9.59 | 7.16 | 4.79 | 4.87 | 4.16 | 4.14 |
| 2014 | 25.43 | 14.39 | 11.04 | 9.57 | 9.39 | 7.27 | 4.87 | 4.86 | 4.2 | 4.18 |
| 2013 | 24.49 | 14.15 | 10.82 | 9.17 | 9.09 | 7.3 | 4.81 | 4.47 | 4.07 | 4.03 |
| 2012 | 23.96 | 14.08 | 10.89 | 8.69 | 8.81 | 7.54 | 4.69 | 4.14 | 3.71 | 3.95 |
| 2011 | 22.77 | 13.34 | 10.54 | 8.28 | 8.19 | 7.3 | 4.28 | 3.93 | 3.28 | 3.78 |
| 2010 | 21.3 | 11.84 | 9.55 | 8.23 | 7.59 | 6.41 | 3.99 | 4.01 | 3.24 | 3.54 |
| 2009 | 20.26 | 11.46 | 9.65 | 7.52 | 7.04 | 6.58 | 3.64 | 3.37 | 3 | 3.2 |
| 2008 | 19.67 | 11.72 | 9.74 | 6.69 | 7.04 | 6.86 | 3.24 | 2.68 | 2.7 | 2.86 |
| 2007 | 20.04 | 12.06 | 10.14 | 6.72 | 6.94 | 7.1 | 3.05 | 2.76 | 2.78 | 2.69 |
| 2006 | 19.83 | 12.18 | 9.79 | 6.39 | 7.15 | 6.81 | 3.4 | 2.7 | 2.73 | 3.06 |
| 2005 | 17.78 | 10.36 | 8.65 | 6.27 | 6.36 | 5.77 | 2.95 | 2.63 | 2.58 | 2.6 |
| 2004 | 16.73 | 9.35 | 8.17 | 6.21 | 5.68 | 5.38 | 2.43 | 2.74 | 2.69 | 2.03 |
| 2003 | 16.12 | 8.97 | 7.84 | 5.93 | 5.65 | 5.04 | 2.39 | 2.49 | 2.39 | 1.91 |
| 2002 | 15.78 | 8.67 | 7.33 | 5.89 | 5.63 | 4.68 | 2.4 | 2.68 | 2.56 | 1.89 |
| 2001 | 15.65 | 8.72 | 7.52 | 5.73 | 5.37 | 4.82 | 2.3 | 2.61 | 2.44 | 1.77 |
| 2000 | 15.11 | 8.48 | 7.24 | 5.41 | 5.14 | 4.79 | 2.15 | 2.57 | 2.34 | 1.67 |
| 1999 | 14.9 | 8.37 | 7.25 | 5.32 | 4.96 | 4.81 | 2.08 | 2.53 | 2.27 | 1.61 |
| 1998 | 13.21 | 6.91 | 6.34 | 5.15 | 4.3 | 4.22 | 1.82 | 2.42 | 2.11 | 1.38 |
| 1997 | 13.3 | 6.95 | 6.88 | 5.22 | 4.1 | 4.57 | 1.73 | 2.17 | 1.87 | 1.28 |
| 1996 | 12.87 | 6.35 | 6.88 | 5.4 | 3.44 | 4.59 | 1.55 | 2.39 | 2.08 | 1.11 |
| 1995 | 13.07 | 6.82 | 7 | 5.11 | 3.68 | 4.89 | 1.47 | 2.23 | 2 | 0.96 |
| 1994 | 12.95 | 6.71 | 6.81 | 4.97 | 3.8 | 4.82 | 1.54 | 2.16 | 2.02 | 0.97 |
| 1993 | 13.12 | 6.72 | 7.1 | 5.1 | 3.48 | 5.13 | 1.5 | 2.37 | 2.07 | 0.96 |
| 1992 | 12.31 | 6.21 | 6.39 | 4.73 | 3.54 | 4.62 | 1.68 | 2.22 | 1.78 | 0.98 |
| 1991 | 11.62 | 5.79 | 6.04 | 4.47 | 3.4 | 4.36 | 1.61 | 2.04 | 1.6 | 0.94 |
| 1990 | 11.84 | 5.85 | 6.24 | 4.67 | 3.48 | 4.4 | 1.77 | 1.96 | 1.55 | 1.08 |
| 1989 | 11.56 | 6.05 | 5.9 | 4.21 | 3.58 | 4.13 | 1.78 | 1.9 | 1.44 | 1.09 |
| 1988 | 11.15 | 5.71 | 5.67 | 4.07 | 3.49 | 3.92 | 1.47 | 1.81 | 1.36 | 0.7 |
| 1987 | 10.55 | 5.2 | 5.18 | 4.01 | 3.37 | 3.77 | 1.46 | 1.83 | 1.41 | 0.65 |
| 1986 | 10.31 | 5.02 | 5.22 | 4.05 | 3.02 | 3.89 | 1.3 | 1.92 | 1.43 | 0.56 |
| 1985 | 9.75 | 4.71 | 5.01 | 3.88 | 2.73 | 3.7 | 1.17 | 1.86 | 1.37 | 0.51 |
| 1984 | 9.23 | 4.33 | 4.76 | 3.77 | 2.65 | 3.54 | 1.3 | 1.68 | 1.25 | 0.63 |
| 1983 | 8.7 | 3.91 | 4.38 | 3.56 | 2.54 | 3.2 | 1.36 | 1.64 | 1.19 | 0.58 |
| 1982 | 8.72 | 3.97 | 4.48 | 3.52 | 2.41 | 3.31 | 1.3 | 1.68 | 1.25 | 0.58 |
| 1981 | 9.02 | 4.3 | 4.82 | 3.49 | 2.35 | 3.7 | 1.3 | 1.71 | 1.31 | 0.61 |
| 1980 | 10.83 | 6.08 | 6.54 | 3.46 | 2.46 | 5.43 | 1.45 | 1.69 | 1.29 | 0.75 |
| 1979 | 9.48 | 5.23 | 5.37 | 2.95 | 2.35 | 4.25 | 1.35 | 1.63 | 1.3 | 0.64 |
| 1978 | 8.41 | 4.39 | 4.28 | 2.72 | 2.39 | 3.21 | 1.41 | 1.62 | 1.29 | 0.7 |
| 1977 | 8.08 | 4.27 | 4.16 | 2.45 | 2.3 | 3.11 | 1.36 | 1.5 | 1.16 | 0.64 |
| 1976 | 8.04 | 4.26 | 4.19 | 2.42 | 2.2 | 3.13 | 1.29 | 1.54 | 1.17 | 0.57 |
| 1975 | 7.19 | 3.33 | 3.36 | 2.34 | 2.19 | 2.3 | 1.26 | 1.51 | 1.11 | 0.49 |
| 1974 | 6.21 | 2.47 | 2.47 | 2.27 | 2.11 | 1.44 | 1.27 | 1.5 | 1.04 | 0.51 |
| 1973 | 5.82 | 2.09 | 2.25 | 2.14 | 2 | 1.22 | 1.23 | 1.43 | 0.99 | 0.38 |
| 1972 | 5.7 | 1.93 | 2.02 | 2.06 | 2.15 | 1.04 | 1.31 | 1.38 | 0.94 | 0.32 |
| 1971 | 5.7 | 2.04 | 2.1 | 1.94 | 2.15 | 1.1 | 1.37 | 1.32 | 0.86 | 0.4 |
| 1970 | 5.45 | 1.85 | 2.03 | 1.92 | 2.01 | 1.05 | 1.31 | 1.27 | 0.82 | 0.34 |
| 1969 | 5.24 | 1.79 | 2.05 | 1.75 | 1.96 | 1.06 | 1.27 | 1.09 | 0.8 | 0.33 |
| 1968 | 5.06 | 1.7 | 1.96 | 1.69 | 1.87 | 1.03 | 1.28 | 1.08 | 0.72 | 0.34 |
| 1967 | 5.02 | 1.7 | 1.92 | 1.63 | 1.93 | 0.99 | 1.35 | 1.05 | 0.66 | 0.34 |
| 1966 | 4.76 | 1.65 | 1.82 | 1.5 | 1.89 | 0.98 | 1.36 | 0.95 | 0.56 | 0.34 |
| 1965 | 4.48 | 1.61 | 1.66 | 1.39 | 1.8 | 0.96 | 1.31 | 0.92 | 0.51 | 0.34 |
| 1964 | 4.13 | 1.49 | 1.44 | 1.28 | 1.65 | 0.84 | 1.17 | 0.95 | 0.51 | 0.27 |
| 1963 | 4 | 1.47 | 1.3 | 1.18 | 1.69 | 0.84 | 1.23 | 0.92 | 0.5 | 0.26 |
| 1962 | 3.85 | 1.45 | 1.23 | 1.08 | 1.63 | 0.82 | 1.17 | 0.91 | 0.46 | 0.24 |
| 1961 | 3.83 | 1.57 | 1.24 | 0.99 | 1.58 | 0.88 | 1.14 | 0.92 | 0.43 | 0.24 |


Comments