Abstract
In recent years, Japanese mushroom production has seen varying trends. Enoki mushrooms, with a peak quantity of 6.43kt as of December 2022, have maintained steady production levels, reflecting their popularity in domestic and export markets. Fresh shiitake mushrooms, priced at up to 1.16k yen per kg in December 2022, demonstrate a stable value, with production often aligning with consumer demand for quality. The high value of shiitake mushrooms, reaching up to 3.44 million yen, indicates their premium status in the market. These trends highlight the importance of mushrooms in Japan’s agricultural landscape.
Total quantity of imported fruit.
Enoki mushrooms in Japan have experienced notable fluctuations in production over the years. The peak production of 10.5kt occurred in December 2009, after which quantities have gradually declined. As of December 2022, Enoki mushrooms were at 61.2% of their peak level, reflecting a decrease in production. Despite this, Enoki mushrooms remain a staple in Japanese cuisine, valued for their versatility and texture. The trends suggest stable demand but also indicate a shift in cultivation practices or market dynamics that has led to reduced overall output in recent years.
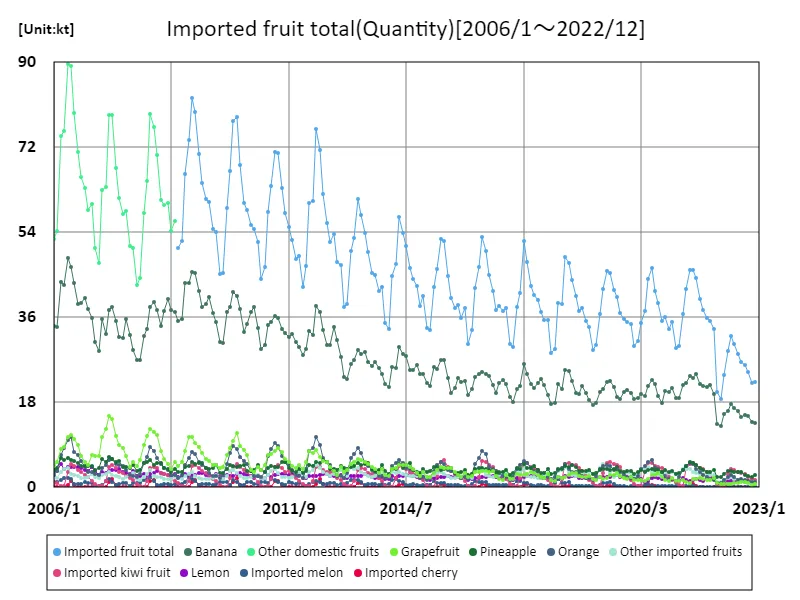
The maximum is 89.7kt[2006年5月] of Other domestic fruits, and the current value is about 62.8%
Total value of imported fruit.
Fresh shiitake mushrooms have consistently held a prominent position in Japan’s vegetable market. As of January 2006, the highest recorded price for shiitake mushrooms was 5.53 million yen, a value that remains unchanged. This stability in price reflects the sustained demand for high-quality shiitake, which is prized for its flavor and versatility in Japanese cuisine. While the market for shiitake mushrooms has seen some fluctuations across various prefectures, its premium status has been maintained, underlining the importance of shiitake mushrooms in both domestic consumption and export markets.
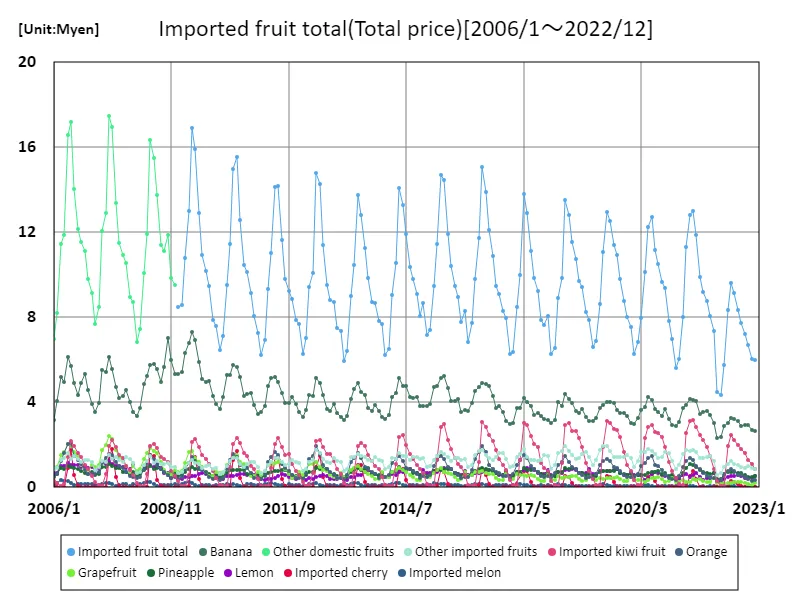
The maximum is 17.5Myen[2007年5月] of Other domestic fruits, and the current value is about 54.6%
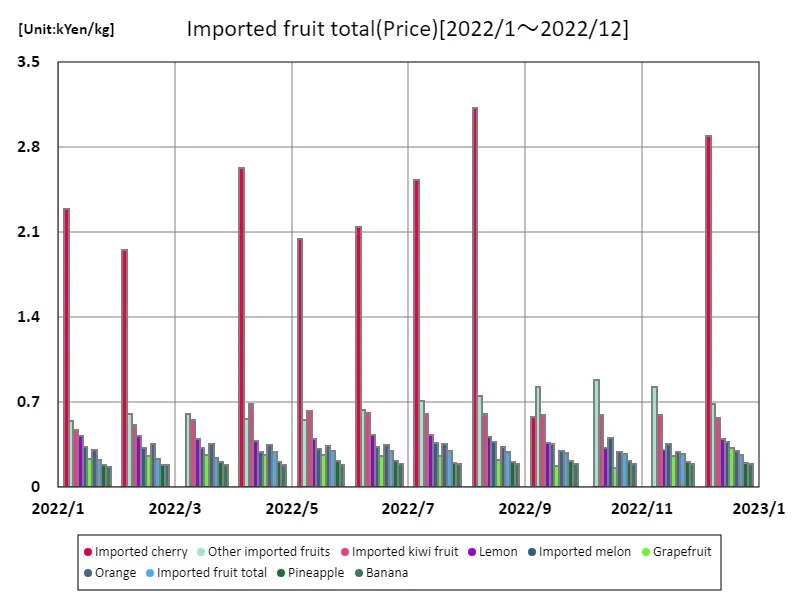
Prices of imported fruit meters.
Fresh shiitake mushrooms in Japan have demonstrated stable pricing trends, with the highest recorded price of 1.2k yen per kg in December 2017. As of December 2022, prices are at 97.2% of this peak, reflecting consistent market demand for shiitake mushrooms. Their steady price levels suggest a strong and ongoing appreciation for shiitake’s quality and versatility in Japanese cuisine. Despite minor fluctuations, the overall trend shows a resilient market for fresh shiitake, maintaining its premium status and making it a key product in both domestic consumption and exports.
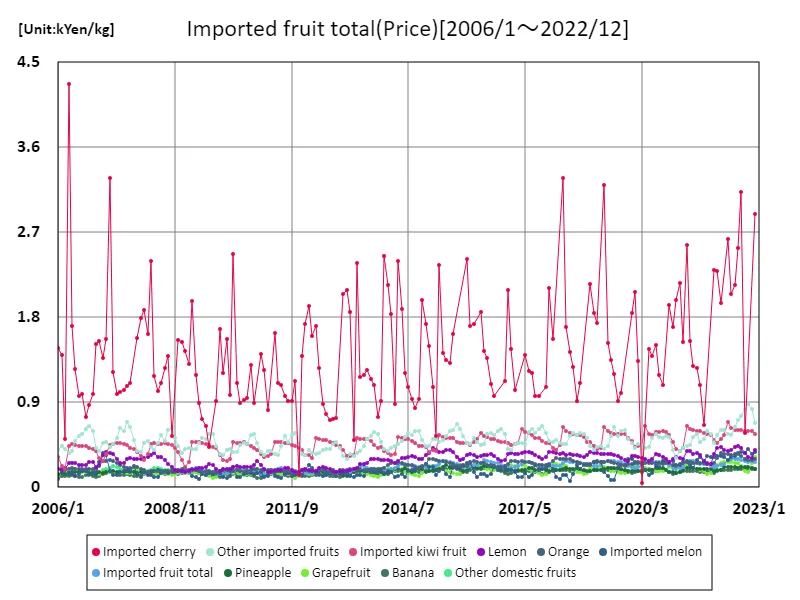
The maximum is 4.27kYen/kg[2006年4月] of Imported cherry, and the current value is about 67.9%
Imported fruit meter prices (latest).
Fresh shiitake mushrooms in Japan have maintained a strong market presence, with the highest recorded price of 1.16k yen per kg as of January 2022. This price reflects the premium quality of shiitake, which is highly valued in Japanese cuisine. The stability in pricing indicates consistent demand and cultivation practices, ensuring shiitake mushrooms remain a key agricultural product. Despite fluctuations in other vegetable markets, the steady value of shiitake showcases its enduring popularity both domestically and for export, underscoring its importance in Japan’s agricultural sector.
The maximum is 3.13kYen/kg[2022年8月] of Imported cherry, and the current value is about 92.6%
Main data
| Fruit(Central wholesale, Imported fruit total, Quantity) [kt] | ||||||||||
|---|---|---|---|---|---|---|---|---|---|---|
| Imported fruit total | Banana | Imported kiwi fruit | Pineapple | Orange | Lemon | Grapefruit | Other imported fruits | Imported melon | Imported cherry | |
| 2022-12 | 22.28 | 13.7 | 1.5 | 2.59 | 1.19 | 1.31 | 0.67 | 1.23 | 0.09 | 0 |
| 2022-11 | 21.99 | 13.78 | 1.8 | 2.28 | 1.07 | 1.39 | 0.5 | 1.1 | 0.08 | |
| 2022-10 | 24.49 | 15.18 | 2.16 | 2.37 | 1.34 | 1.29 | 0.96 | 1.12 | 0.08 | |
| 2022-9 | 25.79 | 15.35 | 2.72 | 2.6 | 1.61 | 1.22 | 1.09 | 1.09 | 0.1 | |
| 2022-8 | 26.48 | 14.92 | 3 | 3.15 | 1.74 | 1.25 | 1.09 | 1.24 | 0.06 | 0.03 |
| 2022-7 | 28.14 | 16.15 | 3.3 | 3.29 | 1.59 | 1.33 | 0.89 | 1.48 | 0.05 | 0.06 |
| 2022-6 | 30.28 | 16.87 | 3.68 | 3.31 | 2.24 | 1.29 | 0.91 | 1.75 | 0.12 | 0.12 |
| 2022-5 | 31.97 | 17.58 | 3.86 | 3.43 | 2.55 | 1.31 | 0.74 | 2.2 | 0.15 | 0.15 |
| 2022-4 | 28.89 | 16.24 | 2.84 | 3.45 | 2.22 | 1.25 | 0.73 | 1.91 | 0.25 | 0.01 |
| 2022-3 | 23.74 | 15.57 | 0.1 | 2.91 | 1.6 | 0.99 | 0.78 | 1.61 | 0.18 | |
| 2022-2 | 18.71 | 13.01 | 0.13 | 2.1 | 1.01 | 0.61 | 0.64 | 1.1 | 0.11 | 0 |
| 2022-1 | 20.13 | 13.51 | 0.67 | 2.18 | 0.97 | 0.86 | 0.83 | 1.04 | 0.07 | 0 |
| 2021-12 | 33.6 | 19.83 | 1.72 | 3.77 | 1.64 | 1.92 | 1.91 | 2.64 | 0.16 | 0 |
| 2021-11 | 35.29 | 21.65 | 2.68 | 3.2 | 1.71 | 1.87 | 1.49 | 2.58 | 0.12 | |
| 2021-10 | 35.88 | 21.32 | 3.33 | 3.29 | 2.12 | 1.7 | 1.64 | 2.38 | 0.1 | |
| 2021-9 | 37.46 | 21.49 | 3.88 | 3.68 | 2.59 | 1.3 | 1.65 | 2.72 | 0.16 | |
| 2021-8 | 39.95 | 21.84 | 4.15 | 4.16 | 3.23 | 1.49 | 2.05 | 2.89 | 0.1 | 0.03 |
| 2021-7 | 44.28 | 23.9 | 4.73 | 4.78 | 3.91 | 1.85 | 1.77 | 2.95 | 0.08 | 0.3 |
| 2021-6 | 45.97 | 23.23 | 5.21 | 5.12 | 4.88 | 1.59 | 1.83 | 3.29 | 0.22 | 0.6 |
| 2021-5 | 46.02 | 23.67 | 5.04 | 5.43 | 5.12 | 1.29 | 0.98 | 3.88 | 0.29 | 0.34 |
| 2021-4 | 42.06 | 22.11 | 3.95 | 4.51 | 4.46 | 1.61 | 1.11 | 3.97 | 0.32 | 0 |
| 2021-3 | 36.75 | 21.59 | 0.27 | 3.6 | 3.56 | 2.02 | 1.59 | 3.81 | 0.31 | |
| 2021-2 | 30 | 19.01 | 0.43 | 2.96 | 2.1 | 1.26 | 1.26 | 2.77 | 0.21 | 0 |
| 2021-1 | 29.6 | 18.89 | 1.07 | 2.82 | 1.43 | 1.12 | 1.24 | 2.86 | 0.17 | 0 |
| 2020-12 | 34.94 | 20.95 | 1.63 | 3.54 | 1.69 | 1.78 | 1.95 | 3.17 | 0.23 | 0 |
| 2020-11 | 33.6 | 20.18 | 2.16 | 3.26 | 1.67 | 1.8 | 1.3 | 3.04 | 0.21 | |
| 2020-10 | 36.14 | 20.37 | 3.28 | 3.66 | 2.31 | 1.77 | 1.46 | 3.08 | 0.21 | |
| 2020-9 | 35.19 | 17.87 | 4 | 3.2 | 3.17 | 1.83 | 2.18 | 2.76 | 0.19 | |
| 2020-8 | 39.1 | 19.35 | 4.32 | 3.68 | 3.96 | 1.99 | 2.97 | 2.59 | 0.23 | 0.03 |
| 2020-7 | 41.62 | 21.78 | 4.47 | 3.61 | 3.99 | 2.1 | 2.55 | 2.78 | 0.14 | 0.19 |
| 2020-6 | 46.36 | 22.83 | 5.22 | 3.87 | 5.71 | 2.06 | 2.61 | 3.34 | 0.25 | 0.47 |
| 2020-5 | 44.09 | 21.49 | 5.09 | 3.77 | 5.35 | 1.37 | 1.79 | 4.21 | 0.7 | 0.34 |
| 2020-4 | 37.38 | 19.26 | 3.53 | 3.14 | 4.51 | 1.1 | 1.29 | 3.99 | 0.57 | |
| 2020-3 | 34.81 | 19.75 | 0.2 | 3.61 | 3.86 | 1.84 | 1.56 | 3.68 | 0.31 | |
| 2020-2 | 31.01 | 18.88 | 0.21 | 3.2 | 2.34 | 1.84 | 1.55 | 2.69 | 0.29 | 0 |
| 2020-1 | 29.95 | 18.7 | 0.77 | 2.88 | 1.77 | 1.74 | 1.53 | 2.31 | 0.26 | 0 |
| 2019-12 | 34.54 | 19.96 | 1.59 | 3.54 | 1.93 | 2.2 | 2.13 | 2.93 | 0.25 | 0 |
| 2019-11 | 35.1 | 20.54 | 2.05 | 3.44 | 2.05 | 2.11 | 1.74 | 3.02 | 0.16 | |
| 2019-10 | 35.68 | 20.2 | 2.97 | 3.31 | 2.57 | 2.11 | 1.93 | 2.35 | 0.26 | |
| 2019-9 | 36.81 | 18.77 | 4.21 | 3.4 | 3.15 | 2.22 | 2.41 | 2.36 | 0.29 | 0 |
| 2019-8 | 40.4 | 19.13 | 4.74 | 4.3 | 3.76 | 2.58 | 2.98 | 2.66 | 0.24 | 0.02 |
| 2019-7 | 41.69 | 21.15 | 4.86 | 3.81 | 3.61 | 2.36 | 2.66 | 2.26 | 0.75 | 0.23 |
| 2019-6 | 45.4 | 22.49 | 5.33 | 3.69 | 4.54 | 2.26 | 2.52 | 3.19 | 1.02 | 0.36 |
| 2019-5 | 45.81 | 22.24 | 5.16 | 3.8 | 4.79 | 2.24 | 2.04 | 4.39 | 0.81 | 0.35 |
| 2019-4 | 41.98 | 20.91 | 2.93 | 3.79 | 4.61 | 2.25 | 1.81 | 4.83 | 0.85 | 0 |
| 2019-3 | 36.75 | 20.24 | 0.2 | 3.76 | 3.83 | 2.22 | 2.1 | 3.99 | 0.41 | |
| 2019-2 | 30.03 | 17.81 | 0.3 | 3.02 | 2.32 | 1.76 | 1.59 | 2.93 | 0.3 | 0 |
| 2019-1 | 29.12 | 17.49 | 0.89 | 2.81 | 1.64 | 1.73 | 1.65 | 2.73 | 0.18 | 0 |
| 2018-12 | 33.99 | 18.53 | 1.63 | 3.63 | 1.92 | 2.28 | 2.45 | 3.28 | 0.27 | 0 |
| 2018-11 | 35.29 | 20.06 | 2.38 | 3.36 | 1.9 | 1.99 | 2.22 | 3.18 | 0.2 | |
| 2018-10 | 38.02 | 21.41 | 3.54 | 3.53 | 2.31 | 2.04 | 2.13 | 2.79 | 0.27 | |
| 2018-9 | 37.43 | 19.82 | 4.16 | 3.46 | 2.75 | 2.05 | 2.45 | 2.38 | 0.37 | |
| 2018-8 | 40.53 | 19.94 | 4.73 | 4.26 | 3.25 | 2.46 | 3.12 | 2.45 | 0.3 | 0.01 |
| 2018-7 | 43.82 | 22.49 | 4.66 | 4.68 | 3.31 | 2.43 | 3.09 | 2.67 | 0.34 | 0.15 |
| 2018-6 | 47.42 | 24.55 | 5.21 | 4.28 | 3.98 | 2.28 | 2.54 | 3.14 | 1.11 | 0.34 |
| 2018-5 | 48.83 | 24.77 | 4.87 | 4.43 | 4.93 | 2.38 | 2.1 | 4.22 | 0.82 | 0.31 |
| 2018-4 | 38.82 | 20.72 | 1.82 | 3.84 | 4.04 | 1.9 | 1.91 | 3.71 | 0.88 | |
| 2018-3 | 38.95 | 21.83 | 0.14 | 3.93 | 3.57 | 2.09 | 2.21 | 3.46 | 1.73 | |
| 2018-2 | 29.38 | 17.9 | 0.22 | 3.05 | 2.17 | 1.5 | 1.44 | 2.14 | 0.98 | |
| 2018-1 | 28.35 | 17.69 | 0.74 | 2.78 | 1.75 | 1.61 | 1.62 | 1.76 | 0.39 | 0 |
| 2017-12 | 35.46 | 19.53 | 1.64 | 3.84 | 2.14 | 2.16 | 2.75 | 3.02 | 0.38 | 0 |
| 2017-11 | 35.47 | 21.57 | 1.88 | 3.07 | 2.01 | 2 | 1.96 | 2.63 | 0.36 | |
| 2017-10 | 37.23 | 22.86 | 2.31 | 3.07 | 2.28 | 2.03 | 2.26 | 1.95 | 0.48 | |
| 2017-9 | 39.73 | 22.05 | 3.65 | 3.68 | 3.14 | 2.2 | 2.58 | 2.01 | 0.43 | |
| 2017-8 | 40.83 | 20.99 | 3.84 | 4.52 | 3.53 | 2.34 | 3.11 | 2.19 | 0.31 | 0.01 |
| 2017-7 | 42.64 | 21.81 | 4.37 | 4.07 | 3.99 | 2.47 | 3.18 | 2.09 | 0.47 | 0.19 |
| 2017-6 | 47.63 | 24.06 | 5.09 | 4.11 | 5.13 | 2.38 | 2.87 | 2.44 | 0.91 | 0.64 |
| 2017-5 | 52.09 | 26.13 | 5.22 | 4.89 | 5.63 | 2.25 | 2.61 | 3.94 | 0.87 | 0.55 |
| 2017-4 | 41.18 | 21.5 | 2.07 | 3.94 | 4.7 | 1.76 | 2.58 | 3.3 | 1.34 | |
| 2017-3 | 38.15 | 20.9 | 0.26 | 4.11 | 3.88 | 1.99 | 2.72 | 2.99 | 1.32 | |
| 2017-2 | 29.68 | 18.02 | 0.24 | 3.05 | 2.18 | 1.56 | 1.79 | 2.24 | 0.59 | 0 |
| 2017-1 | 30.31 | 19.1 | 0.78 | 2.6 | 1.59 | 1.52 | 1.79 | 2.47 | 0.46 | 0 |
| 2016-12 | 37.88 | 21.85 | 1.75 | 3.59 | 2.11 | 2.11 | 2.65 | 3.33 | 0.5 | 0 |
| 2016-11 | 37.25 | 22.69 | 2.15 | 3.16 | 2.34 | 1.98 | 1.6 | 2.9 | 0.43 | |
| 2016-10 | 38.44 | 22.06 | 2.72 | 3.33 | 3.13 | 2.16 | 1.85 | 2.64 | 0.55 | |
| 2016-9 | 37.56 | 19.94 | 3.54 | 3.02 | 3.49 | 2.22 | 2.44 | 2.37 | 0.54 | |
| 2016-8 | 41.67 | 21.65 | 4.24 | 3.44 | 3.85 | 2.4 | 3.41 | 2.29 | 0.4 | 0 |
| 2016-7 | 45.01 | 23.51 | 4.77 | 3.73 | 4.39 | 2.31 | 3.3 | 2.42 | 0.45 | 0.13 |
| 2016-6 | 50.03 | 23.93 | 5.41 | 3.91 | 7.03 | 2.25 | 3.35 | 2.7 | 1.03 | 0.41 |
| 2016-5 | 52.96 | 24.34 | 5.67 | 4.07 | 7.69 | 2.17 | 3.52 | 3.76 | 1.12 | 0.6 |
| 2016-4 | 46.6 | 23.98 | 2.09 | 4.13 | 6.3 | 1.96 | 3.14 | 3.81 | 1.12 | 0.05 |
| 2016-3 | 42.31 | 23.45 | 0.18 | 3.89 | 5.01 | 2.04 | 3.17 | 3.2 | 1.36 | |
| 2016-2 | 33.39 | 20.72 | 0.14 | 2.88 | 2.9 | 1.7 | 2.4 | 2.04 | 0.62 | |
| 2016-1 | 30.44 | 19.6 | 0.24 | 2.52 | 1.83 | 1.63 | 2.21 | 2.11 | 0.29 | 0 |
| 2015-12 | 37.99 | 22.48 | 1.25 | 3.71 | 2.15 | 2.23 | 3.06 | 2.8 | 0.32 | 0.01 |
| 2015-11 | 35.93 | 22.2 | 2.01 | 3.16 | 1.93 | 1.89 | 2.11 | 2.37 | 0.27 | |
| 2015-10 | 38.59 | 23.13 | 2.37 | 3.09 | 2.57 | 2.11 | 2.55 | 2.25 | 0.53 | |
| 2015-9 | 37.89 | 21.05 | 2.92 | 2.97 | 3.05 | 2.15 | 3.21 | 2.05 | 0.51 | |
| 2015-8 | 40.04 | 20.04 | 3.53 | 4.14 | 3.5 | 2.28 | 4.11 | 2.04 | 0.39 | 0 |
| 2015-7 | 44.71 | 23.19 | 4.26 | 4.12 | 3.69 | 2.33 | 4.14 | 2.37 | 0.49 | 0.12 |
| 2015-6 | 52.21 | 26.99 | 5.68 | 3.77 | 4.94 | 2.26 | 4.19 | 2.85 | 1 | 0.55 |
| 2015-5 | 52.51 | 26.86 | 5.32 | 3.75 | 5.34 | 2.17 | 4.26 | 3.31 | 0.89 | 0.62 |
| 2015-4 | 46.28 | 25.12 | 2.44 | 4.35 | 4.62 | 1.96 | 3.73 | 3.11 | 0.93 | 0.02 |
| 2015-3 | 42.37 | 25.49 | 0.16 | 4.26 | 3.47 | 1.98 | 3.06 | 2.57 | 1.39 | |
| 2015-2 | 33.28 | 21.55 | 0.11 | 3.35 | 1.94 | 1.62 | 2.23 | 1.94 | 0.54 | 0 |
| 2015-1 | 33.83 | 22.11 | 0.38 | 3.17 | 1.61 | 1.77 | 2.2 | 2.15 | 0.44 | 0 |
| 2014-12 | 40.43 | 23.91 | 1.52 | 3.85 | 2.2 | 2.28 | 3.15 | 3.09 | 0.41 | 0.01 |
| 2014-11 | 38.48 | 24.07 | 1.94 | 3.06 | 1.98 | 1.95 | 2.48 | 2.69 | 0.31 | 0 |
| 2014-10 | 42.69 | 25.92 | 2.41 | 3.31 | 2.91 | 2.19 | 3.04 | 2.39 | 0.51 | |
| 2014-9 | 44.19 | 24.83 | 2.83 | 3.58 | 3.66 | 2.35 | 3.91 | 2.34 | 0.7 | 0 |
| 2014-8 | 46.51 | 24.82 | 3.18 | 5.12 | 3.77 | 2.55 | 4.2 | 2.31 | 0.55 | 0.02 |
| 2014-7 | 51.01 | 27.86 | 3.91 | 4.71 | 4.03 | 2.5 | 4.73 | 2.55 | 0.4 | 0.32 |
| 2014-6 | 53.9 | 28.26 | 4.8 | 4.05 | 5.11 | 2.33 | 4.81 | 2.77 | 1.05 | 0.72 |
| 2014-5 | 57.24 | 29.79 | 4.57 | 5 | 5.7 | 2.4 | 4.76 | 3.32 | 1.3 | 0.4 |
| 2014-4 | 47.29 | 25.28 | 2.02 | 3.86 | 5.15 | 2.04 | 4.15 | 2.94 | 1.82 | 0.02 |
| 2014-3 | 44.85 | 25.42 | 0.11 | 3.83 | 4.53 | 2.35 | 3.82 | 3.14 | 1.65 | |
| 2014-2 | 33.58 | 21.23 | 0.12 | 2.91 | 2.21 | 1.66 | 2.43 | 2.34 | 0.7 | |
| 2014-1 | 34.84 | 21.93 | 0.32 | 3.4 | 2.02 | 1.73 | 2.63 | 2.28 | 0.53 | 0 |
| 2013-12 | 42.38 | 24.03 | 1.26 | 4.7 | 2.48 | 2.28 | 3.87 | 3.08 | 0.69 | 0 |
| 2013-11 | 41.5 | 25.36 | 2.04 | 3.6 | 2.38 | 1.9 | 3.06 | 2.72 | 0.44 | |
| 2013-10 | 44.91 | 26.63 | 2.4 | 3.53 | 3.27 | 2.05 | 3.84 | 2.48 | 0.72 | |
| 2013-9 | 45.29 | 25.69 | 2.75 | 3.75 | 3.87 | 2.08 | 4.39 | 2.1 | 0.67 | 0 |
| 2013-8 | 49.86 | 26.59 | 3.08 | 5.17 | 4.53 | 2.62 | 4.87 | 2.34 | 0.64 | 0.02 |
| 2013-7 | 53.93 | 28.68 | 3.82 | 4.84 | 5.12 | 2.77 | 5.25 | 2.77 | 0.47 | 0.21 |
| 2013-6 | 57.62 | 28.21 | 4.05 | 4.72 | 7.26 | 2.41 | 5.7 | 3.3 | 1.09 | 0.88 |
| 2013-5 | 61.02 | 29.02 | 3.75 | 5.2 | 8.32 | 2.33 | 5.89 | 4.15 | 1.47 | 0.9 |
| 2013-4 | 52.88 | 26.91 | 1.29 | 4.61 | 7.04 | 2.32 | 5.28 | 3.97 | 1.44 | 0.01 |
| 2013-3 | 50.13 | 26.14 | 0.21 | 4.25 | 6.18 | 2.47 | 5.01 | 4.29 | 1.59 | |
| 2013-2 | 38.91 | 22.96 | 0.22 | 3.85 | 3.04 | 1.96 | 3.59 | 2.45 | 0.84 | 0 |
| 2013-1 | 38.19 | 23.27 | 0.61 | 3.99 | 2.06 | 1.95 | 3.22 | 2.61 | 0.48 | 0 |
| 2012-12 | 47.07 | 27.53 | 1.6 | 4.55 | 2.37 | 2.57 | 4.26 | 3.57 | 0.6 | 0 |
| 2012-11 | 47.74 | 31.24 | 2.02 | 3.75 | 2.38 | 2.21 | 2.68 | 3.05 | 0.42 | |
| 2012-10 | 53.71 | 33.88 | 2.74 | 3.89 | 3.46 | 2.43 | 3.45 | 2.9 | 0.97 | |
| 2012-9 | 51.98 | 30.2 | 3.32 | 3.84 | 4.67 | 2.32 | 4.3 | 2.5 | 0.84 | 0 |
| 2012-8 | 55.88 | 30.15 | 3.25 | 5.28 | 5.41 | 2.74 | 5.38 | 2.9 | 0.73 | 0.05 |
| 2012-7 | 62.17 | 33.41 | 3.74 | 5.85 | 6.13 | 2.84 | 5.67 | 3.32 | 0.61 | 0.6 |
| 2012-6 | 71.33 | 37.05 | 4.39 | 5.18 | 8.89 | 2.56 | 6.49 | 4.01 | 1.09 | 1.66 |
| 2012-5 | 75.8 | 38.33 | 4.28 | 5.33 | 10.74 | 2.46 | 7.8 | 4.8 | 1.29 | 0.77 |
| 2012-4 | 60.65 | 32.27 | 1.32 | 4.48 | 8.42 | 2.29 | 7.25 | 3.58 | 1.05 | |
| 2012-3 | 60.12 | 33.14 | 0.35 | 4.69 | 7.77 | 2.47 | 7.66 | 3.23 | 0.8 | |
| 2012-2 | 46.91 | 29.33 | 0.24 | 3.54 | 3.88 | 1.97 | 5.43 | 2.25 | 0.28 | 0 |
| 2012-1 | 42.41 | 27.92 | 0.77 | 3.12 | 2.05 | 1.98 | 3.91 | 2.23 | 0.42 | 0 |
| 2011-12 | 49.02 | 29.73 | 1.43 | 3.92 | 2.38 | 2.67 | 4.81 | 3.24 | 0.83 | 0.02 |
| 2011-11 | 48.34 | 30.78 | 1.9 | 3.26 | 2.65 | 2.41 | 4.08 | 2.63 | 0.64 | |
| 2011-10 | 52.46 | 32.37 | 2.48 | 3.46 | 3.73 | 2.72 | 4.46 | 2.26 | 0.98 | 0 |
| 2011-9 | 55.18 | 31.9 | 3.44 | 4.19 | 4.67 | 2.59 | 5.33 | 1.97 | 1.11 | 0 |
| 2011-8 | 58.18 | 32.58 | 3.27 | 5.26 | 5.35 | 2.79 | 6.1 | 2.25 | 0.53 | 0.06 |
| 2011-7 | 63.29 | 33.57 | 4.05 | 5.35 | 6.65 | 2.91 | 7.54 | 2.17 | 0.64 | 0.41 |
| 2011-6 | 70.69 | 35.81 | 4.82 | 4.37 | 8.81 | 2.86 | 8.41 | 3.08 | 1.21 | 1.32 |
| 2011-5 | 71.01 | 36.27 | 4.28 | 4.2 | 9.41 | 2.52 | 7.59 | 3.95 | 1.55 | 1.23 |
| 2011-4 | 63.75 | 35.03 | 1.86 | 4.42 | 8.09 | 2.28 | 6.97 | 3.36 | 1.75 | |
| 2011-3 | 58.25 | 34.37 | 0.18 | 4.15 | 6.63 | 2.51 | 6.81 | 2.69 | 0.91 | |
| 2011-2 | 46.71 | 30.21 | 0.12 | 3.29 | 3.31 | 2.04 | 4.63 | 1.97 | 1.14 | |
| 2011-1 | 44.06 | 29.26 | 0.25 | 3.73 | 2.2 | 1.95 | 3.67 | 1.96 | 1.04 | 0 |
| 2010-12 | 51.85 | 33.72 | 1.07 | 4.66 | 2.37 | 2.42 | 4.38 | 2.58 | 0.64 | 0.02 |
| 2010-11 | 54.75 | 38.2 | 2.16 | 3.66 | 2.3 | 2 | 3.25 | 2.52 | 0.67 | |
| 2010-10 | 55.64 | 37.21 | 2.39 | 3.4 | 3.39 | 2.36 | 3.61 | 2.11 | 1.17 | |
| 2010-9 | 58.74 | 34.49 | 3.33 | 3.49 | 4.85 | 2.65 | 6.91 | 1.96 | 1.07 | |
| 2010-8 | 60.13 | 32.95 | 3.57 | 4.71 | 5.55 | 2.9 | 7.89 | 2.06 | 0.48 | 0.03 |
| 2010-7 | 68.26 | 37.82 | 4.38 | 4.53 | 6.43 | 2.98 | 8.84 | 2.33 | 0.49 | 0.48 |
| 2010-6 | 78.48 | 40.61 | 4.95 | 4.29 | 8.17 | 2.73 | 11.59 | 3.09 | 1.16 | 1.9 |
| 2010-5 | 77.55 | 41.35 | 4.29 | 4.59 | 8.68 | 2.34 | 9.82 | 3.72 | 1.61 | 1.14 |
| 2010-4 | 66.89 | 38.28 | 2.01 | 4.66 | 7.21 | 2.43 | 8.42 | 3.37 | 0.51 | 0 |
| 2010-3 | 59.22 | 37.14 | 0.13 | 3.91 | 4.93 | 2.68 | 6.92 | 2.41 | 1.08 | |
| 2010-2 | 45.44 | 30.53 | 0.15 | 3.03 | 2.52 | 2.01 | 4.3 | 1.78 | 1.11 | 0 |
| 2010-1 | 45.24 | 30.67 | 0.41 | 3.13 | 1.89 | 2.15 | 4.05 | 1.87 | 1.06 | 0.01 |
| 2009-12 | 54.08 | 35.05 | 1.25 | 4.65 | 2.44 | 2.77 | 4.71 | 2.54 | 0.66 | 0.01 |
| 2009-11 | 54.62 | 36.89 | 1.85 | 4.04 | 2.47 | 2.21 | 4.7 | 2.02 | 0.45 | |
| 2009-10 | 60.52 | 40.35 | 2.61 | 3.94 | 3.06 | 2.48 | 5.52 | 1.82 | 0.75 | |
| 2009-9 | 61.13 | 38.91 | 2.98 | 4.12 | 4.13 | 2.59 | 5.89 | 1.73 | 0.78 | |
| 2009-8 | 64.4 | 38.24 | 3.36 | 5.16 | 4.72 | 3.01 | 7.34 | 1.77 | 0.76 | 0.06 |
| 2009-7 | 70.64 | 41.47 | 4.03 | 5.17 | 5.39 | 3.03 | 8.47 | 2.05 | 0.49 | 0.56 |
| 2009-6 | 79.4 | 45.28 | 4.76 | 4.93 | 7.14 | 2.68 | 9.31 | 2.39 | 1.28 | 1.63 |
| 2009-5 | 82.52 | 45.67 | 4.5 | 5.26 | 7.53 | 2.65 | 10.75 | 3.15 | 1.84 | 1.18 |
| 2009-4 | 73.53 | 43.36 | 1.24 | 4.57 | 6.11 | 2.6 | 10.7 | 2.77 | 2.17 | 0.03 |
| 2009-3 | 66.43 | 43.22 | 0.15 | 4.21 | 4.79 | 2.78 | 7.79 | 2.33 | 1.16 | |
| 2009-2 | 52.14 | 35.67 | 0.33 | 3.34 | 2.68 | 2.27 | 5.3 | 1.77 | 0.78 | 0 |
| 2009-1 | 50.7 | 35.25 | 1.01 | 3.15 | 2.01 | 2.27 | 4.51 | 1.87 | 0.66 | 0 |
| 2008-12 | 37.06 | 1.44 | 3.9 | 2.66 | 2.91 | 5.35 | 2.22 | 0.77 | 0.01 | |
| 2008-11 | 37.6 | 1.86 | 3.32 | 2.64 | 2.46 | 3.96 | 1.86 | 0.51 | ||
| 2008-10 | 39.93 | 2.6 | 3.93 | 3.64 | 2.66 | 4.89 | 1.78 | 0.75 | ||
| 2008-9 | 37.36 | 2.9 | 4.19 | 4.16 | 2.81 | 5.9 | 1.8 | 0.7 | 0.01 | |
| 2008-8 | 34.24 | 3.01 | 5.16 | 4.89 | 3.13 | 7.67 | 2.22 | 0.56 | 0.05 | |
| 2008-7 | 37.63 | 4.03 | 5.12 | 6.11 | 3.4 | 11.07 | 2.28 | 0.43 | 0.33 | |
| 2008-6 | 39.17 | 4.37 | 4.81 | 7.78 | 2.99 | 11.8 | 2.47 | 1.4 | 1.46 | |
| 2008-5 | 38.25 | 4.11 | 5.74 | 8.59 | 2.88 | 12.41 | 3.67 | 2.16 | 1.3 | |
| 2008-4 | 33.6 | 1.38 | 5.34 | 6.34 | 2.7 | 10.82 | 2.91 | 1.82 | 0.01 | |
| 2008-3 | 32.06 | 0.13 | 5.16 | 5.15 | 2.82 | 8.91 | 2.17 | 1.65 | ||
| 2008-2 | 26.87 | 0.25 | 3.72 | 2.84 | 2.47 | 5.7 | 1.6 | 0.91 | 0 | |
| 2008-1 | 26.9 | 0.67 | 3.4 | 2.15 | 2.38 | 4.47 | 1.83 | 0.98 | 0.01 | |
| 2007-12 | 29.13 | 1.58 | 4.79 | 2.4 | 3.53 | 5.32 | 2.93 | 0.99 | 0.01 | |
| 2007-11 | 32.33 | 2 | 4.06 | 2.5 | 2.84 | 4.33 | 2.68 | 0.35 | ||
| 2007-10 | 35.54 | 2.46 | 4.19 | 3.61 | 2.98 | 6.65 | 2.25 | 0.84 | ||
| 2007-9 | 31.71 | 3.06 | 4.37 | 4.55 | 3.24 | 8.3 | 1.75 | 0.92 | 0.01 | |
| 2007-8 | 31.92 | 3.33 | 5.49 | 4.69 | 3.92 | 8.98 | 2.16 | 0.66 | 0.07 | |
| 2007-7 | 35.24 | 4.07 | 5.44 | 4.99 | 3.77 | 10.92 | 2.29 | 0.43 | 0.47 | |
| 2007-6 | 38.28 | 4.77 | 6.09 | 6.08 | 3.61 | 14.56 | 2.58 | 1.04 | 1.84 | |
| 2007-5 | 37.6 | 4.2 | 6.44 | 5.73 | 3.5 | 15.19 | 3.27 | 1.73 | 1.1 | |
| 2007-4 | 32.46 | 1.37 | 5.46 | 4.79 | 3.04 | 12.39 | 2.79 | 1.27 | 0 | |
| 2007-3 | 35.62 | 0.18 | 6.07 | 4.17 | 3.27 | 10.69 | 2.54 | 0.52 | ||
| 2007-2 | 28.87 | 0.33 | 4.19 | 2.62 | 2.66 | 6.58 | 1.99 | 0.32 | 0 | |
| 2007-1 | 30.76 | 0.74 | 3.77 | 2.81 | 3.51 | 6.55 | 2.17 | 0.36 | 0.01 | |
| 2006-12 | 35.75 | 1.41 | 4.57 | 3.23 | 4.34 | 6.88 | 2.85 | 0.93 | 0.02 | |
| 2006-11 | 37.69 | 2.16 | 4.57 | 3.2 | 3.38 | 4.65 | 2.14 | 0.87 | ||
| 2006-10 | 40.13 | 2.51 | 4.44 | 4.19 | 3.76 | 5.29 | 1.95 | 1.02 | ||
| 2006-9 | 39.04 | 3.32 | 4.45 | 5.59 | 4.13 | 6.54 | 1.95 | 0.8 | ||
| 2006-8 | 38.86 | 3.65 | 5.25 | 6.78 | 4.35 | 9.01 | 2.34 | 0.8 | 0.08 | |
| 2006-7 | 43.21 | 4.42 | 5.6 | 7.52 | 4.29 | 10.29 | 2.68 | 0.76 | 0.58 | |
| 2006-6 | 46.7 | 4.85 | 5.85 | 10.64 | 4.2 | 10.99 | 2.77 | 1.77 | 1.39 | |
| 2006-5 | 48.61 | 3.16 | 6.23 | 10.06 | 4.38 | 10.65 | 4.18 | 1.91 | 0.52 | |
| 2006-4 | 42.82 | 0.34 | 5.69 | 8.26 | 3.8 | 8.6 | 3.78 | 2.07 | ||
| 2006-3 | 43.39 | 0.34 | 6.13 | 6.87 | 4.93 | 8.01 | 3.15 | 1.59 | ||
| 2006-2 | 34 | 0.81 | 4.15 | 3.4 | 3.51 | 5.26 | 2.05 | 1.07 | ||
| 2006-1 | 34.15 | 0.95 | 3.6 | 2.58 | 3.45 | 4.71 | 2.19 | 1.05 | 0.01 | |


Comments