Abstract
In 2006, Japan’s iyokan harvest reached 85.7kt nationwide, with Ehime leading in shipping volumes at 64.8kt. The fruiting tree area averaged 6.39 kha, indicating a well-established cultivation area. Historically, this suggests a stable yet concentrated production with Ehime as a major player. The high shipping volume from Ehime reflects its prominent role in the iyokan market, pointing to regional specialization and efficiency. Overall, the data highlights consistent harvest levels and the significance of specific regions in shaping the iyokan industry.
Iyokan harvest volume (main data).
Since its peak harvest of 230kt in 1992, Japan’s iyokan orange production has declined significantly, currently at just 37.2% of that maximum. This decrease reflects a notable reduction in overall yield, likely due to factors such as changing agricultural practices, market dynamics, or climatic conditions. Despite the decline, iyokan remains a key citrus fruit, with regional production still holding value. The reduced yield underscores a shift from past high levels, highlighting evolving trends in Japanese citrus agriculture.
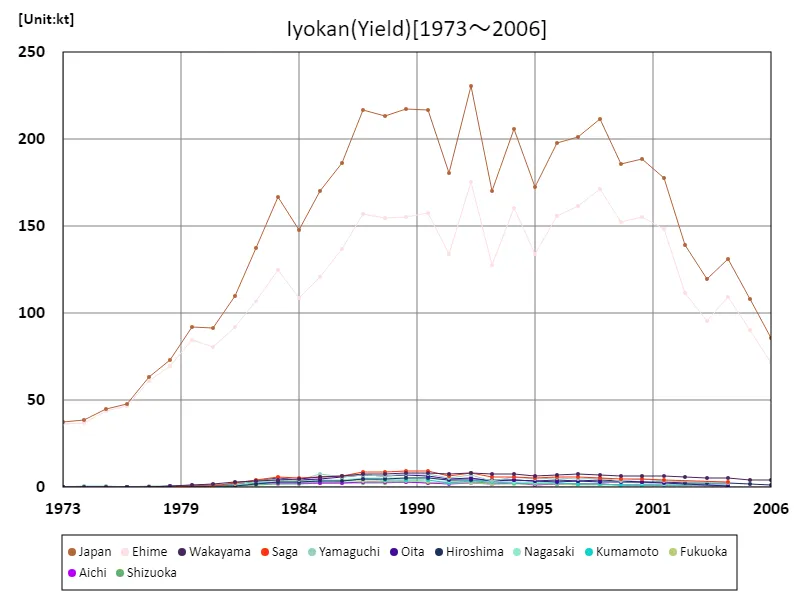
The maximum is 230kt[1992] of Japan, and the current value is about 37.2%
Iyokan harvest volume (by prefecture).
As of 2006, Japan’s iyokan harvest yield shows Ehime Prefecture as the leading producer with 71.2kt, marking it as the highest figure nationwide. This reflects Ehime’s dominant role in iyokan cultivation and its established infrastructure for citrus production. The consistency of Ehime’s top position indicates a well-developed industry in the region, characterized by efficient farming practices and significant output. The data suggests a stable production trend in Ehime, underscoring its importance in Japan’s citrus sector and its impact on national harvest figures.
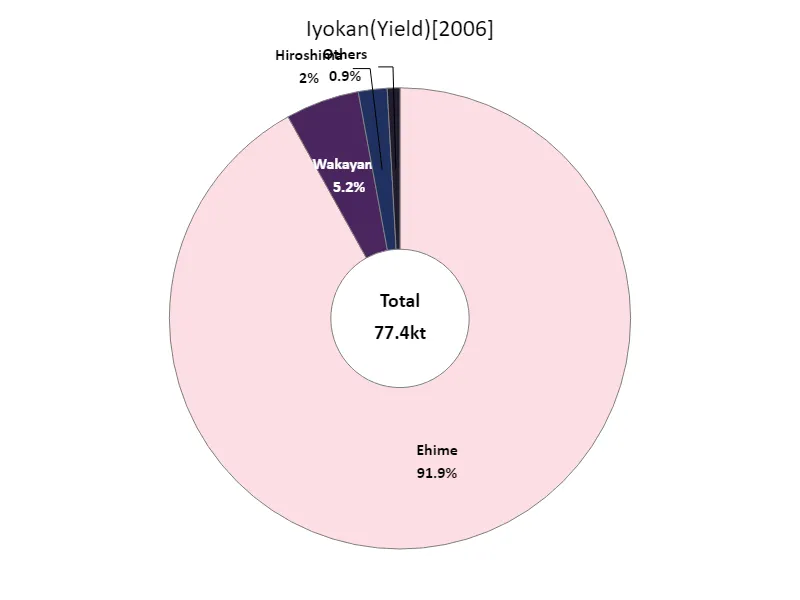
The maximum is 71.2kt of Ehime, the average is 19.4kt, and the total is 77.4kt
Iyokan fruit tree area (main data).
When we look at the changes in the area of fruiting trees in Japan’s iyokan trees between 1973 and 2006, some interesting characteristics emerge. The total maximum fruiting tree area peaked in 1988 at 11.5 kha, but has since declined and is currently at only 55.6% of its peak. This decline is likely due to several factors. One reason is changes in land use, such as urbanization and conversion of agricultural land into residential land. In addition, the decline in the agricultural workforce and its aging population are also contributing to the reduction in the area of fruiting trees. Additionally, economic factors such as changes in market demand and increased imports may also be at play. On the other hand, sustainable agriculture and regional development policies have been implemented, and in some areas there has been an increase in the area of fruiting trees. Going forward, it will be important to develop management strategies that respond to the characteristics and demand of each region, and this will require a review of agricultural policies and the introduction of new technologies.
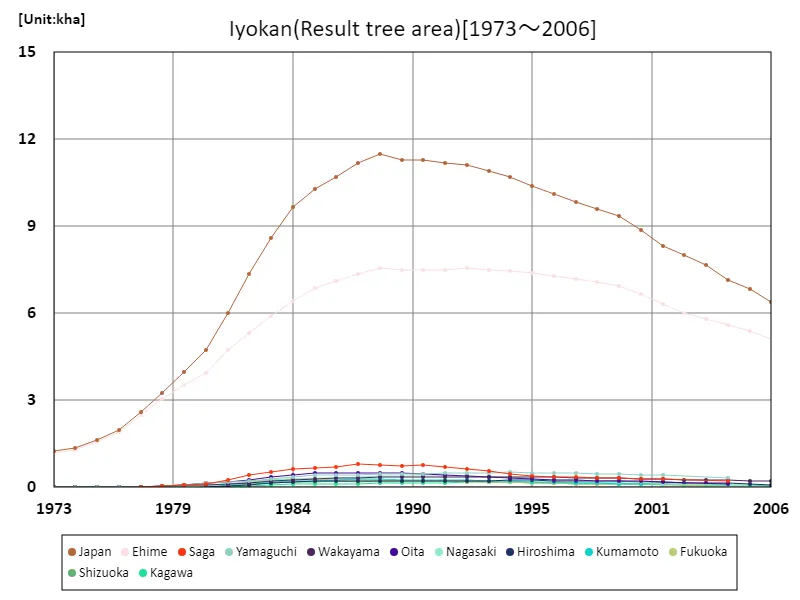
The maximum is 11.5kha[1988] of Japan, and the current value is about 55.6%
Iyokan fruit tree area (by prefecture).
The most recent data (2006) on the area of fruiting iyokan trees in Japan reveals some interesting characteristics. The largest overall bearing tree area was in Ehime Prefecture at 5.13 kha, the highest ever recorded. This suggests that Ehime Prefecture is a major iyokan producing area. One reason for this is that Ehime Prefecture has a warm climate and rich soil conditions, making it ideal for cultivating iyokan. Additionally, advances in agricultural technology and improved cultivation practices may also have contributed to the increase in fruiting tree area. Meanwhile, detailed information is needed to determine the current level of fruiting tree area in other regions, but it is expected that production will vary from region to region. Changes in agricultural policies and market demand are also considered as factors influencing the area of bearing trees per region. Going forward, it will be important to promote sustainable agriculture and improve productivity, and measures tailored to the characteristics and needs of each region will be required.
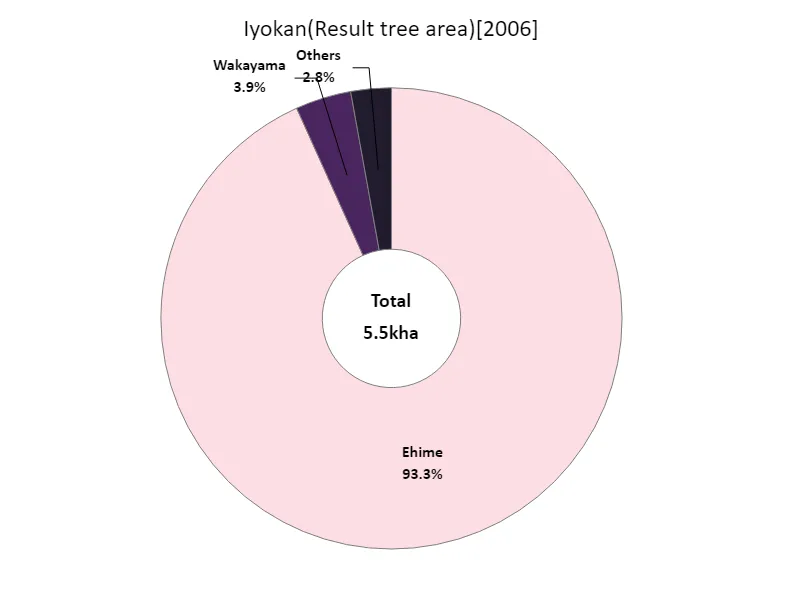
The maximum is 5.13kha of Ehime, the average is 1.38kha, and the total is 5.5kha
Iyokan shipping volume.
In 2006, Japan’s iyokan shipping volumes highlight Ehime Prefecture as the leader with 64.8kt, significantly above the national average of 17.6kt and the total of 70.3kt. This dominance illustrates Ehime’s central role in the iyokan market, with its efficient production and distribution systems. The data reveals a strong regional concentration, with Ehime accounting for the majority of national shipments. This trend underscores Ehime’s critical position in Japan’s citrus industry, emphasizing its key role in meeting both domestic and potential export demands.
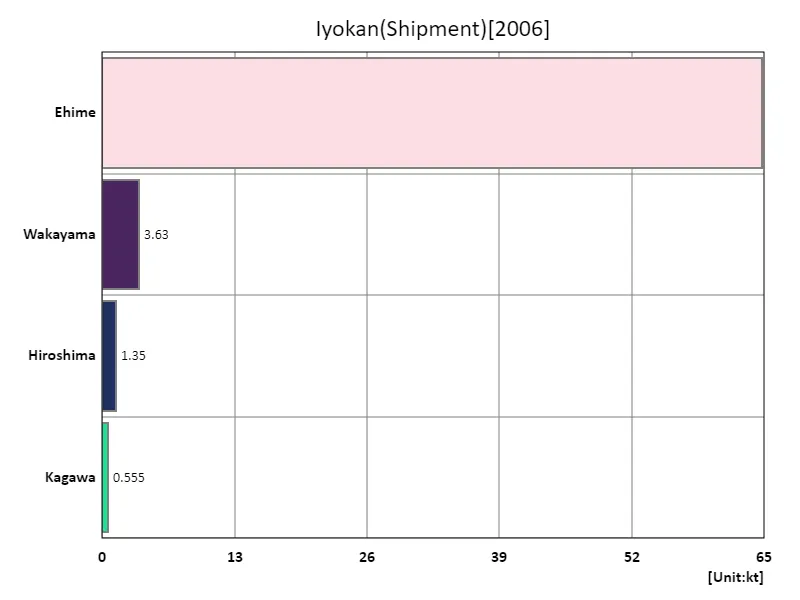
The maximum is 64.8kt of Ehime, the average is 17.6kt, and the total is 70.3kt


Comments