
Abstract
The 1988 data highlights the peak of Natsumikan cultivation in Japan, showcasing its prominence in agriculture. Harvest yield reached a record 221,000 tons nationwide, reflecting strong demand and production capacity. The fruiting tree area also peaked at 9.74 thousand hectares, indicating widespread cultivation efforts. Kumamoto led in shipping volume with 73,500 tons, cementing its role as a key production region. These figures suggest a robust period for Natsumikan, characterized by high productivity and regional specialization. However, evolving consumer preferences and agricultural challenges may have influenced subsequent declines in production and cultivation areas.
Kiwifruit harvest yield (main data).
Natsumikan harvests in Japan peaked in 1983, reaching an impressive 316,000 tons nationwide. This period marked a golden age for production, reflecting strong domestic demand and favorable cultivation conditions. However, by the most recent data, yields have declined to 69.8% of this peak level. This drop highlights changes in agricultural trends, including aging orchards, reduced cultivation areas, and shifts in consumer preferences toward other fruits. Despite these challenges, Natsumikan remains a significant crop in certain regions, celebrated for its distinctive flavor and cultural heritage. Efforts to sustain production focus on improved cultivation techniques and market promotion.
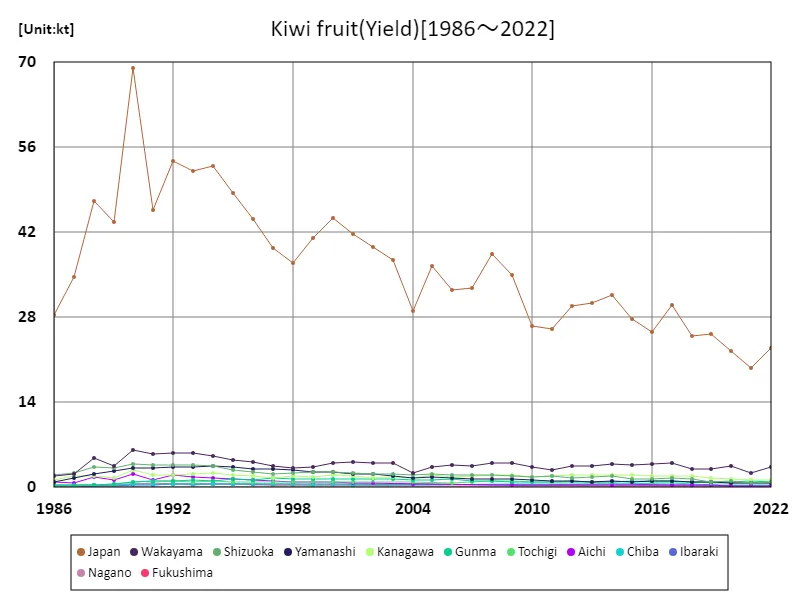
The maximum is 69.1kt[1990] of Japan, and the current value is about 33.1%
Kiwi fruit harvest volume (by prefecture).
As of 1988, Kumamoto leads Japan in Natsumikan orange production, achieving the highest prefectural yield at 81.9kt, maintaining its position as the top producer. This dominance reflects the region’s favorable climate and soil conditions for citrus cultivation. While Kumamoto thrives, overall national production has seen fluctuations, influenced by shifts in consumer preferences and competition from other fruits. Efforts to sustain yields focus on improving cultivation techniques and enhancing fruit quality. The data underscores Kumamoto’s pivotal role in preserving Natsumikan’s legacy within Japan’s agricultural landscape, even amid evolving market trends.
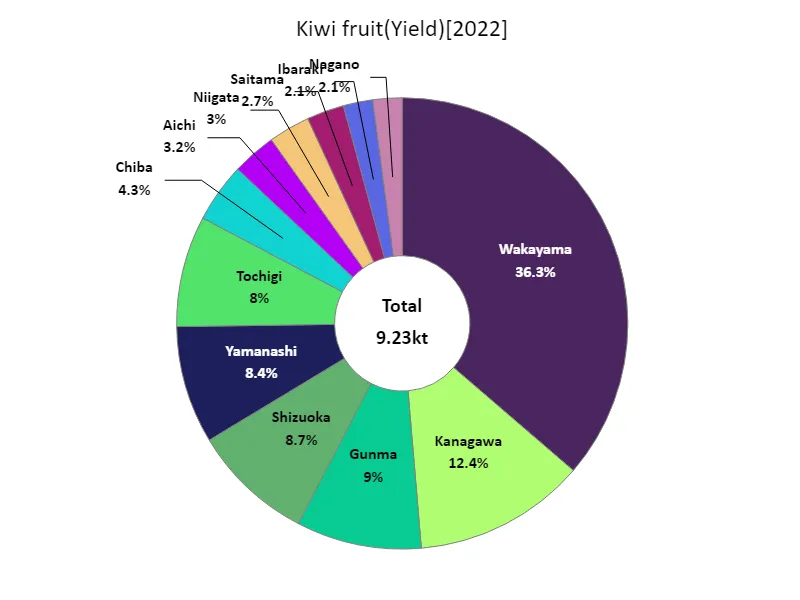
The maximum is 3.35kt of Wakayama, the average is 769t, and the total is 9.23kt
Kiwifruit bearing tree area (main data).
The bearing tree area of sweet Natsumikan in Japan reached its peak in 1984 at 11.2 thousand hectares, reflecting the height of cultivation efforts nationwide. This era showcased widespread agricultural dedication to the fruit, driven by strong demand. However, the most recent data indicates the area has declined to 87% of its peak, highlighting a gradual reduction in cultivation. Contributing factors may include an aging farming population, orchard conversions, and shifting consumer tastes. Despite these changes, Natsumikan remains a culturally and economically important crop, with ongoing efforts to sustain production through modernization and targeted regional support.
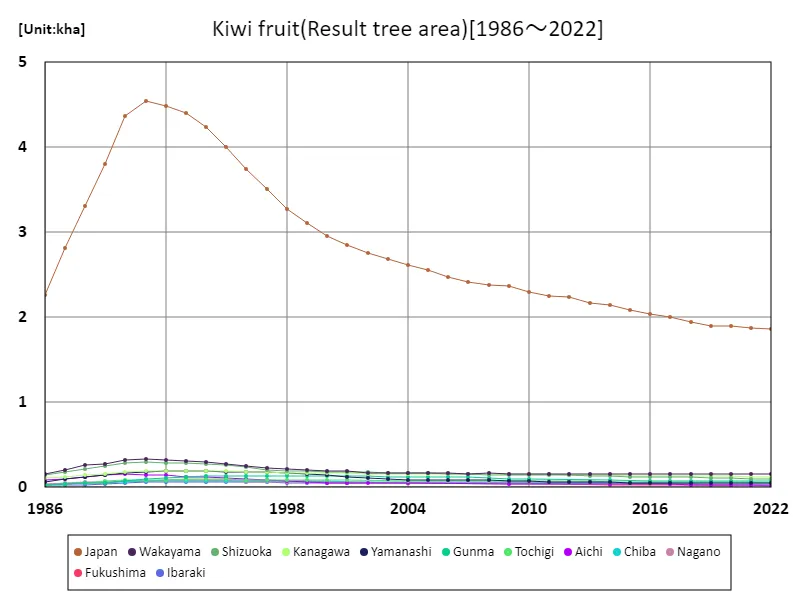
The maximum is 4.54kha[1991] of Japan, and the current value is about 41%
Kiwifruit bearing tree area (by prefecture).
As of 1988, Kumamoto leads Japan in the fruiting tree area for Natsumikan mandarin oranges, with the largest recorded value at 2.59 thousand hectares. This highlights Kumamoto’s pivotal role in Natsumikan cultivation, supported by its ideal climate and long-standing agricultural traditions. While Kumamoto remains dominant, nationwide fruiting tree areas have gradually declined due to factors such as orchard aging, land-use changes, and shifts in market demand. Efforts to preserve and optimize cultivation in leading regions like Kumamoto focus on innovation and quality improvement to adapt to evolving trends and ensure the sustainability of this iconic crop.
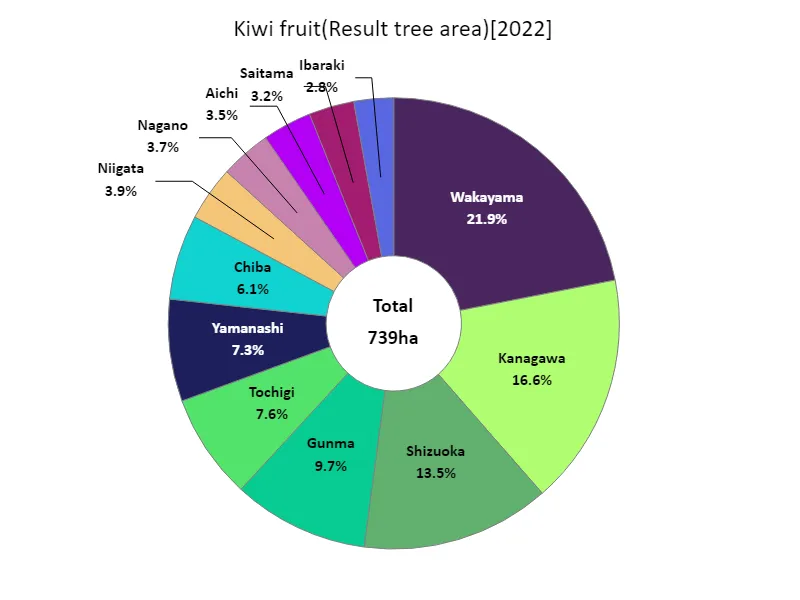
The maximum is 162ha of Wakayama, the average is 61.6ha, and the total is 739ha
Kiwi fruit shipments.
As of 1988, Kumamoto led Japan in the shipping volume of sweet Natsumikan, reaching 73.5kt, significantly above the national average of 8.1kt and contributing to a total of 194kt nationwide. This reflects Kumamoto’s dominance as a production hub, leveraging its favorable climate and efficient distribution networks. The disparity between leading and smaller-producing prefectures highlights regional specialization. While total shipping volumes indicate strong demand during this period, shifts in consumer preferences and competition from other fruits may have influenced subsequent declines. Sustaining the market requires regional collaboration and innovative marketing strategies to adapt to modern trends.
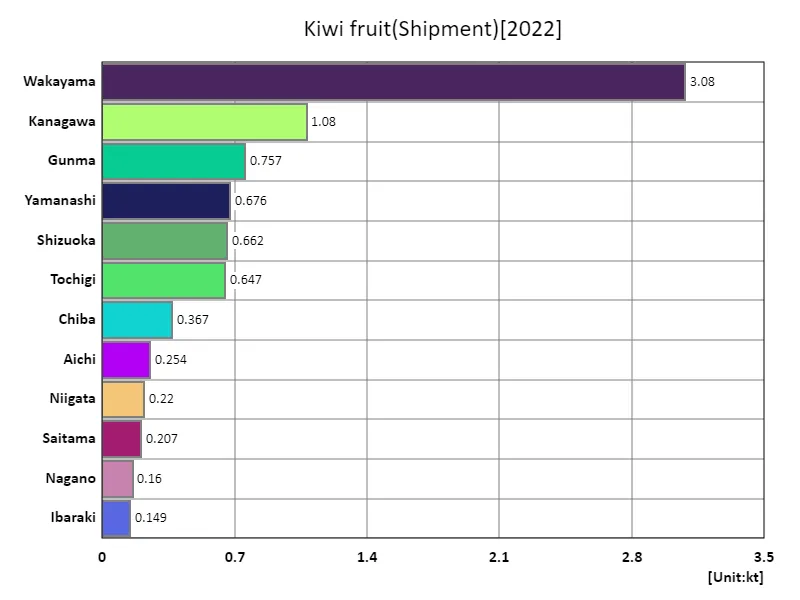
The maximum is 3.08kt of Wakayama, the average is 688t, and the total is 8.26kt
Main data
| Kiwi fruit(Yield) [kt] | ||||||||||
|---|---|---|---|---|---|---|---|---|---|---|
| Japan | Wakayama | Kanagawa | Shizuoka | Gunma | Yamanashi | Tochigi | Chiba | Saitama | Aichi | |
| 2022 | 22.9 | 3.35 | 1.14 | 0.81 | 0.83 | 0.78 | 0.73 | 0.39 | 0.25 | 0.29 |
| 2021 | 19.7 | 2.42 | 1.21 | 0.79 | 0.96 | 0.76 | 0.69 | 0.38 | 0.3 | 0.23 |
| 2020 | 22.5 | 3.45 | 1.4 | 0.97 | 0.83 | 0.78 | 0.68 | 0.34 | 0.32 | 0.28 |
| 2019 | 25.3 | 3.04 | 1.48 | 0.95 | 0.82 | 0.83 | 0.79 | 0.39 | 0.3 | |
| 2018 | 25 | 2.99 | 1.82 | 1.32 | 0.94 | 0.9 | 0.85 | 0.52 | 0.37 | |
| 2017 | 30 | 4.06 | 1.88 | 1.55 | 0.99 | 1.01 | 0.88 | 0.63 | 0.4 | |
| 2016 | 25.6 | 3.81 | 1.88 | 1.37 | 1.09 | 1 | 0.95 | |||
| 2015 | 27.8 | 3.74 | 1.97 | 1.4 | 0.94 | 0.96 | ||||
| 2014 | 31.6 | 3.88 | 1.97 | 1.83 | 0.85 | 1 | 0.93 | 0.55 | 0.37 | 0.43 |
| 2013 | 30.4 | 3.47 | 2.06 | 1.71 | 0.85 | 0.88 | ||||
| 2012 | 29.8 | 3.56 | 1.95 | 1.61 | 1.1 | 0.98 | ||||
| 2011 | 26.1 | 2.93 | 1.82 | 1.79 | 1.04 | 0.93 | ||||
| 2010 | 26.5 | 3.37 | 1.77 | 1.69 | 0.82 | 1.14 | 0.8 | |||
| 2009 | 35 | 4.02 | 2.08 | 1.83 | 0.89 | 1.32 | 0.99 | 0.51 | 0.35 | 0.45 |
| 2008 | 38.4 | 3.95 | 2.09 | 2.03 | 1.09 | 1.44 | 1.04 | |||
| 2007 | 32.8 | 3.46 | 1.89 | 2.02 | 1.08 | 1.37 | 0.83 | |||
| 2006 | 32.5 | 3.66 | 1.67 | 2.03 | 1.3 | 1.56 | 0.71 | |||
| 2005 | 36.4 | 3.37 | 2.03 | 2.19 | 1.27 | 1.64 | ||||
| 2004 | 29.1 | 2.37 | 1.58 | 2.05 | 1.23 | 1.57 | 0.89 | 0.39 | 0.23 | 0.58 |
| 2003 | 37.4 | 3.92 | 1.69 | 2.26 | 1.32 | 1.82 | ||||
| 2002 | 39.6 | 4.05 | 1.58 | 2.27 | 1.4 | 2.12 | 0.77 | |||
| 2001 | 41.8 | 4.23 | 1.79 | 2.38 | 1.34 | 2.17 | 0.87 | 0.44 | 0.75 | |
| 2000 | 44.4 | 4.07 | 2.03 | 2.56 | 1.44 | 2.54 | 0.89 | 0.47 | 0.82 | |
| 1999 | 41.1 | 3.29 | 1.76 | 2.54 | 1.34 | 2.55 | 0.95 | 0.46 | 0.86 | |
| 1998 | 36.9 | 3.21 | 1.82 | 2.31 | 1.37 | 2.84 | 0.9 | 0.47 | 0.92 | |
| 1997 | 39.4 | 3.43 | 1.54 | 2.25 | 1.48 | 3.07 | 0.88 | 0.51 | 0.36 | 1 |
| 1996 | 44.2 | 4.19 | 1.87 | 2.51 | 1.23 | 2.96 | 0.81 | 0.57 | 1.27 | |
| 1995 | 48.5 | 4.5 | 2.02 | 2.89 | 1.36 | 3.3 | 0.87 | 0.55 | 1.34 | |
| 1994 | 52.9 | 5.13 | 2.37 | 3.47 | 1.07 | 3.53 | 1.1 | 0.56 | 0.43 | 1.61 |
| 1993 | 52.1 | 5.68 | 2.25 | 3.6 | 1.14 | 3.29 | 0.87 | 0.5 | 0.36 | 1.7 |
| 1992 | 53.8 | 5.71 | 1.98 | 3.74 | 1.1 | 3.37 | 1.01 | 0.52 | 0.36 | 2.02 |
| 1991 | 45.7 | 5.42 | 2.05 | 3.68 | 0.98 | 3.22 | 0.99 | 0.49 | 0.33 | 1.17 |
| 1990 | 69.1 | 6.19 | 2.79 | 3.84 | 0.84 | 3.21 | 0.83 | 0.51 | 0.31 | 2.11 |
| 1989 | 43.7 | 3.56 | 1.45 | 3.22 | 0.58 | 2.71 | 0.56 | 0.37 | 0.24 | 1.27 |
| 1988 | 47.2 | 4.8 | 1.91 | 3.28 | 0.44 | 2.12 | 0.34 | 0.38 | 0.22 | 1.68 |
| 1987 | 34.6 | 2.25 | 1.81 | 2.28 | 0.33 | 1.45 | 0.23 | 0.37 | 0.21 | 0.7 |
| 1986 | 28.3 | 1.86 | 1.28 | 2.07 | 0.33 | 0.95 | 0.28 | 0.31 | 0.19 | 0.85 |


Comments