Abstract
China boasts an overwhelming share of the world’s honey production, and in 2022 it recorded the largest production volume of 474 kilotons (kt). This result is due to China’s rich natural environment, long history of beekeeping, and adoption of highly efficient production techniques. In recent years, the global production of honey has been gradually increasing, with growth particularly noticeable in Asia. Other major producing countries include Turkey, Argentina, and Ukraine, and production characteristics can be seen by region. In Europe and North America, there are concerns about the decline of bees due to environmental issues and the use of pesticides, and this is a factor that affects production. Overall, demand in the global honey market is increasing as consumers become more health-conscious, and producers around the world are looking for ways to improve quality and sustainable production methods.
Honey production (worldwide)
Looking at data on honey production from 1961 to 2022, China has long been the world’s largest producer, reaching a peak of 563kt in 2016. During this period, China’s production volume was large enough to account for approximately 30% of the world market. However, production has declined in the following years, falling to 474kt in 2022, 84.2% of its peak. Possible factors for this decline include environmental issues, inefficient farming practices, and the spread of disease. Overall, honey production has fluctuated across regions over the past few decades, with growth in some countries, particularly in Asia and South America, and stability or decline in traditional producing countries. These trends are influenced by factors such as climate change, innovations in agricultural technology, and fluctuations in demand in international markets, so attention must be paid to future trends in production volumes.
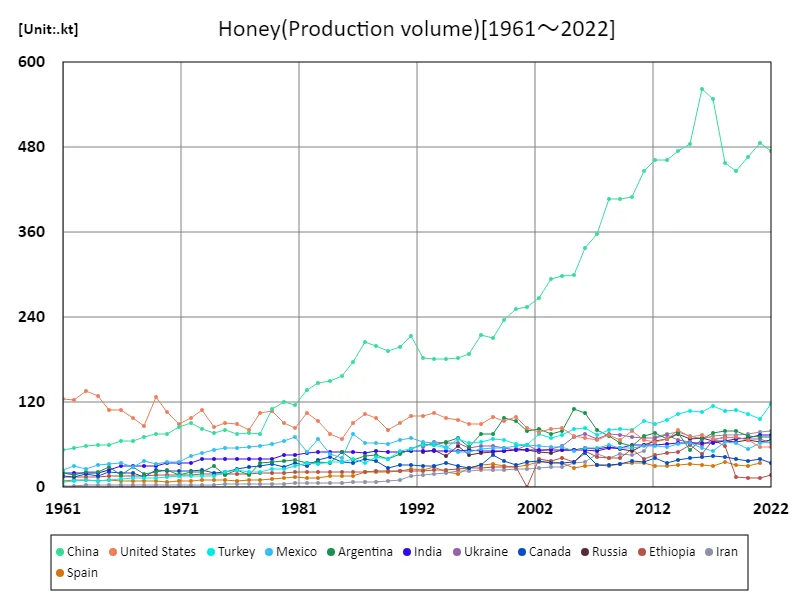
The maximum is 563kt[2016] of China, and the current value is about 84.2%
Honey production volume (latest year, world wide)
Based on 2022 data, global honey production will reach a total of 1.66 million tonnes (Mt), of which China accounts for 474 thousand tonnes (kt), remaining the largest producer. China’s production accounts for about 28.6% of the total, playing an important role in the global market, but it is declining from its previous peak. Other major producing countries include the United States, Argentina and Ukraine, each of which accounts for a notable position in production volume. The overall average production was 13.5kt, a figure that represents the combined total of many small producers around the world. This shows that small-scale honey production is taking place in a variety of regions. In recent years, environmental issues and climate change have led to a decline in production in some countries, while sustainable agriculture and ecosystem protection have had a major impact on production. The honey market is growing alongside an increasingly health-conscious consumer trend, which has led to increased demand, especially for organic honey and locally produced products. Future production trends are expected to be influenced by factors such as climate change, innovations in agricultural technology, and international trade policies.
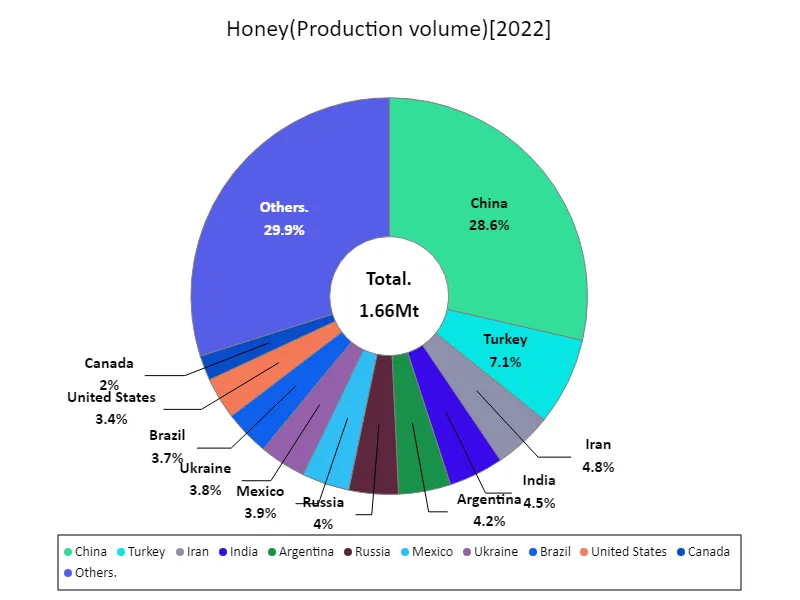
The maximum is 474kt of China, the average is 13.6kt, and the total is 1.66Mt
Beeswax production (worldwide)
According to data for 2022, India is the largest producer of beeswax, with 24.6 thousand tonnes (kt), the highest production to date. This figure reflects the development of beekeeping in India and increasing demand both domestically and internationally. India has vast agricultural land, diverse climatic conditions and many apiaries, which play a vital role in beeswax production. Historically, beeswax production has depended primarily on beekeeping and is correlated with honey production. Besides India, other countries such as China, USA and Brazil are positioned as major producers, but India’s production has increased significantly due to the expansion of its beekeeping industry along with rising international demand. In recent years, demand for beeswax has increased in a wide range of fields, including cosmetics, medicine, and food processing, and it is gaining recognition as a sustainable product. Increasing concerns about environmental protection and agricultural sustainability are also influencing beeswax production and use. This has created pressure on beeswax producing countries, including India, which is at the forefront of beeswax production, to improve quality and establish efficient production methods. Environmental protection policies and fluctuations in international markets will likely have a major impact on future trends.
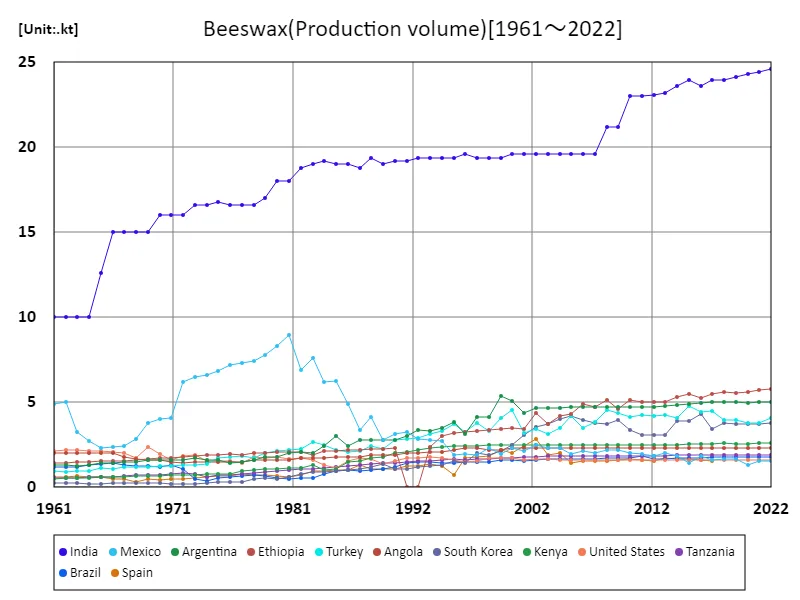
The maximum is the latest one, 24.6kt of India
Beeswax production volume (latest year, worldwide)
Data on beeswax production for 2022 shows that India is the largest producer at 24.6 thousand tonnes (kt), a figure that indicates the size and vigor of India’s beekeeping industry. Beeswax production in India continues to grow in response to increasing domestic and international demand, particularly for its use in the medical, cosmetics and food industries. Overall beeswax production totaled 64.2kt, with an average production of 1.37kt. What we can see from this is that many countries are producing on a small scale. In particular, there are many countries with relatively small production volumes, which drags down the overall average. Beeswax is primarily a by-product of beekeeping, so its production is highly dependent on honey production. As a recent trend, the demand for beeswax has increased as it is recognized as a sustainable product and is being used in various industries. The market for beeswax is expanding amid growing interest in environmental protection and natural products. Looking ahead, the introduction of sustainable beekeeping methods and the development of efficient production technologies will become important, and competition and cooperation among producing countries is expected to increase.
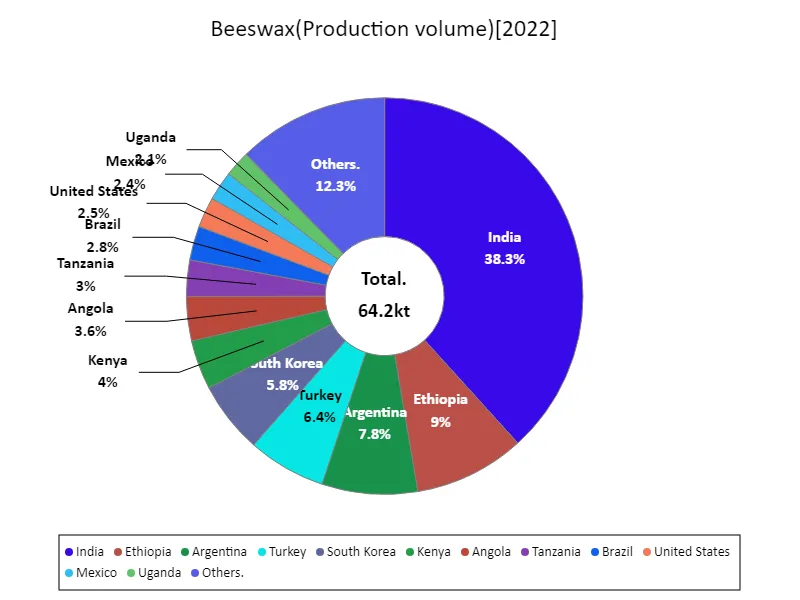
The maximum is 24.6kt of India, the average is 1.37kt, and the total is 64.2kt
Main data
| Production(Honey, Production volume) [Mt] | ||||||||||
|---|---|---|---|---|---|---|---|---|---|---|
| World | Upper-middle-income countries | Asia | Eastern Asia | China | Europe | Lower-middle-income countries | Americas | High-income countries | European Union | |
| 2022 | 1.83 | 0.94 | 0.88 | 0.51 | 0.47 | 0.42 | 0.38 | 0.34 | 0.29 | 0.24 |
| 2021 | 1.79 | 0.91 | 0.86 | 0.52 | 0.49 | 0.4 | 0.38 | 0.34 | 0.35 | 0.23 |
| 2020 | 1.78 | 0.89 | 0.84 | 0.5 | 0.47 | 0.41 | 0.38 | 0.34 | 0.4 | 0.24 |
| 2019 | 1.76 | 0.9 | 0.83 | 0.48 | 0.45 | 0.4 | 0.37 | 0.35 | 0.42 | 0.23 |
| 2018 | 1.84 | 0.9 | 0.82 | 0.49 | 0.46 | 0.43 | 0.38 | 0.35 | 0.43 | 0.25 |
| 2017 | 1.88 | 0.97 | 0.91 | 0.58 | 0.55 | 0.41 | 0.36 | 0.33 | 0.45 | 0.24 |
| 2016 | 1.86 | 0.98 | 0.91 | 0.6 | 0.56 | 0.39 | 0.35 | 0.33 | 0.44 | 0.22 |
| 2015 | 1.82 | 0.89 | 0.83 | 0.52 | 0.48 | 0.42 | 0.36 | 0.32 | 0.47 | 0.25 |
| 2014 | 1.76 | 0.89 | 0.82 | 0.5 | 0.47 | 0.37 | 0.36 | 0.35 | 0.42 | 0.2 |
| 2013 | 1.69 | 0.85 | 0.79 | 0.49 | 0.46 | 0.38 | 0.34 | 0.31 | 0.41 | 0.21 |
| 2012 | 1.64 | 0.84 | 0.77 | 0.49 | 0.46 | 0.36 | 0.33 | 0.32 | 0.39 | 0.19 |
| 2011 | 1.61 | 0.83 | 0.73 | 0.47 | 0.45 | 0.38 | 0.3 | 0.33 | 0.41 | 0.21 |
| 2010 | 1.54 | 0.76 | 0.68 | 0.43 | 0.41 | 0.35 | 0.29 | 0.31 | 0.4 | 0.2 |
| 2009 | 1.51 | 0.76 | 0.68 | 0.44 | 0.41 | 0.35 | 0.29 | 0.29 | 0.38 | 0.19 |
| 2008 | 1.52 | 0.77 | 0.66 | 0.44 | 0.41 | 0.35 | 0.29 | 0.32 | 0.39 | 0.19 |
| 2007 | 1.45 | 0.71 | 0.61 | 0.39 | 0.36 | 0.34 | 0.29 | 0.32 | 0.38 | 0.19 |
| 2006 | 1.51 | 0.73 | 0.59 | 0.36 | 0.34 | 0.36 | 0.29 | 0.36 | 0.41 | 0.2 |
| 2005 | 1.42 | 0.68 | 0.54 | 0.33 | 0.3 | 0.34 | 0.29 | 0.34 | 0.38 | 0.19 |
| 2004 | 1.36 | 0.64 | 0.52 | 0.32 | 0.3 | 0.33 | 0.26 | 0.33 | 0.4 | 0.2 |
| 2003 | 1.34 | 0.62 | 0.51 | 0.32 | 0.29 | 0.31 | 0.26 | 0.33 | 0.39 | 0.19 |
| 2002 | 1.29 | 0.6 | 0.49 | 0.29 | 0.27 | 0.29 | 0.25 | 0.32 | 0.37 | 0.17 |
| 2001 | 1.24 | 0.58 | 0.46 | 0.28 | 0.25 | 0.31 | 0.26 | 0.32 | 0.38 | 0.18 |
| 2000 | 1.26 | 0.58 | 0.45 | 0.27 | 0.25 | 0.29 | 0.24 | 0.34 | 0.38 | 0.17 |
| 1999 | 1.24 | 0.57 | 0.43 | 0.25 | 0.24 | 0.29 | 0.24 | 0.35 | 0.37 | 0.17 |
| 1998 | 1.19 | 0.52 | 0.4 | 0.22 | 0.21 | 0.29 | 0.24 | 0.33 | 0.37 | 0.16 |
| 1997 | 1.16 | 0.52 | 0.4 | 0.23 | 0.22 | 0.28 | 0.24 | 0.3 | 0.34 | 0.16 |
| 1996 | 1.11 | 0.47 | 0.38 | 0.2 | 0.19 | 0.27 | 0.24 | 0.27 | 0.33 | 0.15 |
| 1995 | 1.16 | 0.5 | 0.38 | 0.2 | 0.18 | 0.32 | 0.24 | 0.29 | 0.36 | 0.18 |
| 1994 | 1.13 | 0.47 | 0.37 | 0.19 | 0.18 | 0.29 | 0.25 | 0.3 | 0.36 | 0.16 |
| 1993 | 1.15 | 0.48 | 0.37 | 0.19 | 0.18 | 0.31 | 0.24 | 0.3 | 0.37 | 0.18 |
| 1992 | 1.14 | 0.5 | 0.37 | 0.2 | 0.18 | 0.29 | 0.23 | 0.3 | 0.34 | 0.16 |
| 1991 | 1.24 | 0.69 | 0.36 | 0.23 | 0.21 | 0.41 | 0.15 | 0.31 | 0.34 | 0.15 |
| 1990 | 1.18 | 0.66 | 0.34 | 0.21 | 0.2 | 0.41 | 0.14 | 0.28 | 0.33 | 0.15 |
| 1989 | 1.15 | 0.63 | 0.32 | 0.21 | 0.19 | 0.43 | 0.14 | 0.26 | 0.34 | 0.17 |
| 1988 | 1.18 | 0.66 | 0.33 | 0.21 | 0.2 | 0.41 | 0.13 | 0.3 | 0.34 | 0.15 |
| 1987 | 1.15 | 0.63 | 0.32 | 0.22 | 0.21 | 0.39 | 0.13 | 0.3 | 0.35 | 0.15 |
| 1986 | 1.11 | 0.61 | 0.3 | 0.19 | 0.18 | 0.38 | 0.13 | 0.29 | 0.34 | 0.15 |
| 1985 | 1 | 0.55 | 0.27 | 0.17 | 0.16 | 0.35 | 0.12 | 0.25 | 0.29 | 0.13 |
| 1984 | 0.99 | 0.52 | 0.26 | 0.16 | 0.15 | 0.36 | 0.12 | 0.25 | 0.31 | 0.14 |
| 1983 | 1.05 | 0.56 | 0.26 | 0.16 | 0.15 | 0.39 | 0.12 | 0.28 | 0.34 | 0.16 |
| 1982 | 0.99 | 0.5 | 0.25 | 0.15 | 0.14 | 0.36 | 0.11 | 0.26 | 0.34 | 0.15 |
| 1981 | 0.93 | 0.49 | 0.22 | 0.13 | 0.12 | 0.33 | 0.11 | 0.27 | 0.29 | 0.12 |
| 1980 | 0.9 | 0.48 | 0.21 | 0.13 | 0.12 | 0.31 | 0.11 | 0.26 | 0.28 | 0.11 |
| 1979 | 0.91 | 0.47 | 0.2 | 0.12 | 0.11 | 0.32 | 0.1 | 0.27 | 0.3 | 0.12 |
| 1978 | 0.84 | 0.42 | 0.16 | 0.09 | 0.08 | 0.3 | 0.1 | 0.27 | 0.29 | 0.11 |
| 1977 | 0.81 | 0.43 | 0.16 | 0.09 | 0.08 | 0.33 | 0.09 | 0.22 | 0.25 | 0.1 |
| 1976 | 0.85 | 0.42 | 0.16 | 0.08 | 0.08 | 0.35 | 0.09 | 0.23 | 0.3 | 0.13 |
| 1975 | 0.77 | 0.39 | 0.16 | 0.09 | 0.08 | 0.28 | 0.09 | 0.22 | 0.25 | 0.09 |
| 1974 | 0.79 | 0.41 | 0.15 | 0.08 | 0.08 | 0.31 | 0.09 | 0.22 | 0.25 | 0.09 |
| 1973 | 0.84 | 0.43 | 0.16 | 0.09 | 0.08 | 0.34 | 0.09 | 0.23 | 0.28 | 0.1 |
| 1972 | 0.78 | 0.39 | 0.16 | 0.1 | 0.09 | 0.29 | 0.09 | 0.22 | 0.25 | 0.09 |
| 1971 | 0.77 | 0.39 | 0.16 | 0.09 | 0.09 | 0.31 | 0.08 | 0.2 | 0.26 | 0.1 |
| 1970 | 0.8 | 0.4 | 0.14 | 0.08 | 0.08 | 0.33 | 0.08 | 0.22 | 0.28 | 0.1 |
| 1969 | 0.75 | 0.36 | 0.14 | 0.08 | 0.08 | 0.29 | 0.07 | 0.23 | 0.28 | 0.09 |
| 1968 | 0.74 | 0.38 | 0.13 | 0.08 | 0.07 | 0.32 | 0.07 | 0.19 | 0.24 | 0.1 |
| 1967 | 0.75 | 0.38 | 0.13 | 0.07 | 0.07 | 0.33 | 0.08 | 0.2 | 0.26 | 0.1 |
| 1966 | 0.76 | 0.39 | 0.13 | 0.07 | 0.07 | 0.33 | 0.08 | 0.21 | 0.26 | 0.09 |
| 1965 | 0.71 | 0.36 | 0.11 | 0.07 | 0.06 | 0.28 | 0.07 | 0.22 | 0.25 | 0.08 |
| 1964 | 0.75 | 0.37 | 0.11 | 0.07 | 0.06 | 0.32 | 0.06 | 0.23 | 0.28 | 0.09 |
| 1963 | 0.74 | 0.37 | 0.1 | 0.07 | 0.06 | 0.31 | 0.06 | 0.23 | 0.28 | 0.08 |
| 1962 | 0.68 | 0.34 | 0.1 | 0.07 | 0.06 | 0.28 | 0.06 | 0.21 | 0.24 | 0.07 |
| 1961 | 0.68 | 0.34 | 0.09 | 0.06 | 0.05 | 0.28 | 0.06 | 0.21 | 0.24 | 0.06 |

Comments