
Abstract
In recent years, global pea production has been characterized by shifts in key regions. Historically, Russia has been a dominant producer, consistently leading production with 3.62 million tonnes (Mt) in 2022, reflecting its vast agricultural land and favorable climate. Canada, India, and China have also been significant contributors, with Canada traditionally focusing on export markets, particularly to Europe and Asia. Peas are favored for their versatility in food, feed, and rotation crops. However, changing climatic conditions, policy shifts, and market dynamics are influencing regional outputs, with some areas experiencing reduced yields due to droughts or labor shortages.
Bean production (worldwide)
Pea production has seen significant fluctuations from 1961 to 2022, with Canada reaching its peak of 4.84 million tonnes (Mt) in 2016. Currently, Canada is at 70.8% of this peak, reflecting a decline in production due to factors like changing market demands and climatic challenges. Other major producers include Russia, India, and China, each contributing significantly to global output. The crop has remained important for both food and feed, with Canada historically dominating exports. Trends indicate shifting production patterns driven by economic incentives, climate variability, and evolving trade dynamics.
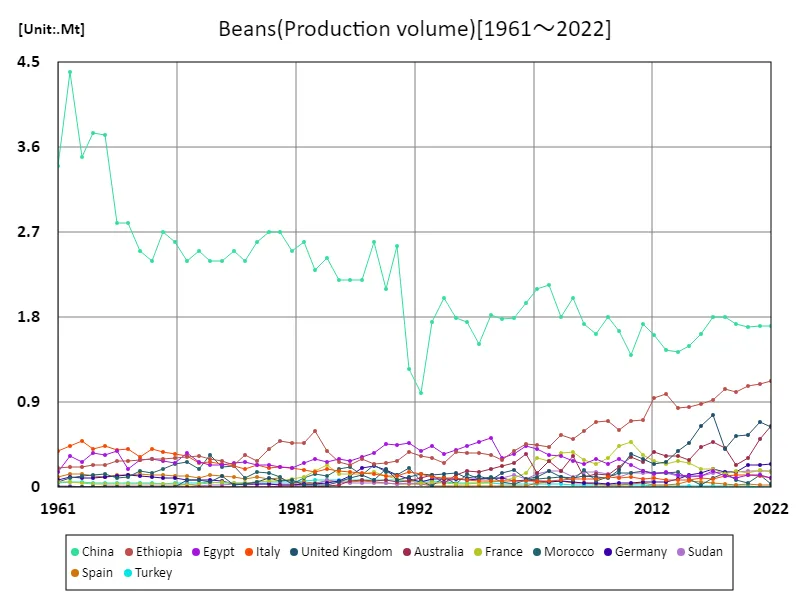
The maximum is 4.4Mt[1962] of China, and the current value is about 38.9%
Bean production (latest year, world wide)
In 2022, global pea production reached a total of 14.2 million tonnes (Mt), with Russia leading at 3.62 Mt, marking the highest production volume. The global average stood at 143,000 tonnes per country. Over recent decades, pea production has been influenced by key producers like Canada, Russia, India, and China. While Russia’s dominance has grown, particularly due to favorable growing conditions and large agricultural areas, global production patterns have also been shaped by market demand, crop rotation practices, and climate variations. Despite fluctuations, peas remain a crucial crop for food and feed worldwide.
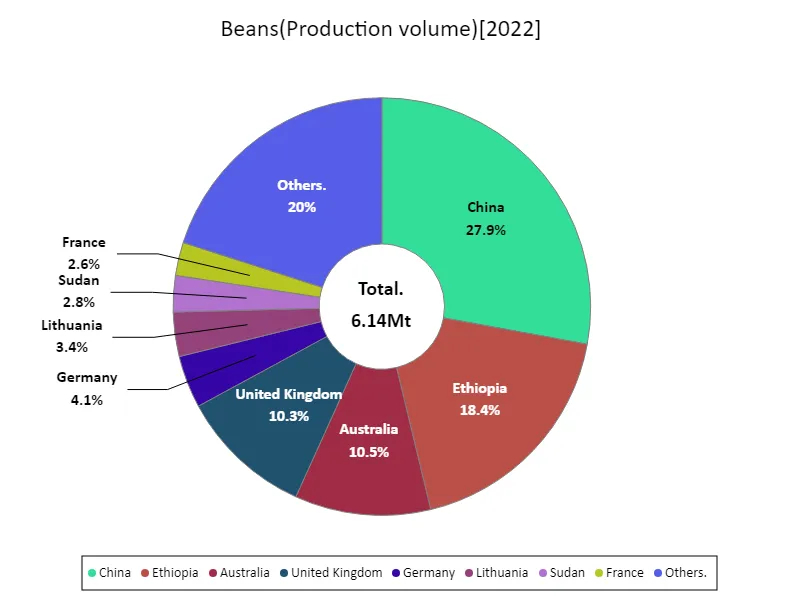
The maximum is 1.71Mt of China, the average is 89kt, and the total is 6.14Mt
Seed production (worldwide)
In 2022, India led global pulse bean production with a maximum of 27.7 million tonnes (Mt), reflecting its dominant role in the pulse market. Pulses, including beans, are critical for food security, particularly in developing regions. India’s production is driven by its large agricultural sector and diverse climate zones, supporting crops like chickpeas, lentils, and beans. Trends show rising demand for pulses due to their nutritional value and use in crop rotation. However, production faces challenges from climatic variability, pests, and fluctuating global market prices, influencing yield stability.
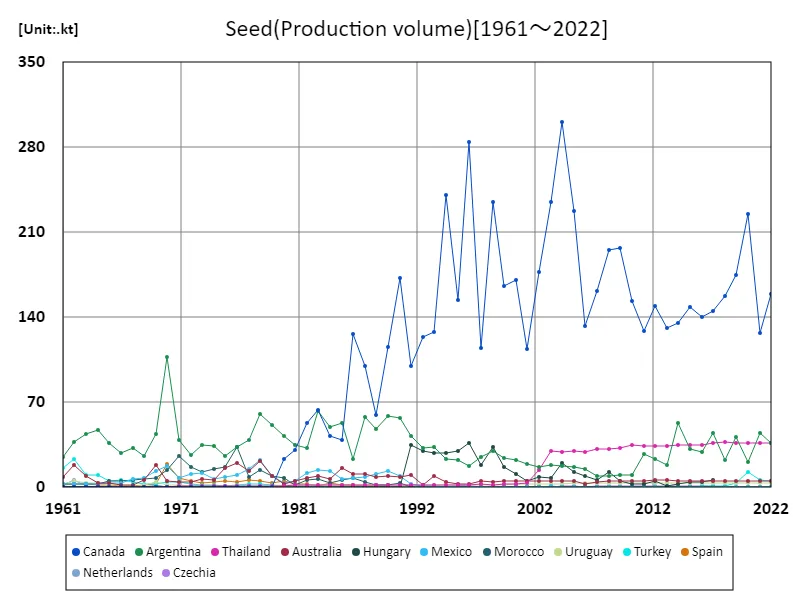
The maximum is 301kt[2004] of Canada, and the current value is about 53%
Seed production (latest year, by country)
In 2022, global pulse bean production reached 96 million tonnes (Mt), with India leading at 27.7 Mt, the highest for any country. The global average was 558,000 tonnes per producer. Pulses, including beans, are vital for nutrition and sustainable agriculture, especially in regions with high protein demands. India’s large-scale production is driven by favorable conditions and a growing domestic market. Trends indicate increased global demand for pulses due to their health benefits and role in crop rotation. However, challenges like climate change, pests, and market fluctuations affect production stability.
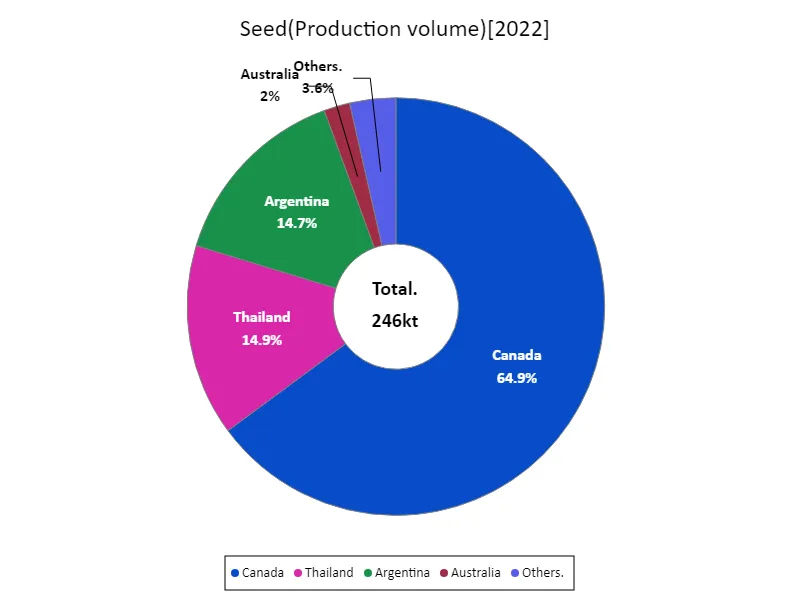
The maximum is 159kt of Canada, the average is 27.3kt, and the total is 246kt
Main data
| Production(Beans, Production volume) [Mt] | ||||||||||
|---|---|---|---|---|---|---|---|---|---|---|
| World | High-income countries | Upper-middle-income countries | Europe | Asia | Eastern Asia | China | Net Food Importing Developing Countries | Africa | Low Income Food Deficit Countries | |
| 2022 | 6.14 | 2.57 | 1.94 | 1.93 | 1.79 | 1.71 | 1.71 | 1.61 | 1.55 | 1.35 |
| 2021 | 6.01 | 2.33 | 1.94 | 1.85 | 1.79 | 1.71 | 1.71 | 1.7 | 1.64 | 1.32 |
| 2020 | 5.7 | 2.12 | 1.94 | 1.84 | 1.79 | 1.7 | 1.7 | 1.58 | 1.53 | 1.3 |
| 2019 | 5.36 | 1.81 | 1.96 | 1.61 | 1.81 | 1.73 | 1.73 | 1.54 | 1.49 | 1.22 |
| 2018 | 5.56 | 1.81 | 2.04 | 1.43 | 1.9 | 1.81 | 1.81 | 1.65 | 1.6 | 1.26 |
| 2017 | 5.68 | 2.1 | 2.02 | 1.64 | 1.9 | 1.8 | 1.8 | 1.5 | 1.45 | 1.13 |
| 2016 | 5.07 | 1.88 | 1.85 | 1.47 | 1.72 | 1.63 | 1.63 | 1.31 | 1.25 | 1.05 |
| 2015 | 4.65 | 1.57 | 1.73 | 1.3 | 1.59 | 1.5 | 1.5 | 1.32 | 1.26 | 1.02 |
| 2014 | 4.46 | 1.35 | 1.66 | 1.03 | 1.53 | 1.43 | 1.43 | 1.42 | 1.35 | 1.02 |
| 2013 | 4.5 | 1.15 | 1.69 | 0.83 | 1.55 | 1.46 | 1.46 | 1.64 | 1.58 | 1.21 |
| 2012 | 4.65 | 1.23 | 1.83 | 0.86 | 1.71 | 1.61 | 1.61 | 1.56 | 1.5 | 1.16 |
| 2011 | 4.6 | 1.23 | 1.95 | 0.98 | 1.83 | 1.73 | 1.73 | 1.38 | 1.33 | 0.93 |
| 2010 | 4.49 | 1.44 | 1.62 | 1.14 | 1.52 | 1.4 | 1.4 | 1.38 | 1.32 | 0.91 |
| 2009 | 4.36 | 1.09 | 1.88 | 0.9 | 1.76 | 1.65 | 1.65 | 1.34 | 1.29 | 0.78 |
| 2008 | 4.22 | 0.78 | 2.05 | 0.68 | 1.92 | 1.8 | 1.8 | 1.35 | 1.28 | 0.91 |
| 2007 | 4.02 | 0.74 | 1.86 | 0.62 | 1.73 | 1.62 | 1.62 | 1.38 | 1.32 | 0.91 |
| 2006 | 4.11 | 0.79 | 1.96 | 0.71 | 1.83 | 1.73 | 1.73 | 1.31 | 1.26 | 0.82 |
| 2005 | 4.46 | 1.08 | 2.23 | 0.78 | 2.11 | 2 | 2 | 1.11 | 1.06 | 0.69 |
| 2004 | 4.33 | 0.94 | 2.04 | 0.81 | 1.93 | 1.81 | 1.81 | 1.28 | 1.25 | 0.79 |
| 2003 | 4.55 | 0.97 | 2.36 | 0.72 | 2.26 | 2.14 | 2.14 | 1.16 | 1.13 | 0.66 |
| 2002 | 4.34 | 0.81 | 2.3 | 0.67 | 2.21 | 2.1 | 2.1 | 1.18 | 1.14 | 0.65 |
| 2001 | 4.16 | 0.82 | 2.15 | 0.49 | 2.04 | 1.95 | 1.95 | 1.15 | 1.11 | 0.59 |
| 2000 | 3.79 | 0.75 | 2.02 | 0.5 | 1.9 | 1.79 | 1.79 | 1.01 | 0.96 | 0.55 |
| 1999 | 3.57 | 0.69 | 1.98 | 0.48 | 1.9 | 1.78 | 1.78 | 0.86 | 0.82 | 0.42 |
| 1998 | 3.82 | 0.6 | 2.03 | 0.41 | 1.95 | 1.83 | 1.83 | 1.16 | 1.12 | 0.47 |
| 1997 | 3.43 | 0.56 | 1.74 | 0.42 | 1.65 | 1.52 | 1.52 | 1.1 | 1.06 | 0.48 |
| 1996 | 3.69 | 0.55 | 1.96 | 0.39 | 1.88 | 1.75 | 1.75 | 1.13 | 1.12 | 0.48 |
| 1995 | 3.62 | 0.6 | 2 | 0.48 | 1.92 | 1.79 | 1.79 | 0.98 | 0.95 | 0.5 |
| 1994 | 3.64 | 0.54 | 2.19 | 0.49 | 2.14 | 2 | 2 | 0.86 | 0.83 | 0.35 |
| 1993 | 3.54 | 0.64 | 1.95 | 0.52 | 1.9 | 1.75 | 1.75 | 0.9 | 0.88 | 0.38 |
| 1992 | 2.78 | 0.61 | 1.23 | 0.52 | 1.13 | 1 | 1 | 0.89 | 0.89 | 0.38 |
| 1991 | 3.36 | 0.61 | 1.52 | 0.57 | 1.38 | 1.25 | 1.25 | 1.18 | 1.17 | 0.43 |
| 1990 | 4.35 | 0.59 | 2.77 | 0.56 | 2.65 | 2.55 | 2.55 | 0.96 | 0.95 | 0.34 |
| 1989 | 4.22 | 0.86 | 2.34 | 0.8 | 2.2 | 2.1 | 2.1 | 1 | 0.99 | 0.33 |
| 1988 | 4.66 | 0.86 | 2.84 | 0.8 | 2.71 | 2.6 | 2.6 | 0.94 | 0.93 | 0.32 |
| 1987 | 4.24 | 0.9 | 2.44 | 0.83 | 2.31 | 2.2 | 2.2 | 0.87 | 0.87 | 0.36 |
| 1986 | 4.06 | 0.74 | 2.44 | 0.68 | 2.31 | 2.2 | 2.2 | 0.85 | 0.86 | 0.3 |
| 1985 | 4.03 | 0.6 | 2.51 | 0.59 | 2.29 | 2.2 | 2.2 | 0.9 | 0.9 | 0.33 |
| 1984 | 4.3 | 0.64 | 2.72 | 0.64 | 2.52 | 2.43 | 2.43 | 0.93 | 0.93 | 0.48 |
| 1983 | 4.18 | 0.5 | 2.55 | 0.51 | 2.4 | 2.3 | 2.3 | 1.12 | 1.12 | 0.64 |
| 1982 | 4.3 | 0.47 | 2.89 | 0.49 | 2.69 | 2.6 | 2.6 | 0.93 | 0.92 | 0.52 |
| 1981 | 4.07 | 0.49 | 2.74 | 0.53 | 2.59 | 2.5 | 2.5 | 0.83 | 0.83 | 0.52 |
| 1980 | 4.49 | 0.53 | 3.02 | 0.59 | 2.78 | 2.7 | 2.7 | 0.92 | 0.93 | 0.54 |
| 1979 | 4.48 | 0.53 | 3.02 | 0.59 | 2.78 | 2.7 | 2.7 | 0.91 | 0.91 | 0.46 |
| 1978 | 4.29 | 0.54 | 2.95 | 0.64 | 2.69 | 2.6 | 2.6 | 0.78 | 0.79 | 0.33 |
| 1977 | 3.96 | 0.43 | 2.72 | 0.52 | 2.48 | 2.4 | 2.4 | 0.78 | 0.79 | 0.37 |
| 1976 | 4.13 | 0.49 | 2.76 | 0.51 | 2.58 | 2.5 | 2.5 | 0.84 | 0.86 | 0.29 |
| 1975 | 4.24 | 0.66 | 2.72 | 0.73 | 2.48 | 2.4 | 2.4 | 0.83 | 0.85 | 0.32 |
| 1974 | 4.26 | 0.63 | 2.67 | 0.65 | 2.49 | 2.4 | 2.4 | 0.96 | 0.96 | 0.32 |
| 1973 | 4.24 | 0.61 | 2.76 | 0.61 | 2.58 | 2.5 | 2.5 | 0.87 | 0.87 | 0.35 |
| 1972 | 4.45 | 0.7 | 2.69 | 0.71 | 2.48 | 2.4 | 2.4 | 1.05 | 1.04 | 0.37 |
| 1971 | 4.47 | 0.71 | 2.87 | 0.71 | 2.68 | 2.61 | 2.6 | 0.88 | 0.88 | 0.34 |
| 1970 | 4.52 | 0.76 | 2.93 | 0.76 | 2.78 | 2.71 | 2.7 | 0.83 | 0.82 | 0.32 |
| 1969 | 4.26 | 0.81 | 2.64 | 0.81 | 2.48 | 2.41 | 2.4 | 0.81 | 0.8 | 0.32 |
| 1968 | 4.3 | 0.74 | 2.75 | 0.74 | 2.59 | 2.51 | 2.5 | 0.8 | 0.79 | 0.31 |
| 1967 | 4.54 | 0.81 | 3.08 | 0.83 | 2.9 | 2.81 | 2.8 | 0.64 | 0.62 | 0.31 |
| 1966 | 4.64 | 0.76 | 3.05 | 0.77 | 2.89 | 2.82 | 2.8 | 0.81 | 0.8 | 0.3 |
| 1965 | 5.59 | 0.79 | 3.99 | 0.8 | 3.83 | 3.75 | 3.74 | 0.79 | 0.78 | 0.26 |
| 1964 | 5.56 | 0.76 | 3.99 | 0.76 | 3.84 | 3.77 | 3.75 | 0.81 | 0.78 | 0.26 |
| 1963 | 5.31 | 0.88 | 3.76 | 0.9 | 3.59 | 3.51 | 3.5 | 0.67 | 0.65 | 0.24 |
| 1962 | 6.2 | 0.85 | 4.64 | 0.85 | 4.51 | 4.42 | 4.4 | 0.71 | 0.68 | 0.24 |
| 1961 | 4.84 | 0.75 | 3.62 | 0.75 | 3.5 | 3.42 | 3.4 | 0.47 | 0.45 | 0.22 |


Comments