Abstract
Canada is a major exporter of peas, with exports reaching 2.76 million tonnes (Mt) in 2021, dominating the global pea market. Pea production in Canada is supported by vast acreage and favorable climatic conditions, particularly in Manitoba and Saskatchewan. Over the past few decades, Canada has established itself in the international market by ensuring the quality and availability of peas. Its export destinations include India, China and European Union countries, where demand is high. Although pea export volumes are affected by changes in agricultural policy, weather conditions and the international supply and demand balance, Canada’s strong production base and logistics network underpin its competitiveness. In addition, demand for peas as a protein source is increasing due to growing health consciousness, and this is expected to influence future market trends.
Pea exports (worldwide)
According to data from 1961 to 2021, Canada has a notable presence in pea exports, with exports reaching an all-time high of 3.81 million tonnes (Mt) in 2020. This peak was made possible by Canada’s vast farmland and advanced agricultural techniques, which greatly enhanced its competitiveness in the international market. Canadian pea exports have remained consistently high based on historical data, with demand from India and China in particular having a major impact. However, data from 2020 onwards shows Canadian pea exports have been gradually declining, with 2021 volumes equivalent to 72.4% of the peak. This decline could be due to a number of factors, including poor weather, increased market competition, and shifts in the international supply and demand balance. Nevertheless, Canadian pea production still plays an important role globally, and maintaining quality and security of supply will contribute to Canadian competitiveness in the future.
The maximum is 4.84Mt[2016] of Canada, and the current value is about 70.8%
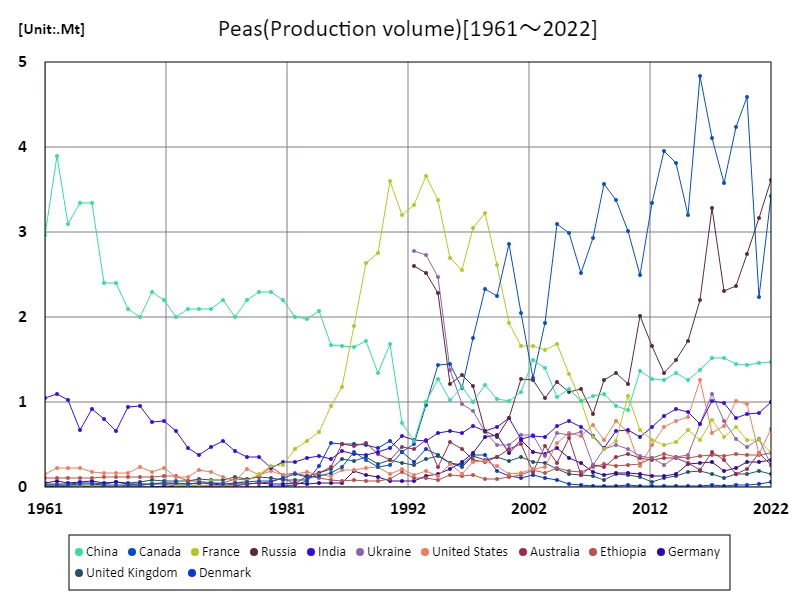
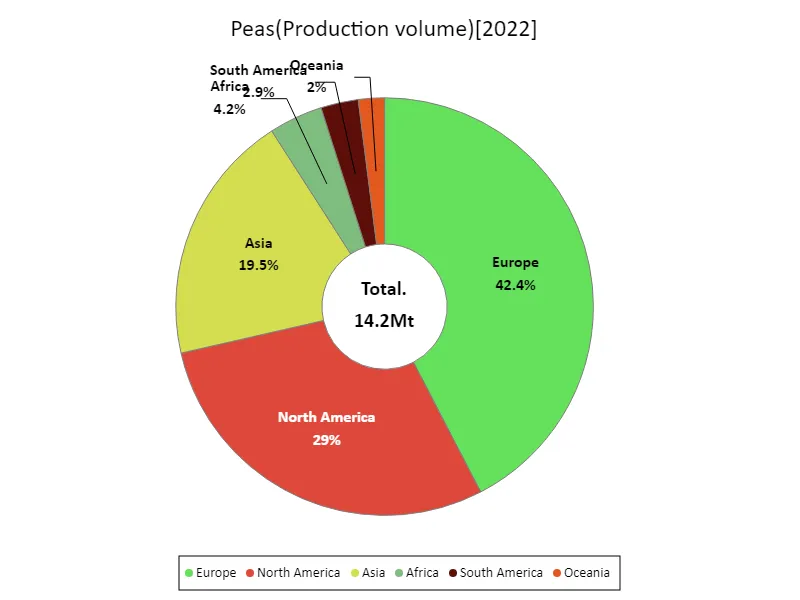
Pea exports (latest year, countries around the world)
Data for 2021 shows that global exports of peas were 6.01 million tonnes (Mt), of which Canada accounted for the largest share at 2.76 Mt, making it the dominant player in the global market. Canada is a major producer of peas, with vast acreage and suitable climatic conditions to support production. Canadian pea exports are characterised by a steady supply of produce to meet demand, particularly to India, China and European Union countries. The overall average export volume was 52.7 thousand tonnes (kt), highlighting Canada’s large share. The data shows that the pea market is dominated by a few major exporting countries, although other producing countries also play a role. Canada’s leadership depends on its ability to control quality and provide a stable supply in international markets, thereby meeting the international demand for peas. Future market trends may depend on climate change and changes in international trade policies, but Canada’s influence is expected to continue for some time.
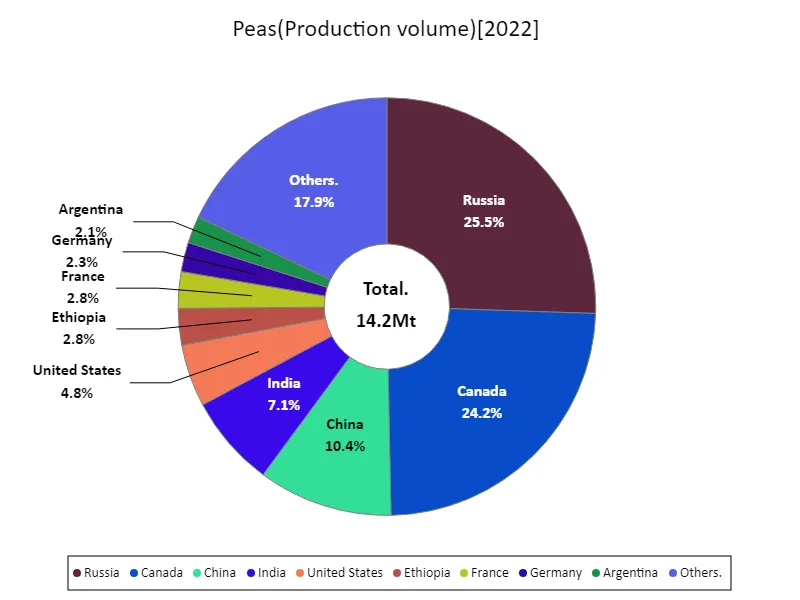
The maximum is 3.62Mt of Russia, the average is 143kt, and the total is 14.2Mt
Pea exports (continental)
According to 2021 data, global pea exports stood at 4.32 million tonnes (Mt), with North America accounting for the largest share. Canada in particular plays a central role, with the largest export volume in North America. Canada’s pea production is supported by vast acreage and favorable climatic conditions, making it competitive in international markets. North America is a major exporter of peas, maintaining quality and supply while meeting changing demand from India, China and Europe. Data from the past few decades shows that North American pea exports have remained consistently high, establishing a leadership position in the world market. This trend has held firm to North America’s position, although it has also been influenced by advances in agricultural technology and changes in trade policies. North American pea exports are expected to continue to play a key role in future market trends.
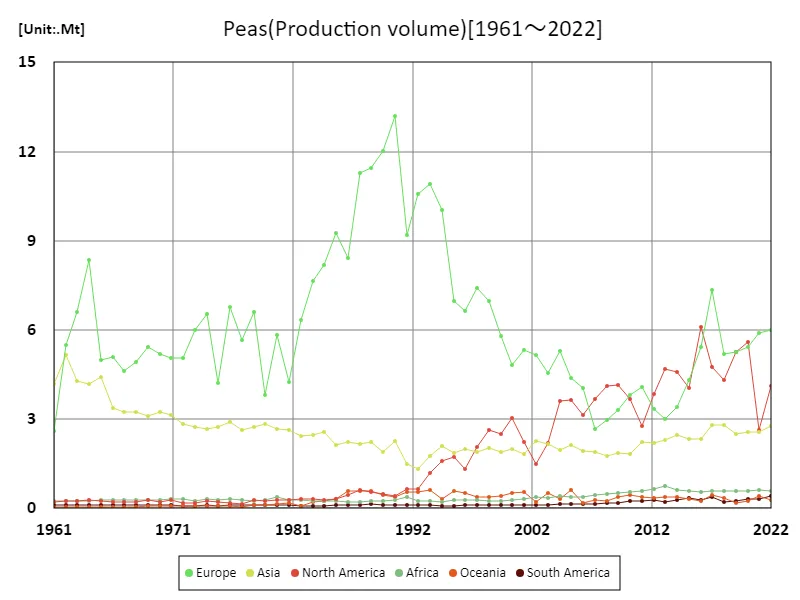
The maximum is 13.2Mt[1990] of Europe, and the current value is about 45.5%
Pea exports (latest year, continental)
Global exports of peas in 2021 were 6.01 million tonnes (Mt), of which North America accounted for 3.13 Mt, making it the largest export region, accounting for about 52% of the total. North American pea exports are primarily driven by Canada, whose vast farmland and favorable climate facilitate production. North America’s dominant export share is due to the region’s stable production and high-quality pea supplies. The average export volume of peas is 1 million tonnes, with North America’s dominating share showing that export volumes from other regions are relatively small. Data so far shows that while North America is dominating the pea market, other regions are also playing a role. In particular, Canadian peas are steadily supplied to meet demand in India, China and European Union countries, making them a reliable source of supply in international markets. Going forward, North America is expected to remain a dominant player in the pea market, although changes in climate change and international trade policies may have an impact. It remains important to maintain a stable supply and quality while closely monitoring market trends.
The maximum is 6Mt of Europe, the average is 2.36Mt, and the total is 14.2Mt
Main data
| Production(Peas, Production volume) [Mt] | ||||||||||
|---|---|---|---|---|---|---|---|---|---|---|
| World | High-income countries | Europe | Upper-middle-income countries | Americas | Eastern Europe | North America | Northern America | Russia | Canada | |
| 2022 | 14.17 | 6.43 | 6 | 5.79 | 4.52 | 4.32 | 4.11 | 4.11 | 3.62 | 3.42 |
| 2021 | 12.44 | 5.1 | 5.9 | 5.2 | 2.94 | 4.22 | 2.64 | 2.64 | 3.17 | 2.24 |
| 2020 | 14.68 | 7.9 | 5.43 | 4.78 | 5.89 | 3.63 | 5.58 | 5.58 | 2.74 | 4.59 |
| 2019 | 14.04 | 7.59 | 5.25 | 4.36 | 5.51 | 3.46 | 5.26 | 5.25 | 2.37 | 4.24 |
| 2018 | 13.44 | 6.62 | 5.2 | 4.38 | 4.53 | 3.54 | 4.31 | 4.3 | 2.3 | 3.58 |
| 2017 | 16.31 | 7.92 | 7.35 | 5.59 | 5.13 | 5.14 | 4.76 | 4.76 | 3.29 | 4.11 |
| 2016 | 14.92 | 8.67 | 5.41 | 4.08 | 6.37 | 3.38 | 6.1 | 6.1 | 2.2 | 4.84 |
| 2015 | 11.93 | 6.47 | 4.31 | 3.48 | 4.37 | 2.49 | 4.04 | 4.03 | 1.72 | 3.2 |
| 2014 | 11.71 | 6.41 | 3.4 | 3.27 | 4.86 | 2.14 | 4.59 | 4.59 | 1.5 | 3.81 |
| 2013 | 11.28 | 6.34 | 2.99 | 2.97 | 4.88 | 1.86 | 4.68 | 4.67 | 1.35 | 3.96 |
| 2012 | 10.64 | 5.43 | 3.33 | 3.39 | 4.14 | 2.25 | 3.85 | 3.84 | 1.66 | 3.34 |
| 2011 | 10.28 | 4.77 | 4.08 | 3.82 | 3 | 2.65 | 2.76 | 2.76 | 2.02 | 2.5 |
| 2010 | 10.5 | 6.17 | 3.81 | 2.51 | 3.9 | 1.91 | 3.67 | 3.66 | 1.22 | 3.02 |
| 2009 | 10.4 | 5.95 | 3.32 | 2.64 | 4.34 | 2.06 | 4.16 | 4.16 | 1.35 | 3.38 |
| 2008 | 9.77 | 5.56 | 2.95 | 2.66 | 4.3 | 1.93 | 4.13 | 4.12 | 1.26 | 3.56 |
| 2007 | 9.13 | 5.45 | 2.66 | 2.23 | 3.84 | 1.35 | 3.68 | 3.67 | 0.86 | 2.93 |
| 2006 | 9.78 | 5.42 | 4.03 | 2.47 | 3.28 | 2.09 | 3.13 | 3.12 | 1.15 | 2.52 |
| 2005 | 11.28 | 6.77 | 4.38 | 2.57 | 3.77 | 2.06 | 3.63 | 3.63 | 1.12 | 2.99 |
| 2004 | 11.74 | 7.17 | 5.28 | 2.63 | 3.75 | 2.28 | 3.62 | 3.62 | 1.24 | 3.1 |
| 2003 | 9.89 | 5.68 | 4.55 | 2.75 | 2.3 | 1.68 | 2.18 | 2.17 | 1.05 | 1.93 |
| 2002 | 9.62 | 4.81 | 5.14 | 3.07 | 1.62 | 2.19 | 1.51 | 1.5 | 1.26 | 1.28 |
| 2001 | 10.35 | 6.03 | 5.33 | 2.69 | 2.33 | 2.27 | 2.22 | 2.22 | 1.27 | 2.04 |
| 2000 | 10.71 | 6.87 | 4.8 | 2.11 | 3.13 | 1.66 | 3.03 | 3.02 | 0.81 | 2.86 |
| 1999 | 10.95 | 7.39 | 5.78 | 1.93 | 2.61 | 1.61 | 2.51 | 2.5 | 0.6 | 2.25 |
| 1998 | 12.39 | 8.39 | 6.97 | 2.25 | 2.76 | 1.95 | 2.65 | 2.64 | 0.66 | 2.34 |
| 1997 | 12.15 | 7.4 | 7.42 | 2.66 | 2.19 | 2.76 | 2.07 | 2.06 | 1.2 | 1.76 |
| 1996 | 10.85 | 5.92 | 6.64 | 2.85 | 1.43 | 2.92 | 1.33 | 1.32 | 1.32 | 1.17 |
| 1995 | 11.47 | 6.49 | 6.96 | 2.51 | 1.8 | 3.23 | 1.73 | 1.72 | 1.21 | 1.45 |
| 1994 | 14.32 | 6.96 | 10.04 | 3.88 | 1.68 | 5.43 | 1.59 | 1.58 | 2.29 | 1.44 |
| 1993 | 14.82 | 7.17 | 10.92 | 3.94 | 1.27 | 6.06 | 1.17 | 1.17 | 2.53 | 0.97 |
| 1992 | 13.41 | 5.77 | 10.56 | 3.93 | 0.77 | 6.29 | 0.66 | 0.65 | 2.61 | 0.5 |
| 1991 | 12.34 | 5.81 | 9.19 | 5.44 | 0.76 | 4.91 | 0.63 | 0.63 | 0.41 | |
| 1990 | 16.64 | 6.06 | 13.19 | 9.72 | 0.53 | 8.34 | 0.43 | 0.42 | 0.26 | |
| 1989 | 15.18 | 5.35 | 12.02 | 9.05 | 0.61 | 8.15 | 0.48 | 0.47 | 0.23 | |
| 1988 | 15.2 | 5.57 | 11.46 | 8.91 | 0.69 | 7.55 | 0.55 | 0.55 | 0.32 | |
| 1987 | 14.99 | 4.79 | 11.27 | 9.46 | 0.74 | 8.09 | 0.63 | 0.62 | 0.42 | |
| 1986 | 11.99 | 3.64 | 8.41 | 7.58 | 0.55 | 6.11 | 0.45 | 0.44 | 0.24 | |
| 1985 | 12.38 | 2.84 | 9.27 | 8.83 | 0.41 | 7.35 | 0.31 | 0.3 | 0.17 | |
| 1984 | 11.62 | 2.1 | 8.2 | 8.8 | 0.38 | 6.92 | 0.29 | 0.28 | 0.13 | |
| 1983 | 10.96 | 1.56 | 7.64 | 8.67 | 0.39 | 6.77 | 0.3 | 0.29 | 0.12 | |
| 1982 | 9.58 | 1.29 | 6.35 | 7.57 | 0.42 | 5.63 | 0.32 | 0.32 | 0.16 | |
| 1981 | 7.67 | 1.09 | 4.23 | 5.89 | 0.37 | 3.75 | 0.27 | 0.26 | 0.11 | |
| 1980 | 9.38 | 1.09 | 5.81 | 7.56 | 0.39 | 5.32 | 0.28 | 0.27 | 0.08 | |
| 1979 | 7.35 | 0.91 | 3.81 | 5.66 | 0.33 | 3.39 | 0.23 | 0.23 | 0.08 | |
| 1978 | 10.11 | 0.9 | 6.59 | 8.42 | 0.42 | 6.27 | 0.29 | 0.29 | 0.07 | |
| 1977 | 8.86 | 0.62 | 5.67 | 7.35 | 0.24 | 5.38 | 0.13 | 0.13 | 0.05 | |
| 1976 | 10.35 | 0.63 | 6.79 | 8.71 | 0.28 | 6.56 | 0.17 | 0.17 | 0.04 | |
| 1975 | 7.62 | 0.75 | 4.22 | 5.96 | 0.32 | 3.94 | 0.23 | 0.22 | 0.05 | |
| 1974 | 9.93 | 0.79 | 6.53 | 8.26 | 0.35 | 6.26 | 0.25 | 0.25 | 0.04 | |
| 1973 | 9.3 | 0.63 | 6 | 7.82 | 0.25 | 5.8 | 0.17 | 0.16 | 0.04 | |
| 1972 | 8.56 | 0.7 | 5.07 | 6.72 | 0.27 | 4.85 | 0.18 | 0.17 | 0.05 | |
| 1971 | 8.97 | 0.94 | 5.06 | 6.79 | 0.37 | 4.77 | 0.27 | 0.27 | 0.05 | |
| 1970 | 9.12 | 0.92 | 5.2 | 6.99 | 0.33 | 4.9 | 0.23 | 0.22 | 0.04 | |
| 1969 | 9.27 | 0.85 | 5.42 | 7.02 | 0.37 | 5.18 | 0.27 | 0.27 | 0.03 | |
| 1968 | 8.8 | 0.69 | 4.91 | 6.69 | 0.3 | 4.68 | 0.2 | 0.2 | 0.03 | |
| 1967 | 8.46 | 0.9 | 4.6 | 6.45 | 0.3 | 4.32 | 0.2 | 0.19 | 0.03 | |
| 1966 | 9.12 | 0.84 | 5.1 | 7.03 | 0.33 | 4.87 | 0.21 | 0.2 | 0.03 | |
| 1965 | 10.07 | 0.86 | 4.99 | 7.86 | 0.34 | 4.72 | 0.23 | 0.23 | 0.04 | |
| 1964 | 13.2 | 0.82 | 8.35 | 11.29 | 0.36 | 8.05 | 0.27 | 0.26 | 0.04 | |
| 1963 | 11.54 | 0.88 | 6.62 | 9.23 | 0.35 | 6.32 | 0.25 | 0.25 | 0.03 | |
| 1962 | 11.32 | 0.89 | 5.51 | 8.92 | 0.36 | 5.2 | 0.26 | 0.26 | 0.03 | |
| 1961 | 7.35 | 0.78 | 2.6 | 5.14 | 0.3 | 2.28 | 0.2 | 0.19 | 0.03 | |


Comments