
Abstract
Global wine import data for 2021 shows that the United States is the largest importer at 1.63Mt. The results indicate that American consumers have a strong demand for wine, especially high-quality international wines. Over the past few decades, wine culture has grown rapidly in the United States, with an increasing preference for wine, especially among millennials and urban consumers. This increased demand has led to increased imports from major wine producing countries such as Europe, South America and Australia. In addition, the domestic wine industry in the United States is developing, but imports account for a large share of the premium wine market, especially. Overall, wine import volumes respond sensitively to changes in economic conditions and consumer tastes, with import volumes tending to increase during periods of economic stability. Going forward, the U.S. wine import market is expected to remain a major component of the global wine industry.
Wine imports (worldwide)
Between 1961 and 2021, there have been notable changes in wine imports. In the early 1960s, wine imports were relatively small and trade was mainly within Europe. However, during the 1970s and 1980s, the American and Asian markets grew, and international distribution of wine expanded. Germany’s imports peaked in 2011 at 1.72 Mt but have since been on a gradual downward trend, with imports in 2021 standing at just 89.4% of the peak. Germany’s decline is likely due to increased domestic production, changing consumer tastes and increased competition. Meanwhile, the United States recorded the highest imports in 2021 at 1.63 Mt, demonstrating its importance in the global wine market. The increase in the United States reflects the spread of wine culture and growing interest in different varieties. As such, wine import trends depend heavily on each country’s economic situation and consumer preferences, and are expected to continue to fluctuate in the future.
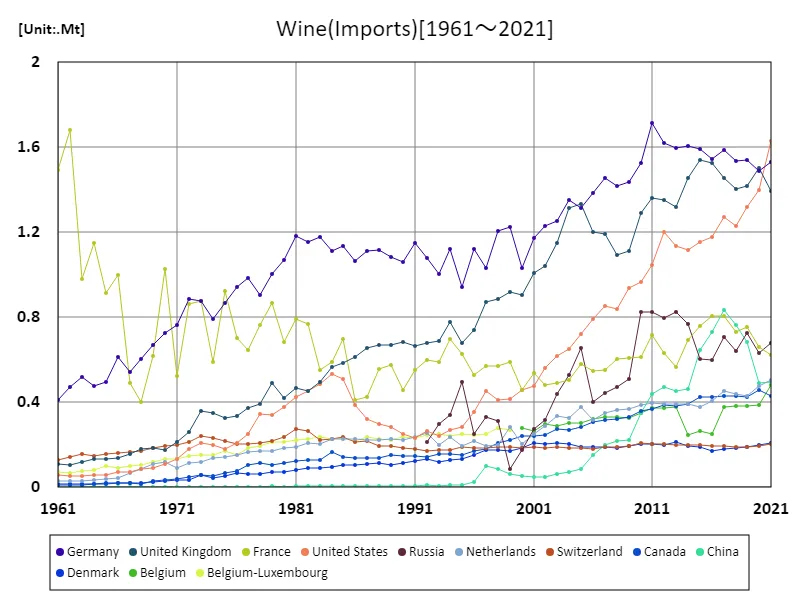
The maximum is 1.72Mt[2011] of Germany, and the current value is about 89.4%
Wine imports (latest year, world wide)
Notable trends emerge from the data on wine import volumes in 2021. The United States was the largest importer with 1.63Mt, demonstrating its status as a major player in the global wine market. This figure reflects the expansion of the American market and the spread of wine culture, and indicates that the United States is establishing itself as a center for wine imports. Meanwhile, wine imports in 2021 averaged 66.4kt, reaching a total of 12Mt. This total reflects the strength of the world wine trade and speaks to the breadth of demand in the global market. A trend over the past few decades has been the growth of emerging markets such as the USA and China, which has had an impact on imports from traditional wine producing countries. These data show that the international wine market is evolving and diversifying, and future developments will be interesting to watch.
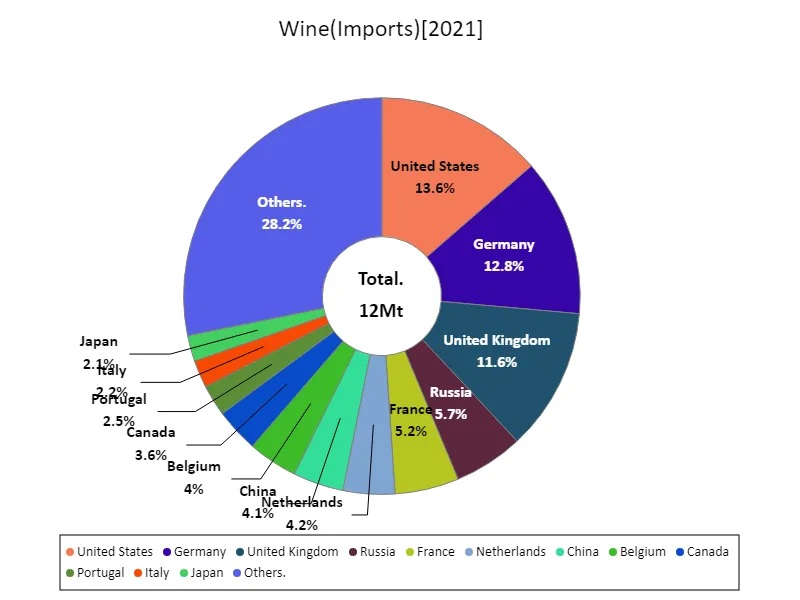
The maximum is 1.63Mt of United States, the average is 66.5kt, and the total is 12Mt
Wine imports (continental)
Data for 2021 shows that Europe recorded the largest volume of wine imports at 7.97Mt, the highest figure to date. This reflects the fact that Europe continues to be a major market for wine consumption and is home to a diverse wine culture. This is particularly true in the context of traditional wine-producing countries such as France, Italy and Spain, which are importing more wine than they consume domestically. A trend that has emerged so far has been that Europe is both a wine producing country and a large importing country, with a notable diversification of demand within the region. Additionally, recent changes in consumer tastes, the premiumization of wine, and the expansion of the global wine market have had an impact. The increase in European imports indicates not just increased consumption but also a broadening of the quality and variety of imports, underscoring Europe’s importance in the world wine market.
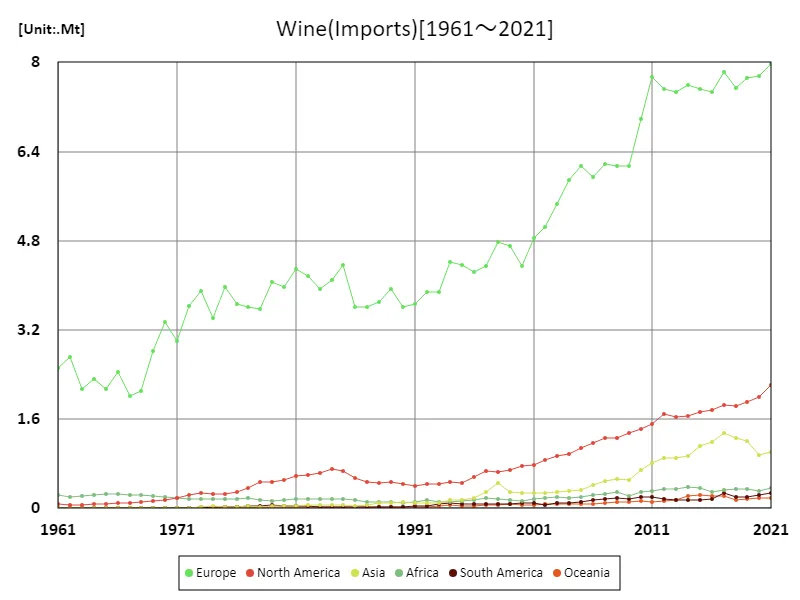
The maximum is the latest one, 7.97Mt of Europe
Wine imports (latest year, continental)
According to 2021 data, global wine imports reached a total of 12Mt, with Europe recording the largest imports at 7.97Mt. The figures show that Europe continues to play a central role in the global wine market. Although Europe has historically been a center of wine production, it is characterized by importing a wide variety of wines in excess of domestic market demand. The average import volume for the year was 2Mt, a figure also influenced by Europe. Within Europe, we see major producing countries such as France, Italy and Spain reflecting demand for wine from regions outside their own countries. The increase in imports is driven by diversifying consumer tastes, the premiumisation of wine and globalisation. And while European imports account for around 66% of the total, other regions are steadily making up a part of the market. This trend reflects changing economic ties between regions and consumption patterns as the wine market becomes increasingly internationalized, and will have an impact on future market trends.
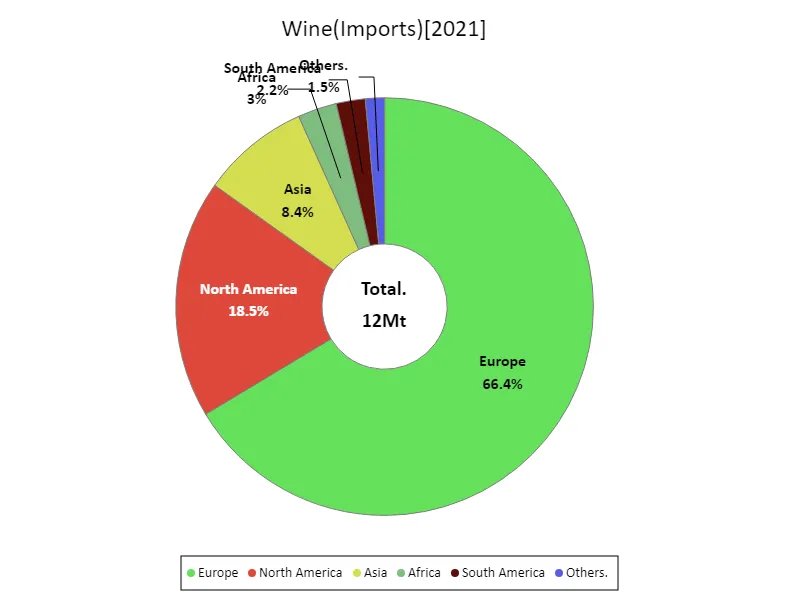
The maximum is 7.97Mt of Europe, the average is 2Mt, and the total is 12Mt
Main data
| Import and export(Wine, Imports) [Mt] | ||||||||||
|---|---|---|---|---|---|---|---|---|---|---|
| World | High-income countries | Europe | European Union | Western Europe | Americas | Northern Europe | North America | Northern America | Upper-middle-income countries | |
| 2021 | 12 | 9.82 | 7.97 | 5.39 | 3.48 | 2.49 | 2.36 | 2.22 | 2.06 | 1.74 |
| 2020 | 11.45 | 9.46 | 7.76 | 5.14 | 3.33 | 2.23 | 2.51 | 1.99 | 1.86 | 1.63 |
| 2019 | 11.54 | 9.23 | 7.72 | 5.14 | 3.42 | 2.11 | 2.34 | 1.91 | 1.74 | 1.95 |
| 2018 | 11.34 | 9.04 | 7.54 | 5.07 | 3.4 | 2.03 | 2.31 | 1.83 | 1.66 | 1.94 |
| 2017 | 11.87 | 9.41 | 7.83 | 5.24 | 3.56 | 2.14 | 2.37 | 1.86 | 1.7 | 2.1 |
| 2016 | 11.09 | 9.02 | 7.46 | 4.92 | 3.34 | 1.93 | 2.41 | 1.76 | 1.6 | 1.75 |
| 2015 | 11.12 | 9.11 | 7.53 | 4.98 | 3.31 | 1.87 | 2.39 | 1.72 | 1.58 | 1.64 |
| 2014 | 10.93 | 8.9 | 7.59 | 4.94 | 3.27 | 1.8 | 2.37 | 1.65 | 1.51 | 1.63 |
| 2013 | 10.64 | 8.59 | 7.48 | 4.9 | 3.24 | 1.78 | 2.18 | 1.64 | 1.52 | 1.65 |
| 2012 | 10.77 | 8.71 | 7.52 | 4.94 | 3.33 | 1.87 | 2.19 | 1.69 | 1.59 | 1.65 |
| 2011 | 10.66 | 8.63 | 7.73 | 5.1 | 3.52 | 1.71 | 2.17 | 1.51 | 1.41 | 1.62 |
| 2010 | 9.73 | 7.84 | 6.98 | 4.47 | 3.19 | 1.64 | 2.03 | 1.43 | 1.33 | 1.56 |
| 2009 | 8.51 | 7.19 | 6.14 | 4.14 | 3.02 | 1.53 | 1.77 | 1.36 | 1.27 | 1.05 |
| 2008 | 8.51 | 7.09 | 6.13 | 4.16 | 2.99 | 1.44 | 1.71 | 1.26 | 1.17 | 1.06 |
| 2007 | 8.44 | 7.1 | 6.17 | 4.11 | 2.98 | 1.43 | 1.81 | 1.26 | 1.17 | 1.01 |
| 2006 | 8.01 | 6.81 | 5.94 | 3.93 | 2.85 | 1.33 | 1.81 | 1.18 | 1.1 | 0.91 |
| 2005 | 7.94 | 6.69 | 6.14 | 3.77 | 2.85 | 1.19 | 1.89 | 1.08 | 1.01 | 1.01 |
| 2004 | 7.54 | 6.49 | 5.89 | 3.69 | 2.75 | 1.08 | 1.89 | 0.98 | 0.92 | 0.83 |
| 2003 | 7.05 | 6.13 | 5.46 | 3.53 | 2.63 | 1.03 | 1.75 | 0.95 | 0.89 | 0.71 |
| 2002 | 6.51 | 5.74 | 5.04 | 3.36 | 2.56 | 0.94 | 1.61 | 0.87 | 0.81 | 0.56 |
| 2001 | 6.22 | 5.54 | 4.85 | 3.26 | 2.5 | 0.87 | 1.55 | 0.78 | 0.72 | 0.5 |
| 2000 | 5.67 | 5.11 | 4.35 | 3 | 2.23 | 0.85 | 1.39 | 0.75 | 0.7 | 0.41 |
| 1999 | 5.97 | 5.25 | 4.7 | 3.42 | 2.61 | 0.77 | 1.39 | 0.68 | 0.64 | 0.31 |
| 1998 | 6.19 | 5.12 | 4.77 | 3.24 | 2.51 | 0.73 | 1.34 | 0.65 | 0.62 | 0.59 |
| 1997 | 5.64 | 4.6 | 4.35 | 2.84 | 2.3 | 0.75 | 1.3 | 0.67 | 0.64 | 0.59 |
| 1996 | 5.23 | 4.36 | 4.23 | 2.94 | 2.33 | 0.63 | 1.15 | 0.55 | 0.53 | 0.45 |
| 1995 | 5.23 | 4.12 | 4.36 | 2.89 | 2.23 | 0.53 | 1.03 | 0.46 | 0.44 | 0.7 |
| 1994 | 5.3 | 4.35 | 4.41 | 3.03 | 2.49 | 0.57 | 1.14 | 0.47 | 0.43 | 0.57 |
| 1993 | 4.62 | 3.77 | 3.87 | 2.62 | 2.24 | 0.5 | 1 | 0.43 | 0.4 | 0.48 |
| 1992 | 4.61 | 3.89 | 3.87 | 2.74 | 2.37 | 0.48 | 1 | 0.44 | 0.41 | 0.33 |
| 1991 | 4.35 | 3.78 | 3.67 | 2.64 | 2.38 | 0.44 | 0.96 | 0.4 | 0.38 | 0.24 |
| 1990 | 4.31 | 3.69 | 3.61 | 2.5 | 2.19 | 0.46 | 0.98 | 0.44 | 0.4 | 0.29 |
| 1989 | 4.67 | 4.02 | 3.94 | 2.78 | 2.33 | 0.49 | 0.96 | 0.46 | 0.44 | 0.32 |
| 1988 | 4.41 | 3.8 | 3.7 | 2.59 | 2.36 | 0.49 | 0.94 | 0.46 | 0.44 | 0.28 |
| 1987 | 4.32 | 3.69 | 3.61 | 2.49 | 2.25 | 0.5 | 0.92 | 0.48 | 0.46 | 0.28 |
| 1986 | 4.39 | 3.67 | 3.61 | 2.44 | 2.16 | 0.57 | 0.87 | 0.54 | 0.53 | 0.37 |
| 1985 | 5.31 | 4.13 | 4.36 | 2.79 | 2.56 | 0.69 | 0.83 | 0.67 | 0.65 | 0.79 |
| 1984 | 5.08 | 3.89 | 4.09 | 2.52 | 2.41 | 0.74 | 0.8 | 0.71 | 0.7 | 0.82 |
| 1983 | 4.82 | 3.72 | 3.93 | 2.53 | 2.42 | 0.65 | 0.73 | 0.63 | 0.62 | 0.72 |
| 1982 | 5.04 | 3.87 | 4.16 | 2.73 | 2.66 | 0.63 | 0.66 | 0.6 | 0.58 | 0.79 |
| 1981 | 5.15 | 3.86 | 4.29 | 2.72 | 2.69 | 0.62 | 0.67 | 0.58 | 0.55 | 0.91 |
| 1980 | 4.75 | 3.47 | 3.98 | 2.46 | 2.41 | 0.56 | 0.61 | 0.52 | 0.5 | 0.93 |
| 1979 | 4.77 | 3.63 | 4.07 | 2.62 | 2.5 | 0.52 | 0.68 | 0.47 | 0.45 | 0.81 |
| 1978 | 4.3 | 3.26 | 3.58 | 2.34 | 2.27 | 0.52 | 0.56 | 0.47 | 0.46 | 0.71 |
| 1977 | 4.25 | 3.15 | 3.62 | 2.36 | 2.22 | 0.41 | 0.56 | 0.37 | 0.35 | 0.76 |
| 1976 | 4.19 | 2.99 | 3.66 | 2.29 | 2.2 | 0.33 | 0.5 | 0.3 | 0.29 | 0.9 |
| 1975 | 4.44 | 3.1 | 3.96 | 2.46 | 2.41 | 0.28 | 0.49 | 0.25 | 0.25 | 1.02 |
| 1974 | 3.92 | 2.74 | 3.41 | 2 | 1.96 | 0.28 | 0.49 | 0.26 | 0.25 | 0.87 |
| 1973 | 4.39 | 3.3 | 3.89 | 2.55 | 2.33 | 0.29 | 0.5 | 0.28 | 0.27 | 0.78 |
| 1972 | 4.07 | 2.89 | 3.62 | 2.32 | 2.27 | 0.25 | 0.39 | 0.24 | 0.23 | 0.86 |
| 1971 | 3.39 | 2.24 | 2.99 | 1.76 | 1.74 | 0.19 | 0.33 | 0.18 | 0.17 | 0.85 |
| 1970 | 3.73 | 2.59 | 3.34 | 2.19 | 2.22 | 0.16 | 0.28 | 0.15 | 0.14 | 0.81 |
| 1969 | 3.2 | 2.08 | 2.82 | 1.7 | 1.72 | 0.14 | 0.28 | 0.13 | 0.12 | 0.78 |
| 1968 | 2.49 | 1.76 | 2.1 | 1.41 | 1.41 | 0.12 | 0.27 | 0.11 | 0.1 | 0.38 |
| 1967 | 2.38 | 1.76 | 2.02 | 1.42 | 1.41 | 0.11 | 0.23 | 0.1 | 0.09 | 0.29 |
| 1966 | 2.83 | 2.25 | 2.45 | 1.93 | 1.96 | 0.1 | 0.21 | 0.09 | 0.09 | 0.23 |
| 1965 | 2.49 | 1.95 | 2.14 | 1.67 | 1.74 | 0.08 | 0.2 | 0.08 | 0.07 | 0.2 |
| 1964 | 2.66 | 2.16 | 2.32 | 1.87 | 1.92 | 0.08 | 0.2 | 0.08 | 0.07 | 0.18 |
| 1963 | 2.45 | 2.02 | 2.15 | 1.75 | 1.81 | 0.07 | 0.18 | 0.07 | 0.06 | 0.13 |
| 1962 | 3.01 | 2.62 | 2.71 | 2.37 | 2.43 | 0.07 | 0.16 | 0.07 | 0.06 | 0.11 |
| 1961 | 2.85 | 2.41 | 2.52 | 2.16 | 2.19 | 0.08 | 0.17 | 0.07 | 0.07 | 0.13 |


Comments