
Abstract
According to 2021 data, Spain recorded the largest volume of wine exports, reaching 2.39 million tonnes (Mt). This demonstrates the important role Spain plays in the global wine market. Historically, Spain has been one of the top wine-producing countries for many years, and is particularly strong in exports. Spain’s vast vineyards and diverse wine-producing regions allow it to offer a wide range of wines to meet international demand. On the other hand, France and Italy are also important wine exporting countries, but recently Spain has been showing a tendency to increase its share. This is thought to be due to Spain’s price competitiveness and improved production technology. In recent years, the Spanish wine industry has also contributed to improving international quality standards and strengthening marketing strategies, which have led to an increase in export volumes. Spain will continue to maintain its important position in wine production and export and will continue to grow while competing with other major wine producing countries.
Wine exports (worldwide)
Looking at data from 1961 to 2021, Italy’s peak wine exports were recorded in 2011, at 2.56 million tonnes (Mt). Italian exports have since declined and are now at just 91% of their peak. This change is the result of being influenced by trends in the global wine market and the production and consumption situations in each country. Italy has been a major exporter of wine since the mid-20th century, exerting a strong influence on world markets due to its quality and diversity. However, in recent years, the increase in exports from France and Spain, especially Spain’s expanding export share, has had an impact. Changes in consumption within Italy and increased production costs are also likely to have contributed to the decline in export volumes. In addition, the Italian wine industry is focusing on improving quality and is shifting towards higher-priced premium wines. As a result, although overall export volume has decreased, unit prices have increased and profitability has been maintained. These factors are likely behind the decline in Italian exports. In the future, Italy is expected to continue to maintain its presence in the wine market by focusing on quality, staying competitive, and competing with other countries.
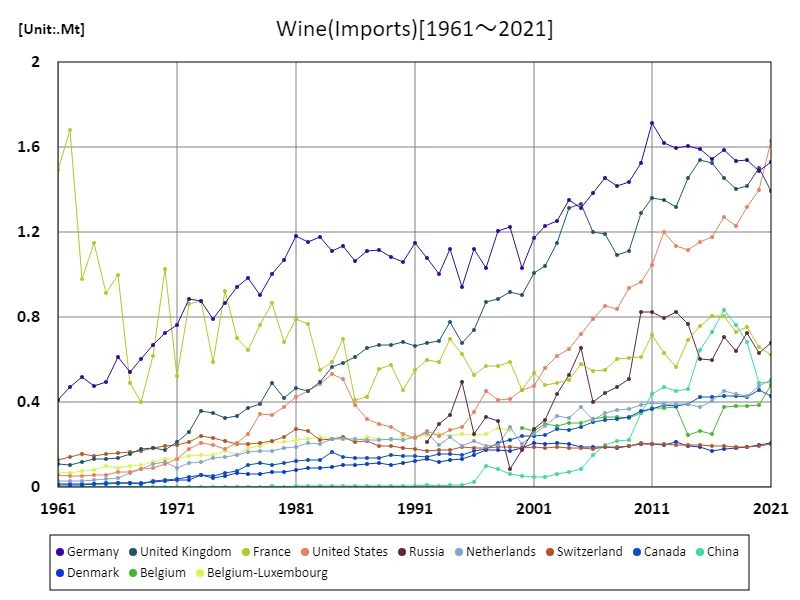
The maximum is 1.72Mt[2011] of Germany, and the current value is about 89.4%
Wine exports by country (latest year)
According to 2021 data, Spain recorded the largest wine exports at 2.39 million tonnes (Mt). This shows that Spain is a major player in the global wine market. Overall exports totaled 11.6 million tonnes, with an average export volume of 72.8 thousand tonnes (kt). This data reflects the size and diversity of the international wine market. Over the past few decades, the wine export market has seen significant fluctuations. In particular, Spain has taken advantage of its vast vineyards and diverse wine styles to increase its competitiveness in the export market. However, other major wine producing countries such as France and Italy continue to play an important role, but Spain’s growth is notable. In recent years, Spanish wine producers have been working to improve quality and strengthen their marketing strategies, thereby expanding their market share while remaining price competitive. In response, wine-consuming countries are demanding more diverse options, and wine-producing countries are developing strategies to meet these demands. The increase in exports is the result of Spain’s improved ability to adapt to changes in the market and meet international demand. Overall, the wine market is becoming increasingly internationally competitive and diverse, and it is expected that producers from each country will continue to maintain and strengthen their market position through quality and marketing.
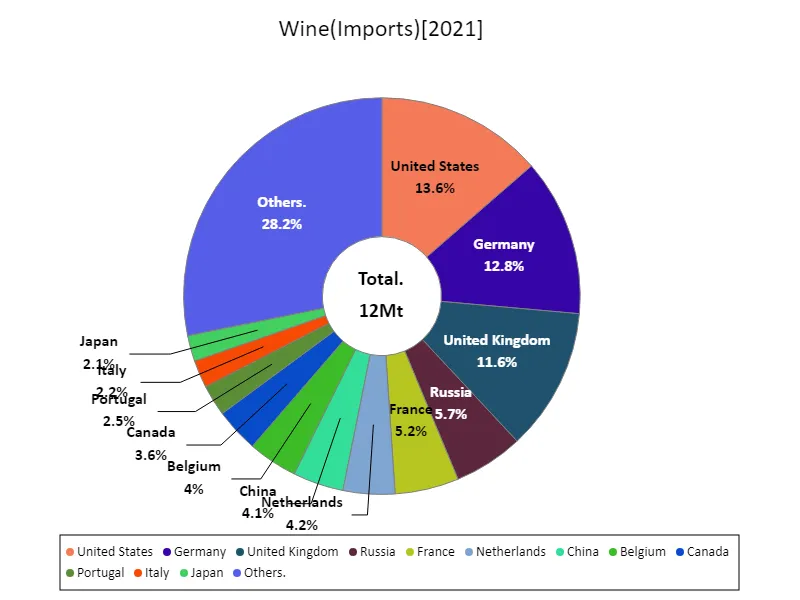
The maximum is 1.63Mt of United States, the average is 66.5kt, and the total is 12Mt
Wine exports (continental)
According to 2021 data, Europe recorded the largest amount of wine exports at 8.26 million tonnes (Mt). This shows that Europe holds a dominant share of the global wine market. Over the past few decades, Europe has established itself as the centre of wine production, with major wine-producing countries such as France, Italy and Spain at its centre. The reason why it is the largest export volume in Europe is due to its long history of wine production, diverse grape varieties, and sophisticated winemaking techniques. France and Italy, in particular, are known for their traditional wine styles and high-quality products, which have helped them meet global demand. Spain is also influencing the market with its vast vineyards and competitive pricing. In recent years, the European wine market has been focusing on improving quality and strengthening brand strategies. With the advancement of digital marketing, eco-labelling and other initiatives, they are adapting to changing consumer preferences. This continues to allow European wines to penetrate wider international markets and increase export volumes. Going forward, European wine-producing countries are expected to continue to maintain their competitiveness and increase their presence in the global market through strategies that improve quality and respond to market needs.
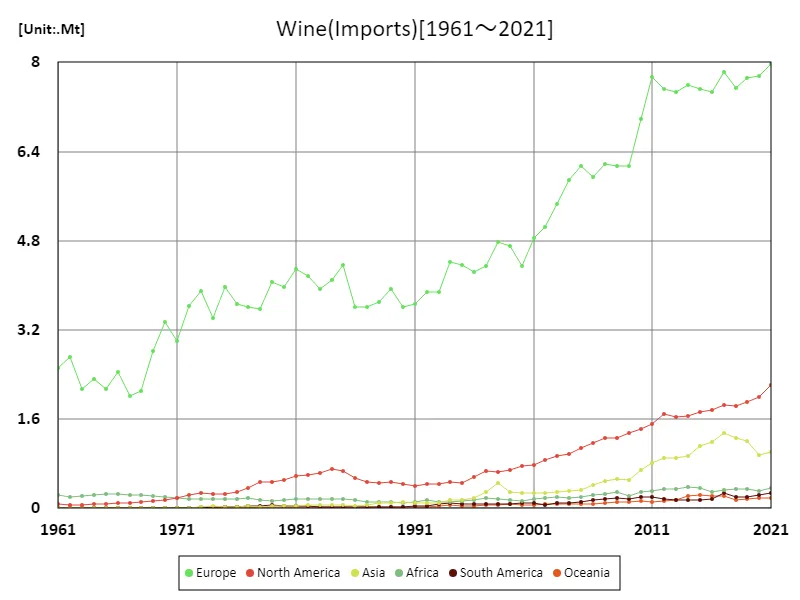
The maximum is the latest one, 7.97Mt of Europe
Wine exports (latest year, continental)
According to 2021 data, wine exports reached 11.6 million tonnes (Mt) overall, with Europe accounting for the largest share at 8.26Mt. This highlights the central role Europe plays in the wine market. The average export volume was 1.93 million tonnes, which indicates a prominent share of Europe compared to other wine producing countries around the world. Europe’s large export volumes are due to its historically deep wine-growing traditions, diverse wine styles and ability to produce high-quality products. Major wine-producing countries such as France, Italy and Spain have been producing quality wines and supplying them to the global market. This has enabled Europe to remain a leader in wine production and export for many years. As per past trends, Europe has strengthened its quality-oriented strategy to cater to the global market. Recently, the introduction of sustainable production methods and digital marketing has also progressed to meet the diverse needs of consumers. Meanwhile, wine production is increasing in other regions and competition is intensifying, but Europe’s strong brands and technical capabilities are helping it maintain its advantage in the market. Europe is expected to continue to maintain its influence in the global wine market, based on quality and innovation.
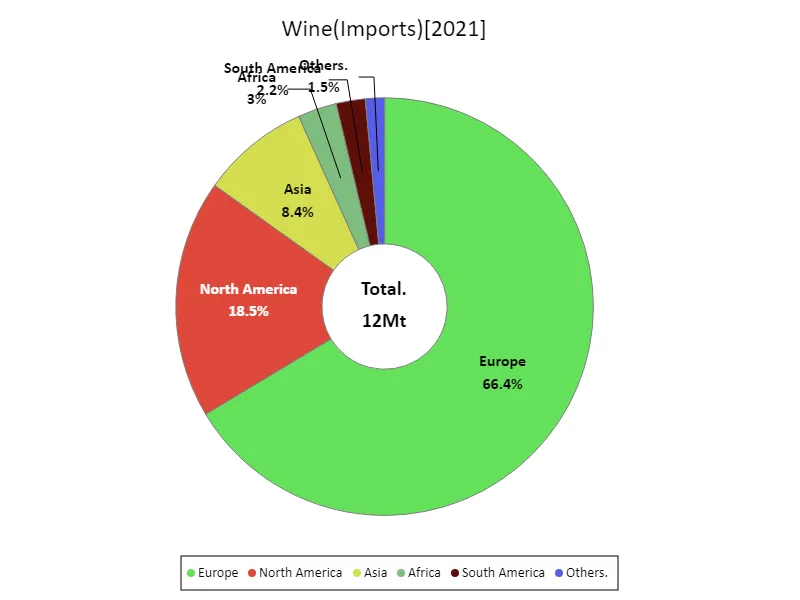
The maximum is 7.97Mt of Europe, the average is 2Mt, and the total is 12Mt
Main data
| Import and export(Wine, Imports) [Mt] | ||||||||||
|---|---|---|---|---|---|---|---|---|---|---|
| World | High-income countries | Europe | European Union | Western Europe | Americas | Northern Europe | North America | Northern America | Upper-middle-income countries | |
| 2021 | 12 | 9.82 | 7.97 | 5.39 | 3.48 | 2.49 | 2.36 | 2.22 | 2.06 | 1.74 |
| 2020 | 11.45 | 9.46 | 7.76 | 5.14 | 3.33 | 2.23 | 2.51 | 1.99 | 1.86 | 1.63 |
| 2019 | 11.54 | 9.23 | 7.72 | 5.14 | 3.42 | 2.11 | 2.34 | 1.91 | 1.74 | 1.95 |
| 2018 | 11.34 | 9.04 | 7.54 | 5.07 | 3.4 | 2.03 | 2.31 | 1.83 | 1.66 | 1.94 |
| 2017 | 11.87 | 9.41 | 7.83 | 5.24 | 3.56 | 2.14 | 2.37 | 1.86 | 1.7 | 2.1 |
| 2016 | 11.09 | 9.02 | 7.46 | 4.92 | 3.34 | 1.93 | 2.41 | 1.76 | 1.6 | 1.75 |
| 2015 | 11.12 | 9.11 | 7.53 | 4.98 | 3.31 | 1.87 | 2.39 | 1.72 | 1.58 | 1.64 |
| 2014 | 10.93 | 8.9 | 7.59 | 4.94 | 3.27 | 1.8 | 2.37 | 1.65 | 1.51 | 1.63 |
| 2013 | 10.64 | 8.59 | 7.48 | 4.9 | 3.24 | 1.78 | 2.18 | 1.64 | 1.52 | 1.65 |
| 2012 | 10.77 | 8.71 | 7.52 | 4.94 | 3.33 | 1.87 | 2.19 | 1.69 | 1.59 | 1.65 |
| 2011 | 10.66 | 8.63 | 7.73 | 5.1 | 3.52 | 1.71 | 2.17 | 1.51 | 1.41 | 1.62 |
| 2010 | 9.73 | 7.84 | 6.98 | 4.47 | 3.19 | 1.64 | 2.03 | 1.43 | 1.33 | 1.56 |
| 2009 | 8.51 | 7.19 | 6.14 | 4.14 | 3.02 | 1.53 | 1.77 | 1.36 | 1.27 | 1.05 |
| 2008 | 8.51 | 7.09 | 6.13 | 4.16 | 2.99 | 1.44 | 1.71 | 1.26 | 1.17 | 1.06 |
| 2007 | 8.44 | 7.1 | 6.17 | 4.11 | 2.98 | 1.43 | 1.81 | 1.26 | 1.17 | 1.01 |
| 2006 | 8.01 | 6.81 | 5.94 | 3.93 | 2.85 | 1.33 | 1.81 | 1.18 | 1.1 | 0.91 |
| 2005 | 7.94 | 6.69 | 6.14 | 3.77 | 2.85 | 1.19 | 1.89 | 1.08 | 1.01 | 1.01 |
| 2004 | 7.54 | 6.49 | 5.89 | 3.69 | 2.75 | 1.08 | 1.89 | 0.98 | 0.92 | 0.83 |
| 2003 | 7.05 | 6.13 | 5.46 | 3.53 | 2.63 | 1.03 | 1.75 | 0.95 | 0.89 | 0.71 |
| 2002 | 6.51 | 5.74 | 5.04 | 3.36 | 2.56 | 0.94 | 1.61 | 0.87 | 0.81 | 0.56 |
| 2001 | 6.22 | 5.54 | 4.85 | 3.26 | 2.5 | 0.87 | 1.55 | 0.78 | 0.72 | 0.5 |
| 2000 | 5.67 | 5.11 | 4.35 | 3 | 2.23 | 0.85 | 1.39 | 0.75 | 0.7 | 0.41 |
| 1999 | 5.97 | 5.25 | 4.7 | 3.42 | 2.61 | 0.77 | 1.39 | 0.68 | 0.64 | 0.31 |
| 1998 | 6.19 | 5.12 | 4.77 | 3.24 | 2.51 | 0.73 | 1.34 | 0.65 | 0.62 | 0.59 |
| 1997 | 5.64 | 4.6 | 4.35 | 2.84 | 2.3 | 0.75 | 1.3 | 0.67 | 0.64 | 0.59 |
| 1996 | 5.23 | 4.36 | 4.23 | 2.94 | 2.33 | 0.63 | 1.15 | 0.55 | 0.53 | 0.45 |
| 1995 | 5.23 | 4.12 | 4.36 | 2.89 | 2.23 | 0.53 | 1.03 | 0.46 | 0.44 | 0.7 |
| 1994 | 5.3 | 4.35 | 4.41 | 3.03 | 2.49 | 0.57 | 1.14 | 0.47 | 0.43 | 0.57 |
| 1993 | 4.62 | 3.77 | 3.87 | 2.62 | 2.24 | 0.5 | 1 | 0.43 | 0.4 | 0.48 |
| 1992 | 4.61 | 3.89 | 3.87 | 2.74 | 2.37 | 0.48 | 1 | 0.44 | 0.41 | 0.33 |
| 1991 | 4.35 | 3.78 | 3.67 | 2.64 | 2.38 | 0.44 | 0.96 | 0.4 | 0.38 | 0.24 |
| 1990 | 4.31 | 3.69 | 3.61 | 2.5 | 2.19 | 0.46 | 0.98 | 0.44 | 0.4 | 0.29 |
| 1989 | 4.67 | 4.02 | 3.94 | 2.78 | 2.33 | 0.49 | 0.96 | 0.46 | 0.44 | 0.32 |
| 1988 | 4.41 | 3.8 | 3.7 | 2.59 | 2.36 | 0.49 | 0.94 | 0.46 | 0.44 | 0.28 |
| 1987 | 4.32 | 3.69 | 3.61 | 2.49 | 2.25 | 0.5 | 0.92 | 0.48 | 0.46 | 0.28 |
| 1986 | 4.39 | 3.67 | 3.61 | 2.44 | 2.16 | 0.57 | 0.87 | 0.54 | 0.53 | 0.37 |
| 1985 | 5.31 | 4.13 | 4.36 | 2.79 | 2.56 | 0.69 | 0.83 | 0.67 | 0.65 | 0.79 |
| 1984 | 5.08 | 3.89 | 4.09 | 2.52 | 2.41 | 0.74 | 0.8 | 0.71 | 0.7 | 0.82 |
| 1983 | 4.82 | 3.72 | 3.93 | 2.53 | 2.42 | 0.65 | 0.73 | 0.63 | 0.62 | 0.72 |
| 1982 | 5.04 | 3.87 | 4.16 | 2.73 | 2.66 | 0.63 | 0.66 | 0.6 | 0.58 | 0.79 |
| 1981 | 5.15 | 3.86 | 4.29 | 2.72 | 2.69 | 0.62 | 0.67 | 0.58 | 0.55 | 0.91 |
| 1980 | 4.75 | 3.47 | 3.98 | 2.46 | 2.41 | 0.56 | 0.61 | 0.52 | 0.5 | 0.93 |
| 1979 | 4.77 | 3.63 | 4.07 | 2.62 | 2.5 | 0.52 | 0.68 | 0.47 | 0.45 | 0.81 |
| 1978 | 4.3 | 3.26 | 3.58 | 2.34 | 2.27 | 0.52 | 0.56 | 0.47 | 0.46 | 0.71 |
| 1977 | 4.25 | 3.15 | 3.62 | 2.36 | 2.22 | 0.41 | 0.56 | 0.37 | 0.35 | 0.76 |
| 1976 | 4.19 | 2.99 | 3.66 | 2.29 | 2.2 | 0.33 | 0.5 | 0.3 | 0.29 | 0.9 |
| 1975 | 4.44 | 3.1 | 3.96 | 2.46 | 2.41 | 0.28 | 0.49 | 0.25 | 0.25 | 1.02 |
| 1974 | 3.92 | 2.74 | 3.41 | 2 | 1.96 | 0.28 | 0.49 | 0.26 | 0.25 | 0.87 |
| 1973 | 4.39 | 3.3 | 3.89 | 2.55 | 2.33 | 0.29 | 0.5 | 0.28 | 0.27 | 0.78 |
| 1972 | 4.07 | 2.89 | 3.62 | 2.32 | 2.27 | 0.25 | 0.39 | 0.24 | 0.23 | 0.86 |
| 1971 | 3.39 | 2.24 | 2.99 | 1.76 | 1.74 | 0.19 | 0.33 | 0.18 | 0.17 | 0.85 |
| 1970 | 3.73 | 2.59 | 3.34 | 2.19 | 2.22 | 0.16 | 0.28 | 0.15 | 0.14 | 0.81 |
| 1969 | 3.2 | 2.08 | 2.82 | 1.7 | 1.72 | 0.14 | 0.28 | 0.13 | 0.12 | 0.78 |
| 1968 | 2.49 | 1.76 | 2.1 | 1.41 | 1.41 | 0.12 | 0.27 | 0.11 | 0.1 | 0.38 |
| 1967 | 2.38 | 1.76 | 2.02 | 1.42 | 1.41 | 0.11 | 0.23 | 0.1 | 0.09 | 0.29 |
| 1966 | 2.83 | 2.25 | 2.45 | 1.93 | 1.96 | 0.1 | 0.21 | 0.09 | 0.09 | 0.23 |
| 1965 | 2.49 | 1.95 | 2.14 | 1.67 | 1.74 | 0.08 | 0.2 | 0.08 | 0.07 | 0.2 |
| 1964 | 2.66 | 2.16 | 2.32 | 1.87 | 1.92 | 0.08 | 0.2 | 0.08 | 0.07 | 0.18 |
| 1963 | 2.45 | 2.02 | 2.15 | 1.75 | 1.81 | 0.07 | 0.18 | 0.07 | 0.06 | 0.13 |
| 1962 | 3.01 | 2.62 | 2.71 | 2.37 | 2.43 | 0.07 | 0.16 | 0.07 | 0.06 | 0.11 |
| 1961 | 2.85 | 2.41 | 2.52 | 2.16 | 2.19 | 0.08 | 0.17 | 0.07 | 0.07 | 0.13 |


Comments