
Abstract
Global trends in egg production vary widely from country to country. According to 2021 data, China dominates production with 31.9Mt, responsible for around 40% of global egg production. This is due to China’s large-scale poultry farming industry and vast market. Other major producing countries include the United States, India and Brazil, each of which produces large amounts of eggs, but their production is small compared to China’s. In recent years, food safety and quality control have become increasingly important, and countries are focusing on hygiene management during the production process and the quality of feed. In developed countries, there is a trend toward free-range farming and the use of organic feed due to concerns about animal welfare and the environment. Overall, egg production continues to grow in response to demand, especially in Asia.
Egg food (around the world)
Looking at egg production trends from 1961 to 2021, China stands out as consistently the world’s largest producer. Notably, in 2020, annual production reached 32.5Mt, a new record high. China has maintained high production levels since then, falling only 1.7% from its peak. This sustained high production is driven by China’s large poultry industry, rapid economic growth and increasing domestic demand. From the 1960s to the early 2000s, global egg production increased steadily, with particularly strong growth in Asia. India and Indonesia also increased their production during this period and strengthened their presence in the international market. Meanwhile, in developed countries, production growth has slowed and environmental and animal welfare practices have been introduced. In Europe and the United States in particular, efforts are underway to improve feed quality and production processes. Recent trends, influenced by growing concerns about environmental issues and food safety, have led to an increased adoption of sustainable production methods. In particular, organic and locally produced eggs are gaining attention, and consumers’ choices are becoming more diverse. Overall, egg production is stable internationally, with trends in major producing countries having a major impact on the market.
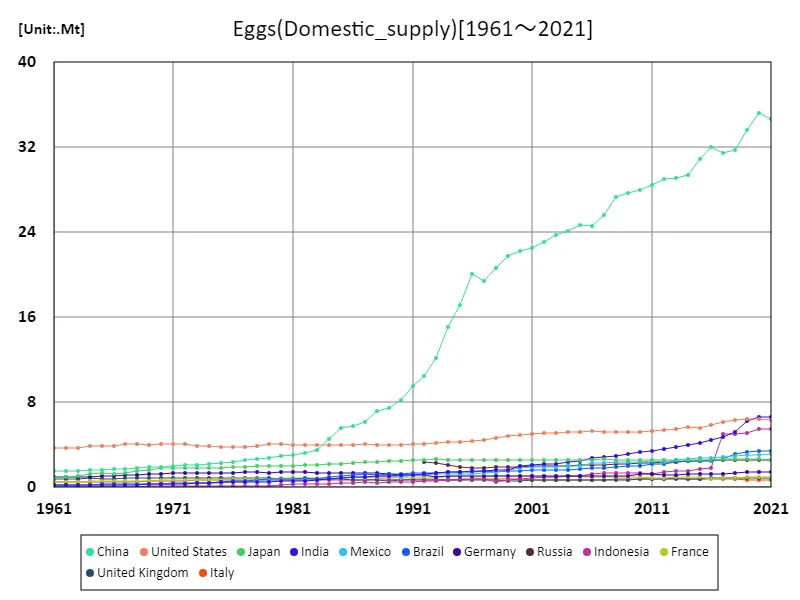
The maximum is 35.2Mt[2020] of China, and the current value is about 98.3%
Egg food (latest year, countries around the world)
Egg production data for 2021 highlights notable features and trends in global egg production. China produces 31.9Mt of eggs, accounting for about 39% of global production. This overwhelming production is due to China’s large-scale poultry farming industry, supported by its vast farmland and rapid urbanization. The total global egg production is 81.8Mt with the average production reaching 445kt. Since the 1960s, egg production has increased steadily, especially in Asia. India and Indonesia are also increasing their production and boosting their regional share. In developed countries, due to increased consumer health awareness and concern for animal welfare, there have been improvements in the quality of feed and production methods, and organic and free-range eggs are popular. The current trend is towards more sustainable production methods, where environmental considerations are integrated into the production process. In addition, research is underway into efficient production techniques and new feed to respond to climate change and resource depletion. Overall, global egg production is growing steadily, with the influence of major producing countries having a significant impact on market trends.
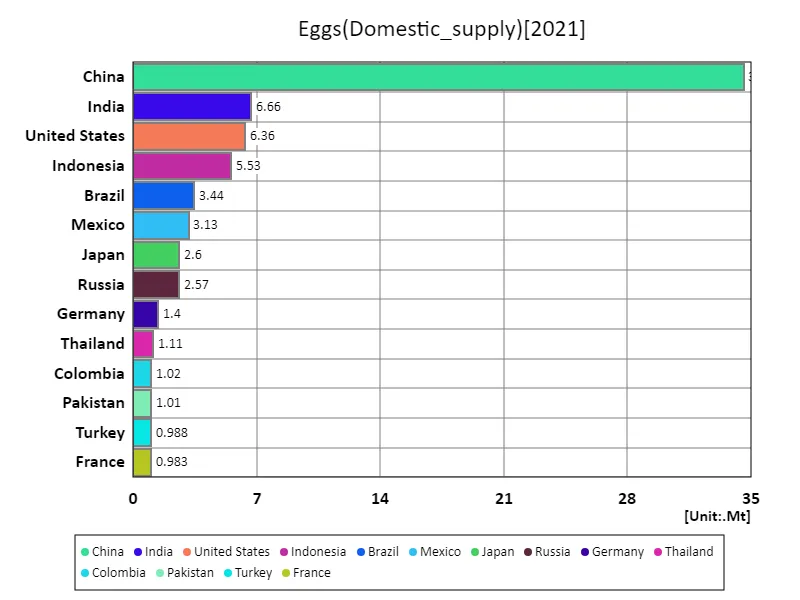
The maximum is 34.6Mt of China, the average is 507kt, and the total is 92.7Mt
Egg food (continent)
According to 2021 egg production data, Asia is by far the centre of global egg production, with the largest production at 54Mt. This means that the entire Asian region accounts for approximately 66% of the world’s egg production. China, India and Indonesia are particularly major producers due to their large poultry farming industries and high domestic demand. Since the 1960s, global egg production has been steadily increasing, with Asia seeing the greatest growth. China has always been the top producer and production has recently peaked. India and Indonesia are also increasing production, driven by improvements in agricultural techniques and rising consumer demand in these countries. Meanwhile, production growth in developed countries is slowing and regulations regarding environmental concerns and animal welfare are becoming stricter. In Europe and the United States in particular, the production of organic and free-range eggs is increasing, with emphasis on quality and ethical aspects. Recent trends include the adoption of sustainable production methods, responding to climate change and requiring efficient resource management. Overall, egg production has continued to grow steadily, with regional variations and a clear indication of Asia’s significant influence.
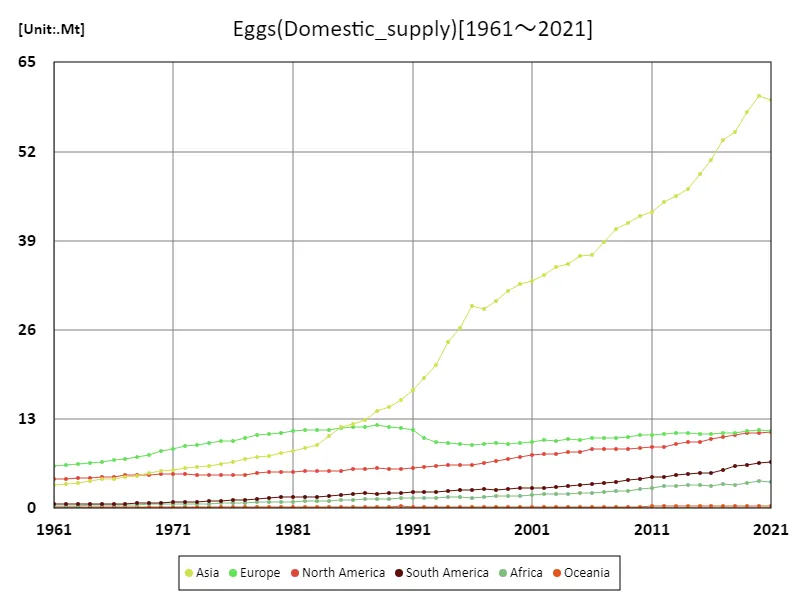
The maximum is 60.1Mt[2020] of Asia, and the current value is about 99.1%
Egg food (latest year, continent)
According to 2021 data, global egg production reached a total of 81.8Mt, with the Asian region boasting the largest production, accounting for 53.3Mt. This indicates that Asia as a whole accounts for around 65% of the world’s egg production. China is the largest producer, followed by India and Indonesia. The region’s high production is driven by rapid economic growth, population growth and extensive poultry farming. Egg production has been steadily increasing over the past few decades, with growth particularly notable in Asia. From the 1960s through to the 2000s, production in Asia increased significantly, contributing to an increase in global production. In contrast, developed countries are seeing slower production growth and growing concerns about environmental protection and animal welfare are leading to a rethinking of production methods. Recent trends include the promotion of sustainable production methods and efficient resource management, and the need to address climate change and food safety. Technological innovations and improved feeds are underway to meet growing demand, especially in Asia. Overall, egg production continues to grow steadily, with regional variations and the role of Asia clearly being crucial.
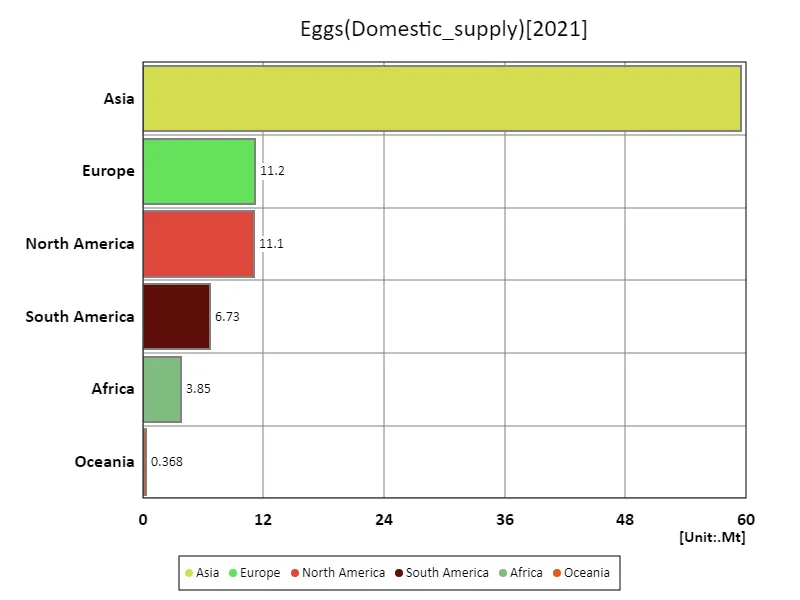
The maximum is 59.6Mt of Asia, the average is 15.5Mt, and the total is 92.8Mt
Main data
| Supply(Eggs, Domestic_supply) [Mt] | ||||||||||
|---|---|---|---|---|---|---|---|---|---|---|
| World | Asia | Upper-middle-income countries | Eastern Asia | China | High-income countries | Americas | Lower-middle-income countries | Europe | North America | |
| 2021 | 92.76 | 59.56 | 56.79 | 38.23 | 34.65 | 20.18 | 17.78 | 14.89 | 11.21 | 11.05 |
| 2020 | 93.49 | 60.08 | 57.3 | 38.82 | 35.23 | 20.33 | 17.66 | 14.92 | 11.46 | 11.02 |
| 2019 | 90.38 | 57.76 | 54.8 | 37.23 | 33.63 | 20.2 | 17.29 | 14.51 | 11.31 | 10.92 |
| 2018 | 86.42 | 54.84 | 52.78 | 35.4 | 31.77 | 19.66 | 16.89 | 13.18 | 10.99 | 10.72 |
| 2017 | 84.46 | 53.74 | 51.68 | 35 | 31.43 | 19.24 | 15.95 | 12.72 | 10.93 | 10.4 |
| 2016 | 80.44 | 50.75 | 48.6 | 35.57 | 32.07 | 18.79 | 15.22 | 12.25 | 10.83 | 10.06 |
| 2015 | 78.16 | 48.72 | 47.17 | 34.36 | 30.9 | 18.26 | 14.83 | 11.93 | 10.85 | 9.66 |
| 2014 | 75.75 | 46.51 | 45.17 | 32.73 | 29.38 | 18.14 | 14.66 | 11.63 | 10.93 | 9.66 |
| 2013 | 74.24 | 45.53 | 44.37 | 32.44 | 29.09 | 17.93 | 14.18 | 11.17 | 10.95 | 9.38 |
| 2012 | 72.48 | 44.67 | 43.55 | 32.33 | 29 | 17.4 | 13.52 | 10.77 | 10.76 | 8.91 |
| 2011 | 70.61 | 43.21 | 42.63 | 31.79 | 28.49 | 17.38 | 13.46 | 9.94 | 10.74 | 8.91 |
| 2010 | 69.35 | 42.53 | 41.82 | 31.31 | 28 | 17.34 | 13.07 | 9.59 | 10.72 | 8.81 |
| 2009 | 67.57 | 41.65 | 41.16 | 31.01 | 27.73 | 17.05 | 12.82 | 8.85 | 10.38 | 8.7 |
| 2008 | 66.27 | 40.73 | 40.19 | 30.62 | 27.31 | 17.04 | 12.44 | 8.57 | 10.31 | 8.63 |
| 2007 | 63.95 | 38.74 | 38.25 | 28.93 | 25.62 | 17.09 | 12.24 | 8.17 | 10.3 | 8.6 |
| 2006 | 61.97 | 36.99 | 36.85 | 27.82 | 24.6 | 16.86 | 12.27 | 7.83 | 10.18 | 8.67 |
| 2005 | 60.71 | 36.72 | 36.11 | 27.96 | 24.73 | 16.66 | 11.64 | 7.5 | 9.97 | 8.27 |
| 2004 | 59.49 | 35.65 | 35 | 27.29 | 24.08 | 16.9 | 11.35 | 7.16 | 10.15 | 8.17 |
| 2003 | 58.28 | 35.1 | 34.5 | 26.98 | 23.7 | 16.56 | 11.05 | 6.79 | 9.84 | 7.97 |
| 2002 | 57.25 | 34.05 | 33.54 | 26.31 | 23.04 | 16.7 | 10.93 | 6.59 | 9.99 | 7.96 |
| 2001 | 55.84 | 33.14 | 32.7 | 25.76 | 22.52 | 16.52 | 10.84 | 6.23 | 9.73 | 7.81 |
| 2000 | 54.7 | 32.73 | 32.21 | 25.42 | 22.23 | 16.18 | 10.46 | 5.93 | 9.48 | 7.51 |
| 1999 | 53.21 | 31.69 | 31.3 | 24.94 | 21.78 | 15.81 | 10.1 | 5.56 | 9.37 | 7.25 |
| 1998 | 51.32 | 30.18 | 29.74 | 23.74 | 20.62 | 15.76 | 9.57 | 5.29 | 9.58 | 6.89 |
| 1997 | 49.56 | 29.06 | 28.48 | 22.56 | 19.38 | 15.5 | 9.38 | 5.08 | 9.35 | 6.61 |
| 1996 | 49.49 | 29.47 | 28.78 | 23.22 | 20.04 | 15.23 | 8.99 | 4.98 | 9.27 | 6.38 |
| 1995 | 46.33 | 26.24 | 25.82 | 20.28 | 17.15 | 15.05 | 8.89 | 4.97 | 9.38 | 6.29 |
| 1994 | 44.27 | 24.19 | 23.9 | 18.28 | 15.13 | 14.94 | 8.75 | 4.93 | 9.55 | 6.25 |
| 1993 | 40.77 | 20.87 | 20.77 | 15.32 | 12.13 | 14.72 | 8.52 | 4.79 | 9.64 | 6.12 |
| 1992 | 39.37 | 19.04 | 19.47 | 13.67 | 10.51 | 14.69 | 8.35 | 4.67 | 10.23 | 6.01 |
| 1991 | 38.76 | 17.27 | 20.22 | 12.63 | 9.51 | 14.45 | 8.3 | 3.53 | 11.44 | 5.93 |
| 1990 | 37.12 | 15.72 | 18.8 | 11.22 | 8.22 | 14.37 | 7.97 | 3.4 | 11.68 | 5.73 |
| 1989 | 36.07 | 14.77 | 17.96 | 10.43 | 7.46 | 14.3 | 7.92 | 3.28 | 11.82 | 5.72 |
| 1988 | 35.8 | 14.14 | 17.56 | 10.14 | 7.18 | 14.55 | 7.96 | 3.17 | 12.11 | 5.81 |
| 1987 | 34.28 | 12.87 | 16.27 | 9.02 | 6.12 | 14.46 | 7.94 | 3.02 | 11.92 | 5.76 |
| 1986 | 33.39 | 12.25 | 15.65 | 8.5 | 5.77 | 14.35 | 7.78 | 2.87 | 11.89 | 5.7 |
| 1985 | 32.34 | 11.79 | 14.84 | 8.18 | 5.56 | 14.23 | 7.44 | 2.77 | 11.7 | 5.5 |
| 1984 | 30.58 | 10.54 | 13.41 | 7.1 | 4.53 | 14.05 | 7.22 | 2.63 | 11.48 | 5.39 |
| 1983 | 29.15 | 9.29 | 12.09 | 6.05 | 3.52 | 14.03 | 7.05 | 2.55 | 11.43 | 5.41 |
| 1982 | 28.54 | 8.73 | 11.71 | 5.72 | 3.25 | 14.02 | 7.1 | 2.34 | 11.37 | 5.39 |
| 1981 | 27.76 | 8.3 | 11.26 | 5.45 | 3.04 | 13.84 | 6.95 | 2.19 | 11.27 | 5.32 |
| 1980 | 27.21 | 8.08 | 10.91 | 5.35 | 2.94 | 13.75 | 6.95 | 2.1 | 10.99 | 5.35 |
| 1979 | 26.41 | 7.64 | 10.31 | 5.17 | 2.79 | 13.7 | 6.78 | 1.94 | 10.85 | 5.29 |
| 1978 | 25.69 | 7.51 | 9.82 | 4.99 | 2.66 | 13.42 | 6.42 | 2.01 | 10.64 | 5.09 |
| 1977 | 24.62 | 7.21 | 9.27 | 4.78 | 2.53 | 13 | 6.08 | 1.93 | 10.29 | 4.88 |
| 1976 | 23.53 | 6.75 | 8.61 | 4.58 | 2.41 | 12.8 | 5.99 | 1.72 | 9.81 | 4.84 |
| 1975 | 23.14 | 6.44 | 8.52 | 4.41 | 2.32 | 12.63 | 5.9 | 1.59 | 9.83 | 4.81 |
| 1974 | 22.39 | 6.15 | 8.1 | 4.28 | 2.22 | 12.46 | 5.8 | 1.46 | 9.53 | 4.79 |
| 1973 | 21.87 | 6.01 | 7.69 | 4.21 | 2.14 | 12.43 | 5.83 | 1.4 | 9.19 | 4.87 |
| 1972 | 21.62 | 5.82 | 7.32 | 4.13 | 2.06 | 12.65 | 5.93 | 1.29 | 9.04 | 5.02 |
| 1971 | 20.97 | 5.61 | 6.96 | 4.03 | 2 | 12.46 | 5.86 | 1.18 | 8.68 | 5.01 |
| 1970 | 20.25 | 5.4 | 6.51 | 3.92 | 1.93 | 12.27 | 5.73 | 1.11 | 8.33 | 4.94 |
| 1969 | 19.32 | 5.16 | 6.12 | 3.72 | 1.87 | 11.75 | 5.6 | 1.09 | 7.79 | 4.84 |
| 1968 | 18.5 | 4.77 | 5.85 | 3.41 | 1.79 | 11.28 | 5.53 | 1.03 | 7.45 | 4.81 |
| 1967 | 17.98 | 4.5 | 5.63 | 3.22 | 1.75 | 11.05 | 5.51 | 0.96 | 7.25 | 4.83 |
| 1966 | 17.21 | 4.24 | 5.32 | 3.04 | 1.69 | 10.66 | 5.29 | 0.89 | 7 | 4.61 |
| 1965 | 16.76 | 4.22 | 5.04 | 3.08 | 1.64 | 10.56 | 5.17 | 0.84 | 6.72 | 4.52 |
| 1964 | 16.27 | 4.01 | 4.74 | 2.94 | 1.61 | 10.41 | 5.08 | 0.78 | 6.57 | 4.46 |
| 1963 | 15.6 | 3.71 | 4.69 | 2.67 | 1.55 | 9.85 | 4.92 | 0.76 | 6.39 | 4.35 |
| 1962 | 15.4 | 3.61 | 4.72 | 2.61 | 1.55 | 9.66 | 4.89 | 0.73 | 6.34 | 4.31 |
| 1961 | 15.03 | 3.44 | 4.64 | 2.5 | 1.53 | 9.38 | 4.82 | 0.7 | 6.22 | 4.22 |


Comments