Abstract
According to data for 2021, the world’s largest egg exporter was the Netherlands, at approximately 643 thousand tonnes (kt). Thanks to its strong agricultural base and efficient production techniques, the Netherlands enjoys global leadership in egg production and export. Thanks to high breeding standards and strict quality control, the Dutch egg industry maintains a stable supply and is highly regarded on the international market. Compared to other countries, the Netherlands’ egg exports are overwhelming, and historical trends show that the Netherlands has always been a major exporter. For example, the Netherlands has maintained its top position in export volume over the past few years, likely due to its efficient production system, high technological capabilities, and utilization of international trade agreements. Meanwhile, the global egg market is also being affected by increased demand in emerging countries and changes in the balance of production and consumption by region. Demand for eggs is increasing as economies grow, particularly in Asia, which is changing global trade patterns. However, the Netherlands’ dominance is expected to continue and it has established itself as a stable exporting nation.
Egg exports (worldwide)
Based on data from 1961 to 2021, the highest recorded egg export volume was 710 thousand tonnes (kt) by the Netherlands in 2018. During this time, the Netherlands held an overwhelming position as the world’s largest egg exporter, with export volumes far exceeding those of any other country. The Netherlands’ success can be attributed to advanced production techniques, strict quality control and an efficient distribution network. However, in 2021, Dutch exports fell to around 90.6% of their peak, to 643 thousand tonnes. The decline is likely due to increased demand in the domestic market, rising production costs, and stricter environmental regulations. Although the Netherlands remains a major exporter, the decline in recent years reflects increased competition on international markets and changing production strategies. Over the past decades, Dutch egg exports have remained steadily high, but the decline in export volumes since their peak points to new challenges, such as international market fluctuations, supply chain issues and the transition to sustainable agriculture. Nevertheless, the Netherlands continues to have a strong influence due to its technological expertise and quality.
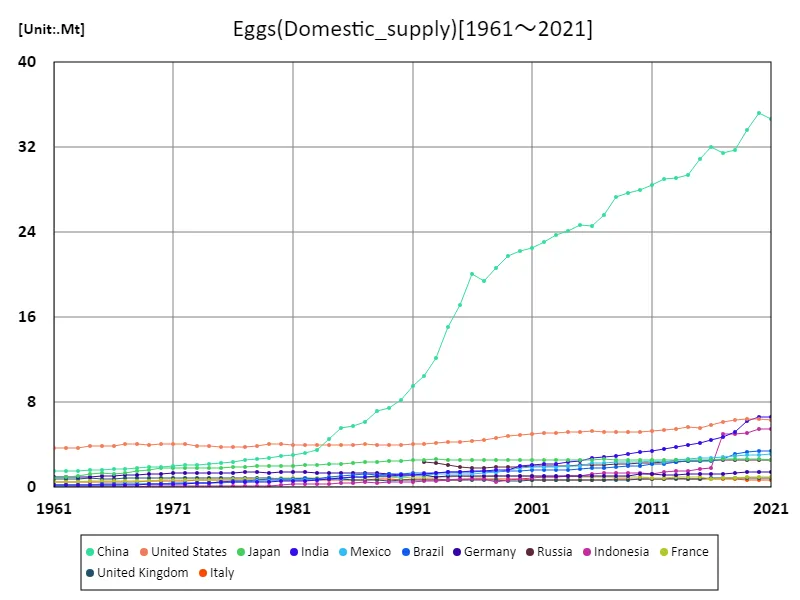
The maximum is 35.2Mt[2020] of China, and the current value is about 98.3%
Egg export volume (latest year, countries around the world)
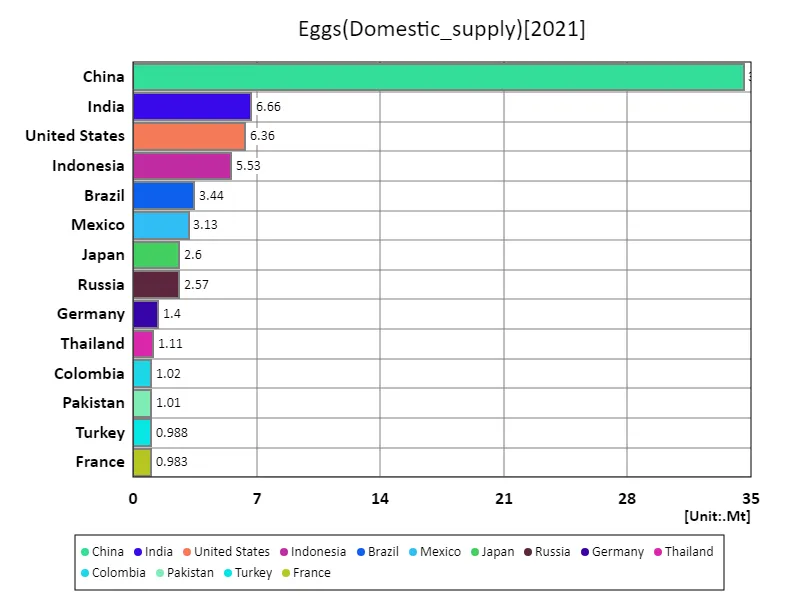
According to data for 2021, global egg exports totaled 3.37 million tonnes (Mt), of which the Netherlands accounted for the largest share, at 643 thousand tonnes (kt). The Netherlands has held a leading position on the global egg export market for many years and its production and export efficiency sets the industry standard. The Netherlands’ strengths lie in its advanced production technology, strict quality control, and efficient distribution system. Meanwhile, data for 2021 shows that the global average export volume was 28.8 thousand tons. The figures show that export volumes vary widely between countries, with a notable difference between large exporting countries such as the Netherlands and relatively small exporting countries. As has been the trend over the past few decades, major exporting countries like the Netherlands have continued to have stable supply capacities, allowing them to remain competitive on international markets. On the other hand, other exporting countries often experience fluctuations in export volumes due to factors such as domestic demand, production costs, and environmental regulations. Overall, the egg export market is highly dependent on the regional balance of supply and demand, with major exporting countries such as the Netherlands playing a key role in shaping market trends.
The maximum is 34.6Mt of China, the average is 507kt, and the total is 92.7Mt
Egg exports (continental)
According to 2021 data, global egg exports totaled 3.37 million tonnes (Mt), of which Europe’s share was 2.26 million tonnes (Mt), recording its highest export volume to date. Europe plays a central role in the egg export market, with countries such as the Netherlands, Poland and Germany positioned as major exporters. These countries have advanced production technologies and efficient distribution systems, enabling them to maintain their competitiveness in the international market. Looking at historical trends, European egg exports have remained consistently at high levels, with data showing particularly significant increases in export volumes since the 2000s. This increase is due to efficient production systems and growing demand on international markets, allowing the European egg industry to respond to global competition by reducing production costs and improving quality. On the other hand, Europe’s largest export volume was driven by stable demand in the domestic market and increased supply capacity in the international market. Due to strict regulations and environmental concerns, Europe is focusing on sustainable agricultural practices, which leads to improved quality and increased reliability. As a result, European eggs are highly valued on the international market, providing many export opportunities.
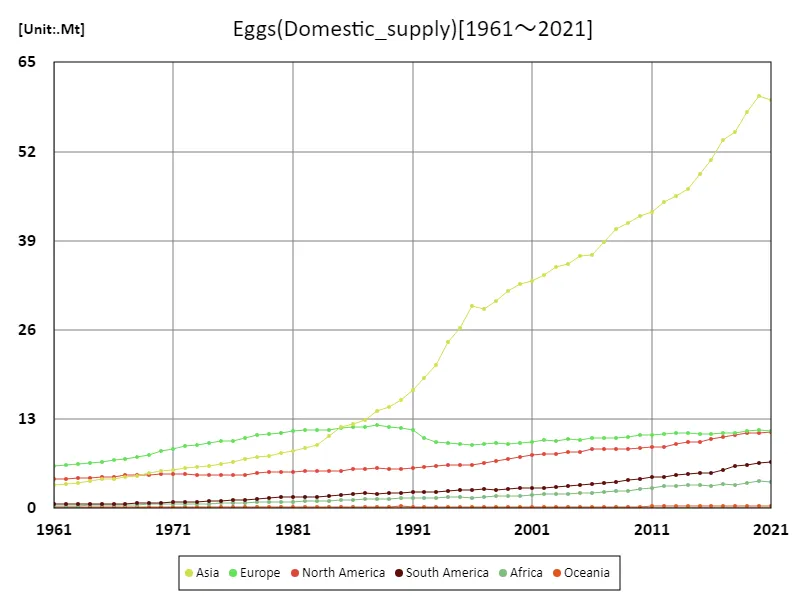
The maximum is 60.1Mt[2020] of Asia, and the current value is about 99.1%
Egg export volume (latest year, continent)
According to 2021 data, global egg exports totaled 3.37 million tonnes (Mt), of which Europe accounted for the largest share at 2.07 million tonnes (Mt). Europe dominates the egg export market, with the Netherlands, Poland and Germany among the major exporters. These countries remain competitive in the international market due to efficient production techniques and high quality standards. Historically, European egg exports have been consistently high, with export volumes increasing significantly since the 2000s. This increase is due to Europe’s strong agricultural base and stable supply capacity. The average European export volume was 562 thousand tonnes (kt), indicating that Europe is a major source of supply on the world market. The increase in European egg exports is due to stricter quality controls and enhanced sustainable farming practices, boosting their credibility in international markets. In particular, stronger environmental regulations and the introduction of efficient production systems have made European egg production more competitive. On the other hand, export volumes are also increasing from regions outside Europe, and various supply sources continue to compete in the global market.
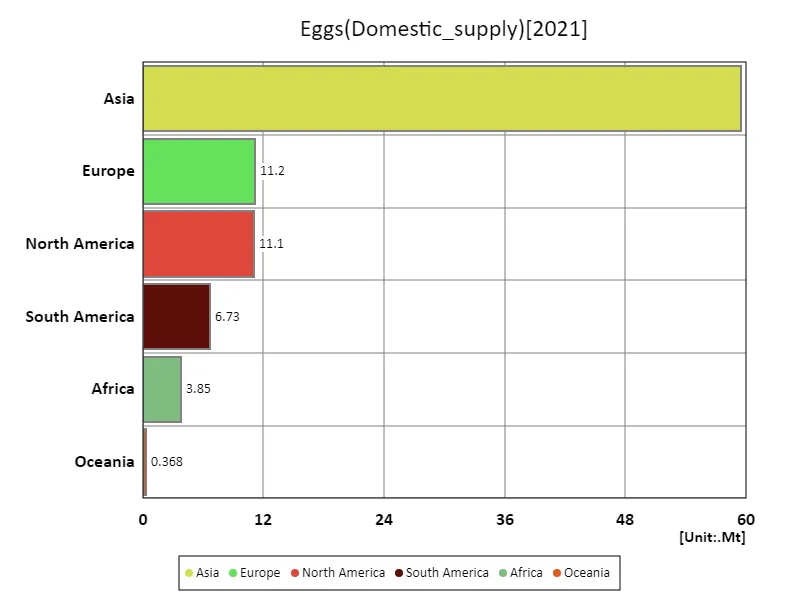
The maximum is 59.6Mt of Asia, the average is 15.5Mt, and the total is 92.8Mt
Main data
| Supply(Eggs, Domestic_supply) [Mt] | ||||||||||
|---|---|---|---|---|---|---|---|---|---|---|
| World | Asia | Upper-middle-income countries | Eastern Asia | China | High-income countries | Americas | Lower-middle-income countries | Europe | North America | |
| 2021 | 92.76 | 59.56 | 56.79 | 38.23 | 34.65 | 20.18 | 17.78 | 14.89 | 11.21 | 11.05 |
| 2020 | 93.49 | 60.08 | 57.3 | 38.82 | 35.23 | 20.33 | 17.66 | 14.92 | 11.46 | 11.02 |
| 2019 | 90.38 | 57.76 | 54.8 | 37.23 | 33.63 | 20.2 | 17.29 | 14.51 | 11.31 | 10.92 |
| 2018 | 86.42 | 54.84 | 52.78 | 35.4 | 31.77 | 19.66 | 16.89 | 13.18 | 10.99 | 10.72 |
| 2017 | 84.46 | 53.74 | 51.68 | 35 | 31.43 | 19.24 | 15.95 | 12.72 | 10.93 | 10.4 |
| 2016 | 80.44 | 50.75 | 48.6 | 35.57 | 32.07 | 18.79 | 15.22 | 12.25 | 10.83 | 10.06 |
| 2015 | 78.16 | 48.72 | 47.17 | 34.36 | 30.9 | 18.26 | 14.83 | 11.93 | 10.85 | 9.66 |
| 2014 | 75.75 | 46.51 | 45.17 | 32.73 | 29.38 | 18.14 | 14.66 | 11.63 | 10.93 | 9.66 |
| 2013 | 74.24 | 45.53 | 44.37 | 32.44 | 29.09 | 17.93 | 14.18 | 11.17 | 10.95 | 9.38 |
| 2012 | 72.48 | 44.67 | 43.55 | 32.33 | 29 | 17.4 | 13.52 | 10.77 | 10.76 | 8.91 |
| 2011 | 70.61 | 43.21 | 42.63 | 31.79 | 28.49 | 17.38 | 13.46 | 9.94 | 10.74 | 8.91 |
| 2010 | 69.35 | 42.53 | 41.82 | 31.31 | 28 | 17.34 | 13.07 | 9.59 | 10.72 | 8.81 |
| 2009 | 67.57 | 41.65 | 41.16 | 31.01 | 27.73 | 17.05 | 12.82 | 8.85 | 10.38 | 8.7 |
| 2008 | 66.27 | 40.73 | 40.19 | 30.62 | 27.31 | 17.04 | 12.44 | 8.57 | 10.31 | 8.63 |
| 2007 | 63.95 | 38.74 | 38.25 | 28.93 | 25.62 | 17.09 | 12.24 | 8.17 | 10.3 | 8.6 |
| 2006 | 61.97 | 36.99 | 36.85 | 27.82 | 24.6 | 16.86 | 12.27 | 7.83 | 10.18 | 8.67 |
| 2005 | 60.71 | 36.72 | 36.11 | 27.96 | 24.73 | 16.66 | 11.64 | 7.5 | 9.97 | 8.27 |
| 2004 | 59.49 | 35.65 | 35 | 27.29 | 24.08 | 16.9 | 11.35 | 7.16 | 10.15 | 8.17 |
| 2003 | 58.28 | 35.1 | 34.5 | 26.98 | 23.7 | 16.56 | 11.05 | 6.79 | 9.84 | 7.97 |
| 2002 | 57.25 | 34.05 | 33.54 | 26.31 | 23.04 | 16.7 | 10.93 | 6.59 | 9.99 | 7.96 |
| 2001 | 55.84 | 33.14 | 32.7 | 25.76 | 22.52 | 16.52 | 10.84 | 6.23 | 9.73 | 7.81 |
| 2000 | 54.7 | 32.73 | 32.21 | 25.42 | 22.23 | 16.18 | 10.46 | 5.93 | 9.48 | 7.51 |
| 1999 | 53.21 | 31.69 | 31.3 | 24.94 | 21.78 | 15.81 | 10.1 | 5.56 | 9.37 | 7.25 |
| 1998 | 51.32 | 30.18 | 29.74 | 23.74 | 20.62 | 15.76 | 9.57 | 5.29 | 9.58 | 6.89 |
| 1997 | 49.56 | 29.06 | 28.48 | 22.56 | 19.38 | 15.5 | 9.38 | 5.08 | 9.35 | 6.61 |
| 1996 | 49.49 | 29.47 | 28.78 | 23.22 | 20.04 | 15.23 | 8.99 | 4.98 | 9.27 | 6.38 |
| 1995 | 46.33 | 26.24 | 25.82 | 20.28 | 17.15 | 15.05 | 8.89 | 4.97 | 9.38 | 6.29 |
| 1994 | 44.27 | 24.19 | 23.9 | 18.28 | 15.13 | 14.94 | 8.75 | 4.93 | 9.55 | 6.25 |
| 1993 | 40.77 | 20.87 | 20.77 | 15.32 | 12.13 | 14.72 | 8.52 | 4.79 | 9.64 | 6.12 |
| 1992 | 39.37 | 19.04 | 19.47 | 13.67 | 10.51 | 14.69 | 8.35 | 4.67 | 10.23 | 6.01 |
| 1991 | 38.76 | 17.27 | 20.22 | 12.63 | 9.51 | 14.45 | 8.3 | 3.53 | 11.44 | 5.93 |
| 1990 | 37.12 | 15.72 | 18.8 | 11.22 | 8.22 | 14.37 | 7.97 | 3.4 | 11.68 | 5.73 |
| 1989 | 36.07 | 14.77 | 17.96 | 10.43 | 7.46 | 14.3 | 7.92 | 3.28 | 11.82 | 5.72 |
| 1988 | 35.8 | 14.14 | 17.56 | 10.14 | 7.18 | 14.55 | 7.96 | 3.17 | 12.11 | 5.81 |
| 1987 | 34.28 | 12.87 | 16.27 | 9.02 | 6.12 | 14.46 | 7.94 | 3.02 | 11.92 | 5.76 |
| 1986 | 33.39 | 12.25 | 15.65 | 8.5 | 5.77 | 14.35 | 7.78 | 2.87 | 11.89 | 5.7 |
| 1985 | 32.34 | 11.79 | 14.84 | 8.18 | 5.56 | 14.23 | 7.44 | 2.77 | 11.7 | 5.5 |
| 1984 | 30.58 | 10.54 | 13.41 | 7.1 | 4.53 | 14.05 | 7.22 | 2.63 | 11.48 | 5.39 |
| 1983 | 29.15 | 9.29 | 12.09 | 6.05 | 3.52 | 14.03 | 7.05 | 2.55 | 11.43 | 5.41 |
| 1982 | 28.54 | 8.73 | 11.71 | 5.72 | 3.25 | 14.02 | 7.1 | 2.34 | 11.37 | 5.39 |
| 1981 | 27.76 | 8.3 | 11.26 | 5.45 | 3.04 | 13.84 | 6.95 | 2.19 | 11.27 | 5.32 |
| 1980 | 27.21 | 8.08 | 10.91 | 5.35 | 2.94 | 13.75 | 6.95 | 2.1 | 10.99 | 5.35 |
| 1979 | 26.41 | 7.64 | 10.31 | 5.17 | 2.79 | 13.7 | 6.78 | 1.94 | 10.85 | 5.29 |
| 1978 | 25.69 | 7.51 | 9.82 | 4.99 | 2.66 | 13.42 | 6.42 | 2.01 | 10.64 | 5.09 |
| 1977 | 24.62 | 7.21 | 9.27 | 4.78 | 2.53 | 13 | 6.08 | 1.93 | 10.29 | 4.88 |
| 1976 | 23.53 | 6.75 | 8.61 | 4.58 | 2.41 | 12.8 | 5.99 | 1.72 | 9.81 | 4.84 |
| 1975 | 23.14 | 6.44 | 8.52 | 4.41 | 2.32 | 12.63 | 5.9 | 1.59 | 9.83 | 4.81 |
| 1974 | 22.39 | 6.15 | 8.1 | 4.28 | 2.22 | 12.46 | 5.8 | 1.46 | 9.53 | 4.79 |
| 1973 | 21.87 | 6.01 | 7.69 | 4.21 | 2.14 | 12.43 | 5.83 | 1.4 | 9.19 | 4.87 |
| 1972 | 21.62 | 5.82 | 7.32 | 4.13 | 2.06 | 12.65 | 5.93 | 1.29 | 9.04 | 5.02 |
| 1971 | 20.97 | 5.61 | 6.96 | 4.03 | 2 | 12.46 | 5.86 | 1.18 | 8.68 | 5.01 |
| 1970 | 20.25 | 5.4 | 6.51 | 3.92 | 1.93 | 12.27 | 5.73 | 1.11 | 8.33 | 4.94 |
| 1969 | 19.32 | 5.16 | 6.12 | 3.72 | 1.87 | 11.75 | 5.6 | 1.09 | 7.79 | 4.84 |
| 1968 | 18.5 | 4.77 | 5.85 | 3.41 | 1.79 | 11.28 | 5.53 | 1.03 | 7.45 | 4.81 |
| 1967 | 17.98 | 4.5 | 5.63 | 3.22 | 1.75 | 11.05 | 5.51 | 0.96 | 7.25 | 4.83 |
| 1966 | 17.21 | 4.24 | 5.32 | 3.04 | 1.69 | 10.66 | 5.29 | 0.89 | 7 | 4.61 |
| 1965 | 16.76 | 4.22 | 5.04 | 3.08 | 1.64 | 10.56 | 5.17 | 0.84 | 6.72 | 4.52 |
| 1964 | 16.27 | 4.01 | 4.74 | 2.94 | 1.61 | 10.41 | 5.08 | 0.78 | 6.57 | 4.46 |
| 1963 | 15.6 | 3.71 | 4.69 | 2.67 | 1.55 | 9.85 | 4.92 | 0.76 | 6.39 | 4.35 |
| 1962 | 15.4 | 3.61 | 4.72 | 2.61 | 1.55 | 9.66 | 4.89 | 0.73 | 6.34 | 4.31 |
| 1961 | 15.03 | 3.44 | 4.64 | 2.5 | 1.53 | 9.38 | 4.82 | 0.7 | 6.22 | 4.22 |


Comments