Abstract
When it comes to global meat production, China has the overwhelming leadership, producing 94.7Mt (million tonnes) in 2022. This trend has continued for the past few decades, with China’s meat production growing rapidly in line with its economic and population growth. The main factor is the expansion of livestock farming in China and increased meat consumption. Meanwhile, the United States and Brazil are also important meat producing countries, with their respective production volumes second only to China. The United States is particularly strong in beef production, while Brazil plays a key role in pork and chicken production. Although these countries continue to increase production, they are not matching China’s growth rate. Overall, global meat production is on the rise, driven especially by growing demand in Asian countries. As environmental issues such as climate change and resource depletion become more pressing, there is a need to find sustainable production methods. Increased concerns about health and animal welfare are also influencing production quality and methods.
Meat production (worldwide)
Global meat production shows a significant increase from 1961 to 2022, with China’s growth particularly notable. In 2022, China will record the world’s largest meat production at 94.7Mt (million tonnes), with production reaching 100% of its peak. This rapid increase is due to a surge in demand for meat resulting from China’s economic growth, population increase and improving living standards. Data from the past few decades shows that China’s meat production has been steadily increasing, with particularly notable increases from the 1970s to the early 2000s. During this period, China’s agricultural policy reform and modernization, as well as advances in agricultural technology, supported the expansion of production. Furthermore, China’s urbanization and rising incomes are driving meat consumption, which is directly translating into increased production. Meanwhile, major meat-producing countries such as the United States and Brazil have also increased production, but their growth rates have not matched China’s. While the United States plays a key role in beef production and Brazil in pork and chicken production, China’s share of total global production is growing. Overall, global meat production has been growing over the long term, with China seeing particularly strong growth. However, this growth also comes with environmental and sustainability challenges that will need to be addressed in the future.
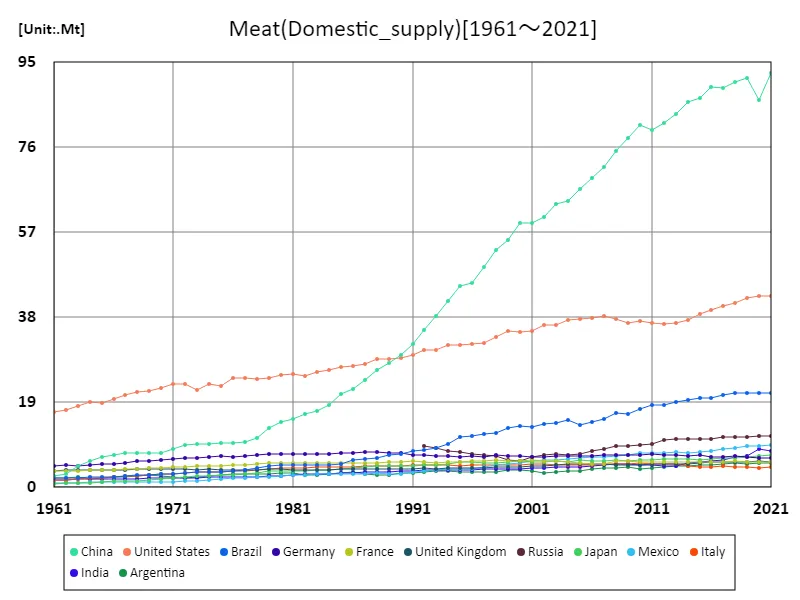
The maximum is the latest one, 92.5Mt of China
Meat production (latest year, world wide)
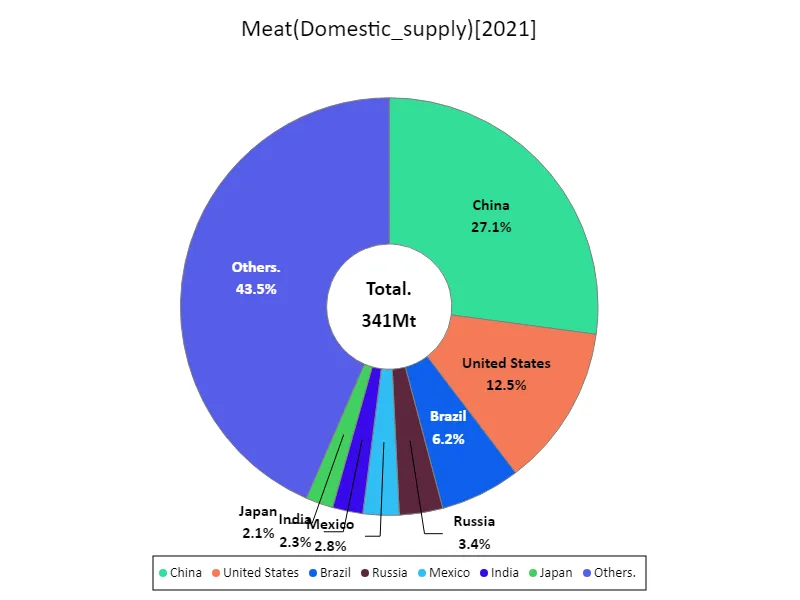
According to 2022 data, global crop meat production will reach a total of 356Mt (million tonnes), with an average production of 1.86Mt. Among them, China stands out with the largest production volume at 94.7 Mt. China’s production accounts for approximately 27% of total production, giving it an overwhelming presence in the global farm meat market. Over the past few decades, China has seen a dramatic increase in meat demand and production as a result of rapid economic growth, urbanization and rising living standards. Especially since the 1980s, as agriculture has become more modern and efficient, China’s meat production has grown more rapidly than other countries. This puts China at the center of global meat production. While other major producers are also noteworthy, the size and rate of growth of China’s production is remarkable, even when compared to countries such as the United States and Brazil. The United States is particularly strong in beef production, and Brazil plays an important role in pork and chicken production, but China’s growth is notable overall. Behind this growth are changing eating habits and market expansion, with environmental impact and sustainability issues also being discussed. From a global perspective, the rapid growth of China’s meat production will have a major impact on future agricultural policies and international market trends.

The maximum is 92.5Mt of China, the average is 1.86Mt, and the total is 341Mt
Fat production (worldwide)
As per the 2022 data, overall crop fat production will reach 267kt (thousand tonnes), with India highlighted as the largest producer. India’s crop fat production was 267kt, the highest at its peak, giving it a dominant share of the global crop fat market. This trend reflects changes in India’s agriculture and food industry. India has been a major producer of agricultural fats for many years, especially edible oils. India’s agricultural policies and technological advances have supported the expansion of fat production. In particular, improved agricultural techniques and the introduction of new crops have contributed to increased production. Looking back at historical data, India’s crop fat production has been consistently increasing, especially since the 2000s. This is mainly due to the increasing demand for edible oil as a result of India’s economic growth and population increase. The consumption of edible oil in India is increasing and it is also becoming competitive in the export market. India’s production growth rate and scale is remarkable compared to other major producing countries, underscoring its important position in the regional and global markets. However, sustainable production and environmental friendliness will remain a challenge going forward. Maintaining and increasing productivity while reducing the impact on the environment will be the focus of future agricultural policies.

The maximum is the latest one, 92.5Mt of China
Fat production (latest year, world countries)
As per the 2022 data, the total global production of crop fats is 416kt (thousand tonnes), of which India recorded the highest production of 267kt. The figures show that India is a major producer of crop fats, accounting for around 64% of the world’s total production. Even when compared to the average production of 14.9kt, India’s production stands out. Looking at data from the past few decades, India’s crop fat production has been consistently on the rise. Especially since the 2000s, India has dramatically increased production through advances in agricultural technology and improved productivity. This is mainly due to the increasing demand for edible oil and improved agricultural policies. In India, the main crops produced are corn oil and soybean oil, and improvements in production techniques for these crops are supporting the expansion of fat production. In addition, Indian agricultural fats are produced to meet the demand of the domestic market and are also exported to international markets. This has made India’s agriculture sector more competitive and positioned it as a key player in the global crop fat market. However, behind this rapid growth lies sustainability and environmental issues. As the expansion of production raises concerns about the impact on the environment, it will be important in the future to balance the introduction of sustainable production methods with environmental protection.
The maximum is 92.5Mt of China, the average is 1.86Mt, and the total is 341Mt
Main data
| Supply(Meat, Domestic_supply) [Mt] | ||||||||||
|---|---|---|---|---|---|---|---|---|---|---|
| World | Upper-middle-income countries | Asia | High-income countries | Eastern Asia | Americas | China | North America | Europe | Lower-middle-income countries | |
| 2021 | 340.96 | 170.58 | 156.5 | 114.55 | 104.78 | 97.48 | 92.53 | 60.09 | 58.44 | 47.67 |
| 2020 | 331.95 | 162.94 | 149.48 | 114.16 | 98.47 | 96.62 | 86.55 | 59.85 | 58.18 | 46.79 |
| 2019 | 336.27 | 167.28 | 154.7 | 113.74 | 103.2 | 96.21 | 91.56 | 59.35 | 58.49 | 47.32 |
| 2018 | 330.73 | 163.82 | 150.7 | 112.39 | 101.95 | 94.27 | 90.59 | 57.56 | 59.11 | 47.33 |
| 2017 | 323.18 | 161.3 | 147.56 | 109.68 | 100.34 | 92.1 | 89.34 | 56.32 | 57.87 | 45.23 |
| 2016 | 319 | 159.45 | 145.98 | 109.16 | 100.13 | 89.99 | 89.49 | 55.17 | 57.74 | 43.54 |
| 2015 | 313.67 | 156.93 | 141.85 | 107.4 | 97.5 | 89.06 | 87.1 | 53.94 | 57.52 | 42.58 |
| 2014 | 307.48 | 154.82 | 139.11 | 104.79 | 96.49 | 86.67 | 86.23 | 52.09 | 56.83 | 41.1 |
| 2013 | 301.97 | 151.17 | 135.22 | 104.64 | 93.68 | 85.09 | 83.43 | 51.38 | 58.03 | 39.83 |
| 2012 | 295.92 | 146.79 | 131.49 | 104.51 | 91.3 | 83.34 | 81.35 | 50.89 | 58.3 | 38.45 |
| 2011 | 290.77 | 143.22 | 129.27 | 104.55 | 89.68 | 82.77 | 79.91 | 50.84 | 57.07 | 37.82 |
| 2010 | 288.35 | 142.12 | 128.52 | 104.47 | 90.51 | 81.78 | 80.99 | 51.2 | 57.23 | 36.65 |
| 2009 | 280.91 | 136.7 | 124.43 | 103.54 | 87.2 | 80.3 | 77.98 | 50.51 | 56.69 | 35.49 |
| 2008 | 276.67 | 133.31 | 119.67 | 104.34 | 84.36 | 81.03 | 75.13 | 51.19 | 56.85 | 33.89 |
| 2007 | 268.91 | 126.6 | 114.96 | 104.85 | 80.72 | 79.27 | 71.55 | 51.47 | 56.01 | 32.54 |
| 2006 | 258.55 | 120.96 | 110.02 | 102.54 | 78.2 | 76.92 | 69.18 | 50.65 | 54.17 | 30.32 |
| 2005 | 250.87 | 114.98 | 105.67 | 101.77 | 75.56 | 74.42 | 66.65 | 49.86 | 53.9 | 29.37 |
| 2004 | 245.27 | 111.95 | 101.41 | 100.47 | 72.42 | 74.5 | 64.07 | 49.35 | 53.37 | 28.34 |
| 2003 | 241.5 | 109.95 | 100.04 | 100.06 | 72.22 | 72.09 | 63.43 | 47.87 | 53.66 | 27.11 |
| 2002 | 235.67 | 106.01 | 95.52 | 99.42 | 69.09 | 71.75 | 60.44 | 47.9 | 53.37 | 25.98 |
| 2001 | 228.47 | 102.76 | 92.27 | 97.13 | 67.31 | 69.72 | 59.03 | 46.11 | 52.08 | 24.63 |
| 2000 | 226.55 | 101.85 | 91.78 | 96.67 | 67.55 | 69.39 | 59.06 | 45.65 | 51.14 | 24.2 |
| 1999 | 220.15 | 96.65 | 86.87 | 95.26 | 63.59 | 68.25 | 55.35 | 45.41 | 51.25 | 23.62 |
| 1998 | 214.7 | 93.77 | 83.82 | 93.5 | 60.72 | 64.93 | 53.09 | 43.52 | 52.77 | 23.04 |
| 1997 | 206.41 | 89.66 | 80.02 | 89.79 | 56.95 | 62.37 | 49.25 | 41.37 | 51.13 | 22.75 |
| 1996 | 201.49 | 85.31 | 75.86 | 90.09 | 53.55 | 61.04 | 45.66 | 40.69 | 52.31 | 21.93 |
| 1995 | 199.3 | 84.54 | 74.87 | 88.89 | 52.61 | 60.1 | 44.9 | 40.42 | 52.16 | 21.86 |
| 1994 | 193.75 | 80.37 | 70.73 | 87.95 | 48.81 | 58.35 | 41.64 | 40.22 | 52.86 | 21.57 |
| 1993 | 187.99 | 76.34 | 66.48 | 86.71 | 45.22 | 55.71 | 38.19 | 38.72 | 54.32 | 21.03 |
| 1992 | 184.55 | 73.91 | 62.57 | 85.49 | 42.21 | 54.55 | 35.19 | 38.47 | 55.84 | 21.1 |
| 1991 | 181.03 | 78.81 | 55.55 | 82.77 | 38.77 | 52.59 | 32.12 | 37.12 | 61.55 | 15.37 |
| 1990 | 177.51 | 77.17 | 52.17 | 81.74 | 36.05 | 50.54 | 29.62 | 36.03 | 63.72 | 14.68 |
| 1989 | 172.05 | 73.66 | 49.45 | 80.26 | 34.01 | 49.37 | 27.72 | 35.61 | 62.68 | 14.29 |
| 1988 | 169.09 | 71.38 | 47.36 | 80.08 | 32.42 | 49.07 | 26.33 | 35.81 | 62.31 | 13.86 |
| 1987 | 162.87 | 67.42 | 44.16 | 78.31 | 29.71 | 47.68 | 23.88 | 34.7 | 60.83 | 13.48 |
| 1986 | 157.23 | 64.4 | 41.34 | 76.27 | 27.48 | 47.26 | 21.96 | 34.22 | 58.67 | 12.81 |
| 1985 | 152.43 | 61.33 | 39.39 | 75.06 | 26.15 | 45.57 | 20.81 | 33.77 | 57.67 | 12.39 |
| 1984 | 147.05 | 57.82 | 36.46 | 73.47 | 23.59 | 44.29 | 18.47 | 33.06 | 56.83 | 12.17 |
| 1983 | 143.37 | 55.34 | 34.25 | 72.59 | 21.94 | 43.87 | 17 | 32.7 | 56.02 | 11.89 |
| 1982 | 139.02 | 52.95 | 32.82 | 71.17 | 21.06 | 42.62 | 16.34 | 31.5 | 54.45 | 11.34 |
| 1981 | 137.58 | 51.99 | 31.03 | 71.34 | 19.95 | 43.39 | 15.36 | 31.82 | 54.49 | 10.72 |
| 1980 | 135.39 | 50.59 | 29.47 | 71.2 | 19.19 | 42.58 | 14.7 | 31.31 | 54.8 | 10.16 |
| 1979 | 130.93 | 48.24 | 27.67 | 69.7 | 17.81 | 40.95 | 13.27 | 30.28 | 54.16 | 9.62 |
| 1978 | 125.78 | 45.18 | 24.58 | 68.05 | 15.15 | 40.28 | 11.05 | 30.03 | 52.59 | 9.25 |
| 1977 | 120.92 | 42.65 | 22.78 | 66.36 | 13.91 | 39.7 | 10.21 | 30.13 | 50.59 | 8.82 |
| 1976 | 118.61 | 41.82 | 21.94 | 65.35 | 13.41 | 39.08 | 9.99 | 29.74 | 49.84 | 8.46 |
| 1975 | 114.97 | 41.47 | 21.43 | 62.47 | 13.16 | 36.5 | 9.92 | 27.59 | 49.73 | 8.12 |
| 1974 | 111.94 | 39.15 | 20.86 | 61.9 | 12.79 | 36.25 | 9.68 | 27.88 | 48.22 | 8.07 |
| 1973 | 107.82 | 37.69 | 20.38 | 59.54 | 12.62 | 34.11 | 9.57 | 26.35 | 46.53 | 7.87 |
| 1972 | 106.8 | 36.34 | 19.68 | 60.14 | 12.27 | 35.08 | 9.44 | 27.57 | 45.17 | 7.62 |
| 1971 | 103.34 | 34.43 | 18.45 | 58.72 | 11.14 | 34.73 | 8.59 | 27.38 | 43.56 | 7.5 |
| 1970 | 99.16 | 32.67 | 17.05 | 56.45 | 9.89 | 34.16 | 7.58 | 26.46 | 41.53 | 7.3 |
| 1969 | 96.07 | 32.19 | 16.64 | 54.06 | 9.64 | 33.18 | 7.57 | 25.52 | 39.86 | 7.17 |
| 1968 | 94.31 | 31.87 | 16.3 | 52.87 | 9.52 | 32.5 | 7.67 | 25.18 | 39.38 | 6.96 |
| 1967 | 91.16 | 30.87 | 16.02 | 51.06 | 9.5 | 31.32 | 7.71 | 24.49 | 38.01 | 6.71 |
| 1966 | 87.3 | 29.4 | 15.3 | 48.98 | 8.95 | 29.83 | 7.24 | 23.29 | 36.46 | 6.5 |
| 1965 | 83.54 | 27.95 | 14.28 | 47.01 | 8.19 | 28.55 | 6.68 | 22.33 | 35.17 | 6.28 |
| 1964 | 79.57 | 24.86 | 13.24 | 46.43 | 7.35 | 28.42 | 5.91 | 22.47 | 32.46 | 6.05 |
| 1963 | 78 | 25.36 | 11.68 | 44.55 | 5.96 | 27.59 | 4.68 | 21.42 | 33.45 | 5.88 |
| 1962 | 74.1 | 23.06 | 9.88 | 43.08 | 4.28 | 26.52 | 3.06 | 20.43 | 32.49 | 5.79 |
| 1961 | 70.65 | 21.43 | 9.01 | 41.44 | 3.63 | 25.77 | 2.57 | 19.9 | 30.82 | 5.69 |


Comments