Abstract
Below is an overview of the relationship between domestic meat supply and population in global agriculture, based on 2021 data. According to 2021 data, Mongolia has the highest per capita meat consumption in the world, at 129 kg. The background to this is deeply connected to Mongolian traditional food culture and lifestyle. Mongolia has a strong nomadic culture and livestock rearing is central to life, with beef, lamb and horse meat being the main sources of protein. This is why meat consumption is so high. In contrast, meat consumption varies in other parts of the world. For example, although meat consumption is high in Western countries, there is a gradual trend towards a decline in consumption due to concerns about obesity and health issues. Meanwhile, meat consumption in developing countries is increasing along with economic growth, but it still has not reached the same level as Mongolia. As such, we can see that meat consumption varies greatly depending on the culture and economic status of each region. Mongolia’s high meat consumption is due to the country’s unique lifestyle and traditions, which makes it stand out compared to other countries.
Domestic meat supply/population (worldwide)
Considering data from 1961 to 2021, the trend in domestic meat supply shows a significant change. In particular, Bermuda recorded a peak of 190 kg per capita in 2008, but supply is currently at only 99.8% of that peak. The decline is due to changes in Bermuda’s economic situation and dietary habits. Between the 1960s and 1980s, meat supplies were on the rise in many countries, and consumption increased along with economic growth. However, since the 1990s, meat consumption has stagnated or even declined, especially in developed countries, due to growing health consciousness and concern about environmental issues. Bermuda’s case follows this line, with high peak supply gradually tapering off to reach stable levels in modern times. Additionally, meat consumption in developing countries is still increasing along with economic growth, which is impacting overall consumption. However, changes in meat consumption are heavily influenced by regional culture and economic backgrounds, and there are characteristics that vary depending on the situation in each country. Thus, domestic meat supplies continue to change over time, with peaks and declines in particular countries reflecting socio-economic changes in those countries.
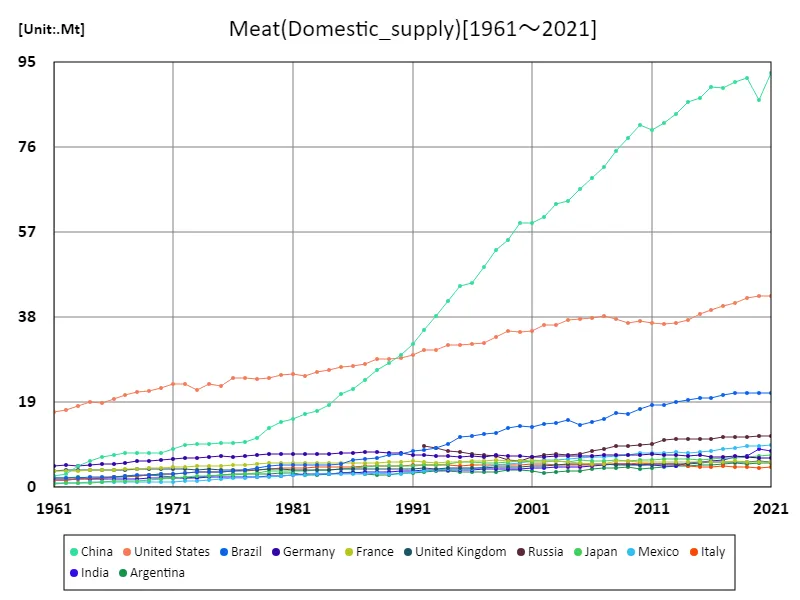
The maximum is the latest one, 92.5Mt of China
Domestic meat supply/population (latest year, countries around the world)
Looking at the characteristics and trends of domestic agri-meat supply and population based on 2021 data, Nauru recorded an astounding supply of 160 kg per capita, the highest in the world. Nauru’s high meat consumption is due to limited land resources, a unique food culture and economic structure. Meanwhile, the global average supply is 53.3kg, a significant difference from Nauru’s figure. Overall data on crop meat supplies: total supply for 2021 is 9.7 tonnes, which serves as an indication of overall supply. The increase or decrease in supply varies greatly depending on each country’s economic situation, agricultural techniques, consumer eating habits, and other factors. Countries with particularly high supply tend to be economically wealthy or have areas with traditionally high meat consumption. Over the past few decades, meat supplies have varied widely from country to country. In developed countries, supply is on the decline due to growing health consciousness, while in developing countries, supply is on the rise in line with economic growth. These changes in data point to the influence of global economic trends and regional socio-cultural factors.
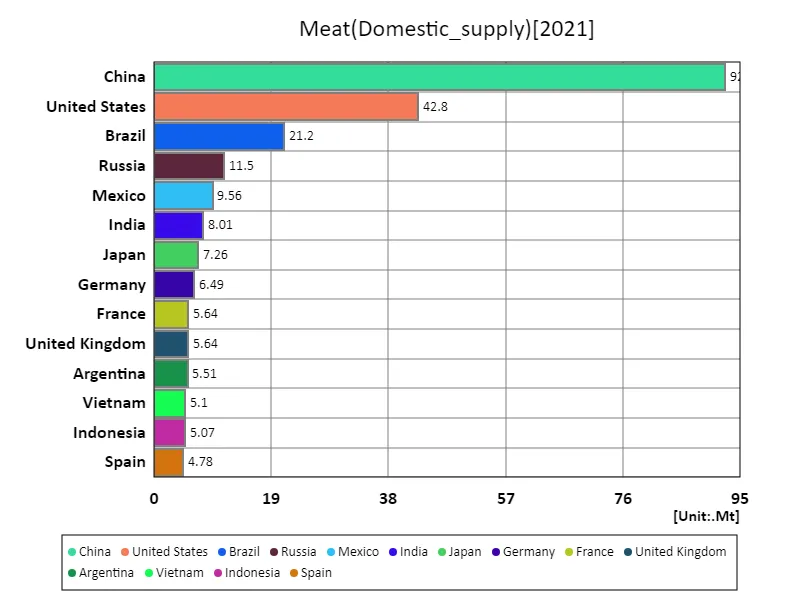
The maximum is 92.5Mt of China, the average is 1.86Mt, and the total is 341Mt
Meat domestic supply/population (continent)
Data for 2021 shows that the Oceania region recorded the highest domestic supply of crop meat at 131 kg. This is thought to be due to Oceania’s vast land area and developed livestock industry. Oceania, especially Australia and New Zealand, is a region with large-scale agriculture and livestock industries and high meat production and consumption. Over the past few decades, crop meat supplies have shown different trends across regions. Particularly in developed countries, there is a trend toward decreasing meat consumption due to growing health consciousness and environmental concerns. Meanwhile, regions like Oceania are seeing an increase in supply due to agricultural development and high demand for meat. Overall, meat supply is heavily influenced by economic factors, technological advances and consumer eating habits. Oceania’s high supply is driven by the region’s agricultural policies and consumer culture, and is particularly favoured by its vast land area and climatic conditions. In contrast, other regions have different situations, with meat supplies varying widely depending on local characteristics and socio-economic backgrounds.
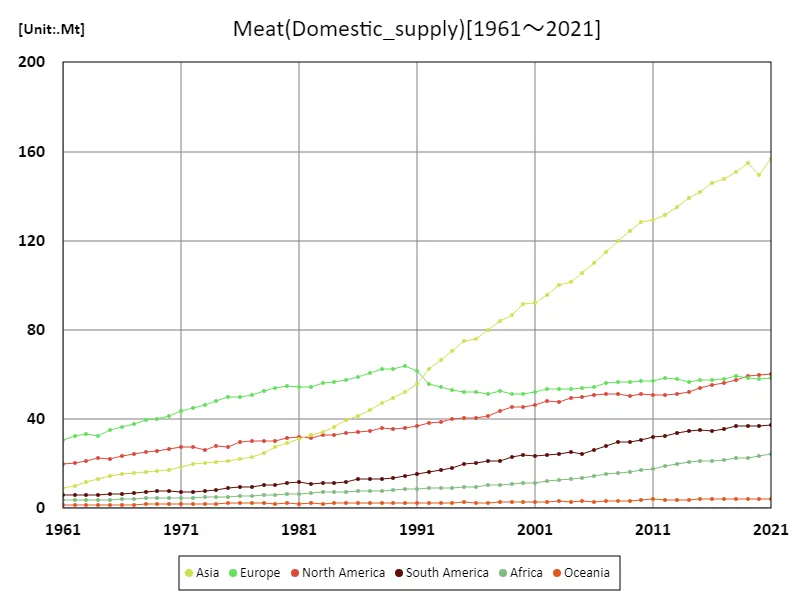
The maximum is the latest one, 157Mt of Asia
Meat domestic supply/population (latest year, continent)
Based on 2021 data, domestic supply of crop meat was highest in North America, recording 101 kg. North America, especially the United States and Canada, boasts a very high supply due to their vast farmland, advanced agricultural techniques and deep-rooted meat consumption culture. In comparison, the overall average supply was 68.5kg, with North America well above average. The total global supply is 411 kg, which indicates a regional imbalance in supply. In particular, meat supply is high in developed countries, while in developing countries meat supply tends to increase with economic growth, but has not yet reached the same high levels as in developed countries. Over the past few decades, there have been significant regional differences in meat supplies. In developed countries, meat consumption is declining due to health and environmental concerns, but meat supplies remain high in regions such as North America. This indicates that food culture and economic factors have an influence, and that regional characteristics are greatly reflected in the amount of meat supplied.
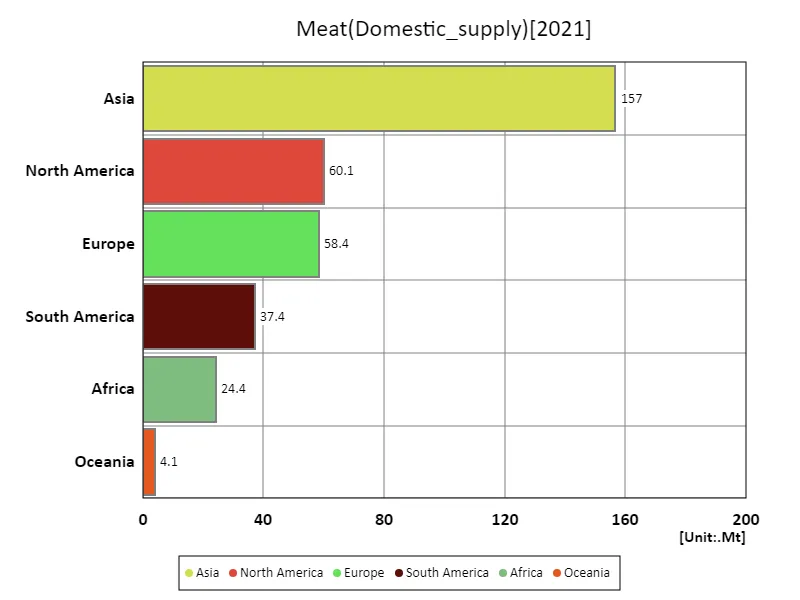
The maximum is 157Mt of Asia, the average is 56.8Mt, and the total is 341Mt
Main data
| Supply(Meat, Domestic_supply) [Mt] | ||||||||||
|---|---|---|---|---|---|---|---|---|---|---|
| World | Upper-middle-income countries | Asia | High-income countries | Eastern Asia | Americas | China | North America | Europe | Lower-middle-income countries | |
| 2021 | 340.96 | 170.58 | 156.5 | 114.55 | 104.78 | 97.48 | 92.53 | 60.09 | 58.44 | 47.67 |
| 2020 | 331.95 | 162.94 | 149.48 | 114.16 | 98.47 | 96.62 | 86.55 | 59.85 | 58.18 | 46.79 |
| 2019 | 336.27 | 167.28 | 154.7 | 113.74 | 103.2 | 96.21 | 91.56 | 59.35 | 58.49 | 47.32 |
| 2018 | 330.73 | 163.82 | 150.7 | 112.39 | 101.95 | 94.27 | 90.59 | 57.56 | 59.11 | 47.33 |
| 2017 | 323.18 | 161.3 | 147.56 | 109.68 | 100.34 | 92.1 | 89.34 | 56.32 | 57.87 | 45.23 |
| 2016 | 319 | 159.45 | 145.98 | 109.16 | 100.13 | 89.99 | 89.49 | 55.17 | 57.74 | 43.54 |
| 2015 | 313.67 | 156.93 | 141.85 | 107.4 | 97.5 | 89.06 | 87.1 | 53.94 | 57.52 | 42.58 |
| 2014 | 307.48 | 154.82 | 139.11 | 104.79 | 96.49 | 86.67 | 86.23 | 52.09 | 56.83 | 41.1 |
| 2013 | 301.97 | 151.17 | 135.22 | 104.64 | 93.68 | 85.09 | 83.43 | 51.38 | 58.03 | 39.83 |
| 2012 | 295.92 | 146.79 | 131.49 | 104.51 | 91.3 | 83.34 | 81.35 | 50.89 | 58.3 | 38.45 |
| 2011 | 290.77 | 143.22 | 129.27 | 104.55 | 89.68 | 82.77 | 79.91 | 50.84 | 57.07 | 37.82 |
| 2010 | 288.35 | 142.12 | 128.52 | 104.47 | 90.51 | 81.78 | 80.99 | 51.2 | 57.23 | 36.65 |
| 2009 | 280.91 | 136.7 | 124.43 | 103.54 | 87.2 | 80.3 | 77.98 | 50.51 | 56.69 | 35.49 |
| 2008 | 276.67 | 133.31 | 119.67 | 104.34 | 84.36 | 81.03 | 75.13 | 51.19 | 56.85 | 33.89 |
| 2007 | 268.91 | 126.6 | 114.96 | 104.85 | 80.72 | 79.27 | 71.55 | 51.47 | 56.01 | 32.54 |
| 2006 | 258.55 | 120.96 | 110.02 | 102.54 | 78.2 | 76.92 | 69.18 | 50.65 | 54.17 | 30.32 |
| 2005 | 250.87 | 114.98 | 105.67 | 101.77 | 75.56 | 74.42 | 66.65 | 49.86 | 53.9 | 29.37 |
| 2004 | 245.27 | 111.95 | 101.41 | 100.47 | 72.42 | 74.5 | 64.07 | 49.35 | 53.37 | 28.34 |
| 2003 | 241.5 | 109.95 | 100.04 | 100.06 | 72.22 | 72.09 | 63.43 | 47.87 | 53.66 | 27.11 |
| 2002 | 235.67 | 106.01 | 95.52 | 99.42 | 69.09 | 71.75 | 60.44 | 47.9 | 53.37 | 25.98 |
| 2001 | 228.47 | 102.76 | 92.27 | 97.13 | 67.31 | 69.72 | 59.03 | 46.11 | 52.08 | 24.63 |
| 2000 | 226.55 | 101.85 | 91.78 | 96.67 | 67.55 | 69.39 | 59.06 | 45.65 | 51.14 | 24.2 |
| 1999 | 220.15 | 96.65 | 86.87 | 95.26 | 63.59 | 68.25 | 55.35 | 45.41 | 51.25 | 23.62 |
| 1998 | 214.7 | 93.77 | 83.82 | 93.5 | 60.72 | 64.93 | 53.09 | 43.52 | 52.77 | 23.04 |
| 1997 | 206.41 | 89.66 | 80.02 | 89.79 | 56.95 | 62.37 | 49.25 | 41.37 | 51.13 | 22.75 |
| 1996 | 201.49 | 85.31 | 75.86 | 90.09 | 53.55 | 61.04 | 45.66 | 40.69 | 52.31 | 21.93 |
| 1995 | 199.3 | 84.54 | 74.87 | 88.89 | 52.61 | 60.1 | 44.9 | 40.42 | 52.16 | 21.86 |
| 1994 | 193.75 | 80.37 | 70.73 | 87.95 | 48.81 | 58.35 | 41.64 | 40.22 | 52.86 | 21.57 |
| 1993 | 187.99 | 76.34 | 66.48 | 86.71 | 45.22 | 55.71 | 38.19 | 38.72 | 54.32 | 21.03 |
| 1992 | 184.55 | 73.91 | 62.57 | 85.49 | 42.21 | 54.55 | 35.19 | 38.47 | 55.84 | 21.1 |
| 1991 | 181.03 | 78.81 | 55.55 | 82.77 | 38.77 | 52.59 | 32.12 | 37.12 | 61.55 | 15.37 |
| 1990 | 177.51 | 77.17 | 52.17 | 81.74 | 36.05 | 50.54 | 29.62 | 36.03 | 63.72 | 14.68 |
| 1989 | 172.05 | 73.66 | 49.45 | 80.26 | 34.01 | 49.37 | 27.72 | 35.61 | 62.68 | 14.29 |
| 1988 | 169.09 | 71.38 | 47.36 | 80.08 | 32.42 | 49.07 | 26.33 | 35.81 | 62.31 | 13.86 |
| 1987 | 162.87 | 67.42 | 44.16 | 78.31 | 29.71 | 47.68 | 23.88 | 34.7 | 60.83 | 13.48 |
| 1986 | 157.23 | 64.4 | 41.34 | 76.27 | 27.48 | 47.26 | 21.96 | 34.22 | 58.67 | 12.81 |
| 1985 | 152.43 | 61.33 | 39.39 | 75.06 | 26.15 | 45.57 | 20.81 | 33.77 | 57.67 | 12.39 |
| 1984 | 147.05 | 57.82 | 36.46 | 73.47 | 23.59 | 44.29 | 18.47 | 33.06 | 56.83 | 12.17 |
| 1983 | 143.37 | 55.34 | 34.25 | 72.59 | 21.94 | 43.87 | 17 | 32.7 | 56.02 | 11.89 |
| 1982 | 139.02 | 52.95 | 32.82 | 71.17 | 21.06 | 42.62 | 16.34 | 31.5 | 54.45 | 11.34 |
| 1981 | 137.58 | 51.99 | 31.03 | 71.34 | 19.95 | 43.39 | 15.36 | 31.82 | 54.49 | 10.72 |
| 1980 | 135.39 | 50.59 | 29.47 | 71.2 | 19.19 | 42.58 | 14.7 | 31.31 | 54.8 | 10.16 |
| 1979 | 130.93 | 48.24 | 27.67 | 69.7 | 17.81 | 40.95 | 13.27 | 30.28 | 54.16 | 9.62 |
| 1978 | 125.78 | 45.18 | 24.58 | 68.05 | 15.15 | 40.28 | 11.05 | 30.03 | 52.59 | 9.25 |
| 1977 | 120.92 | 42.65 | 22.78 | 66.36 | 13.91 | 39.7 | 10.21 | 30.13 | 50.59 | 8.82 |
| 1976 | 118.61 | 41.82 | 21.94 | 65.35 | 13.41 | 39.08 | 9.99 | 29.74 | 49.84 | 8.46 |
| 1975 | 114.97 | 41.47 | 21.43 | 62.47 | 13.16 | 36.5 | 9.92 | 27.59 | 49.73 | 8.12 |
| 1974 | 111.94 | 39.15 | 20.86 | 61.9 | 12.79 | 36.25 | 9.68 | 27.88 | 48.22 | 8.07 |
| 1973 | 107.82 | 37.69 | 20.38 | 59.54 | 12.62 | 34.11 | 9.57 | 26.35 | 46.53 | 7.87 |
| 1972 | 106.8 | 36.34 | 19.68 | 60.14 | 12.27 | 35.08 | 9.44 | 27.57 | 45.17 | 7.62 |
| 1971 | 103.34 | 34.43 | 18.45 | 58.72 | 11.14 | 34.73 | 8.59 | 27.38 | 43.56 | 7.5 |
| 1970 | 99.16 | 32.67 | 17.05 | 56.45 | 9.89 | 34.16 | 7.58 | 26.46 | 41.53 | 7.3 |
| 1969 | 96.07 | 32.19 | 16.64 | 54.06 | 9.64 | 33.18 | 7.57 | 25.52 | 39.86 | 7.17 |
| 1968 | 94.31 | 31.87 | 16.3 | 52.87 | 9.52 | 32.5 | 7.67 | 25.18 | 39.38 | 6.96 |
| 1967 | 91.16 | 30.87 | 16.02 | 51.06 | 9.5 | 31.32 | 7.71 | 24.49 | 38.01 | 6.71 |
| 1966 | 87.3 | 29.4 | 15.3 | 48.98 | 8.95 | 29.83 | 7.24 | 23.29 | 36.46 | 6.5 |
| 1965 | 83.54 | 27.95 | 14.28 | 47.01 | 8.19 | 28.55 | 6.68 | 22.33 | 35.17 | 6.28 |
| 1964 | 79.57 | 24.86 | 13.24 | 46.43 | 7.35 | 28.42 | 5.91 | 22.47 | 32.46 | 6.05 |
| 1963 | 78 | 25.36 | 11.68 | 44.55 | 5.96 | 27.59 | 4.68 | 21.42 | 33.45 | 5.88 |
| 1962 | 74.1 | 23.06 | 9.88 | 43.08 | 4.28 | 26.52 | 3.06 | 20.43 | 32.49 | 5.79 |
| 1961 | 70.65 | 21.43 | 9.01 | 41.44 | 3.63 | 25.77 | 2.57 | 19.9 | 30.82 | 5.69 |


Comments