Abstract
Trends based on the latest data for 2022 regarding global agricultural oil and margarine production and the fact that India is the largest producer. India’s production reached 1.62Mt, which reflects the region’s agricultural base and economic impact. On the other hand, other major producing countries include China and the United States, but their production volumes are relatively balanced. is greatly influenced by each country’s economic situation, consumption patterns, and agricultural policies, and necessary changes and trade trends are also important factors. Additionally, environmental regulations and health-conscious policies ensure product quality and sustainability.The global agricultural oil and margarine market is expected to undergo gradual changes and growth amidst the necessary increases and technological innovations in the future.
Oil production (worldwide)
Between 1961 and 2022, global crop oil production has undergone significant changes. India, in particular, is a significant producer, having recorded a peak of 2.3 Mt in 2011 but is projected to decline to 1.62 Mt in 2022, about 70.5% of the peak. This decline could be due to multiple factors such as changes in domestic demand, increased import dependency or rising production costs. Other important producers, such as Brazil and China, have seen production increases in recent years, but a decline in India could impact the global supply balance. Overall, agricultural oil production has been characterized by changes in regional economic conditions, policy changes, and climate change.
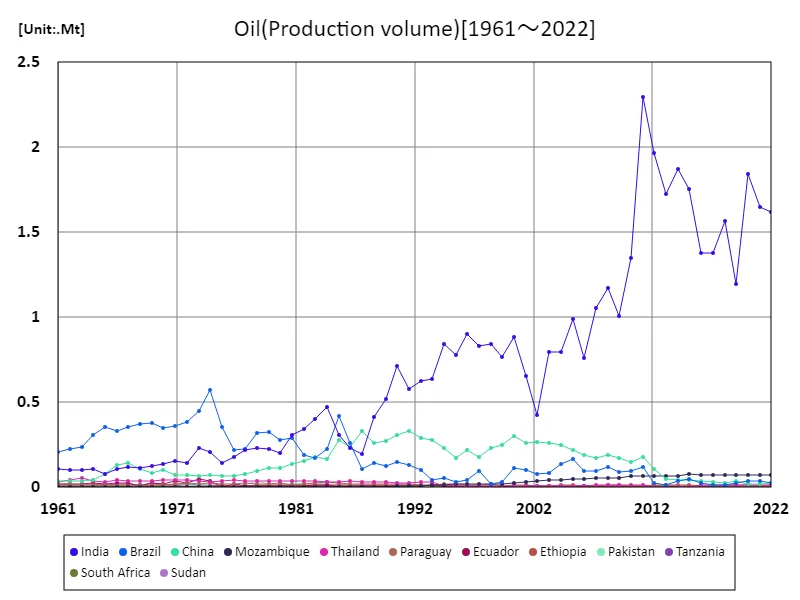
The maximum is 2.3Mt[2011] of India, and the current value is about 70.5%
Oil production (latest year, world countries)
Based on 2022 data, global production of crop oils totaled 1.83 Mt. India is the largest producer, producing 1.62 Mt, a significant proportion of the total. The average production volume was 43.6kt, showing that India’s production volume stands out. Historically, large producing countries such as India have had a major influence on the market, with increasing demand, particularly in Asia, driving up production. Additionally, technological innovation, policy changes and the effects of climate change play a major role in production volumes. Overall, agricultural oil production shows different trends from region to region, with the movements of major producing countries having a significant impact on the global supply balance.
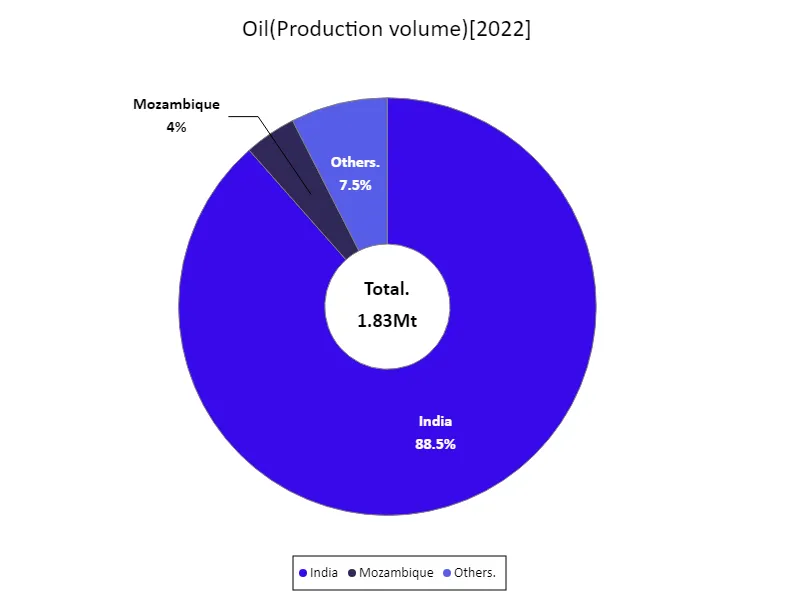
The maximum is 1.62Mt of India, the average is 43.6kt, and the total is 1.83Mt
Margarine production (worldwide)
As per 2021 data, the United States remains the largest producer of agricultural margarine in the world, recording 5.04 Mt. This is the largest amount of agricultural margarine produced, demonstrating the influence of the United States. America’s large-scale production is likely supported by high domestic demand, advanced manufacturing technologies, and a large agricultural production base. Looking back at historical data, the production of agricultural margarine is mainly concentrated in developed countries, with European countries playing a major role besides the United States. However, in recent years, due to growing health consciousness and changes in eating habits, margarine consumption is on the decline in some countries. As a result, margarine production volume is also fluctuating. While the US maintains its position as the largest producer, global trends are influenced by plant-based alternatives and a growing health consciousness. Therefore, it can be said that trends in margarine production and consumption are closely related to changes in consumer health consciousness and food culture.
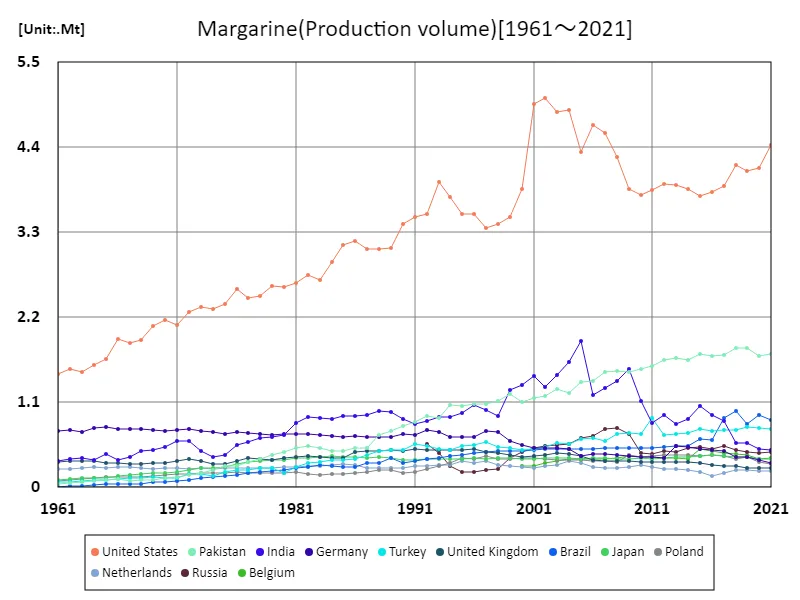
The maximum is 5.04Mt[2002] of United States, and the current value is about 87.9%
Margarine production volume (latest year, world wide)
As per 2021 data, the total global production of crop margarine reached 14.4Mt, of which the United States is the largest producer accounting for 4.43Mt. This figure indicates that the United States plays a leading role in the market. The average production was 154kt, with the US production dominating the picture. Looking at historical trends, crop margarine production has been concentrated primarily in developed countries, with large producers such as the United States leading the market. In the United States in particular, high production volumes are maintained due to large manufacturing facilities and efficient production processes. However, due to growing health consciousness and changes in consumers’ eating habits, the demand for margarine is beginning to change. This has resulted in reduced production in some regions while demand remains stable in others. Overall, while crop margarine production shows different trends depending on the region, major producing countries such as the United States occupy an important position in the market and have a significant impact on the global supply balance.
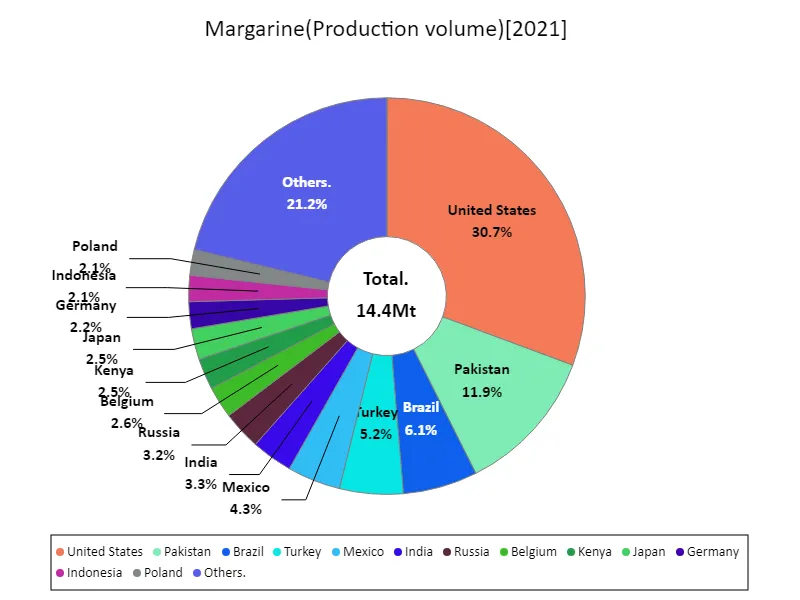
The maximum is 4.43Mt of United States, the average is 155kt, and the total is 14.4Mt
Main data
| Production(Oil, Production volume) [Mt] | ||||||||||
|---|---|---|---|---|---|---|---|---|---|---|
| World | Asia | Lower-middle-income countries | Southern Asia | India | Net Food Importing Developing Countries | Least Developed Countries | Africa | Low Income Food Deficit Countries | Eastern Africa | |
| 2022 | 1.83 | 1.68 | 1.66 | 1.62 | 1.62 | 0.12 | 0.11 | 0.11 | 0.1 | 0.09 |
| 2021 | 1.86 | 1.71 | 1.68 | 1.65 | 1.65 | 0.12 | 0.11 | 0.11 | 0.1 | 0.09 |
| 2020 | 2.05 | 1.9 | 1.88 | 1.84 | 1.84 | 0.12 | 0.11 | 0.11 | 0.1 | 0.09 |
| 2019 | 1.42 | 1.27 | 1.23 | 1.2 | 1.2 | 0.12 | 0.11 | 0.11 | 0.1 | 0.09 |
| 2018 | 1.77 | 1.63 | 1.6 | 1.57 | 1.57 | 0.12 | 0.11 | 0.11 | 0.1 | 0.1 |
| 2017 | 1.58 | 1.44 | 1.41 | 1.38 | 1.38 | 0.11 | 0.11 | 0.1 | 0.1 | 0.09 |
| 2016 | 1.6 | 1.45 | 1.41 | 1.38 | 1.38 | 0.11 | 0.11 | 0.1 | 0.1 | 0.09 |
| 2015 | 1.99 | 1.82 | 1.79 | 1.75 | 1.75 | 0.12 | 0.11 | 0.11 | 0.1 | 0.1 |
| 2014 | 2.09 | 1.94 | 1.9 | 1.87 | 1.87 | 0.11 | 0.11 | 0.1 | 0.09 | 0.09 |
| 2013 | 1.94 | 1.8 | 1.76 | 1.73 | 1.73 | 0.12 | 0.11 | 0.1 | 0.1 | 0.09 |
| 2012 | 2.25 | 2.1 | 2 | 1.97 | 1.96 | 0.12 | 0.11 | 0.1 | 0.09 | 0.09 |
| 2011 | 2.74 | 2.51 | 2.33 | 2.3 | 2.3 | 0.11 | 0.1 | 0.1 | 0.09 | 0.09 |
| 2010 | 1.74 | 1.54 | 1.39 | 1.35 | 1.35 | 0.11 | 0.1 | 0.1 | 0.09 | 0.08 |
| 2009 | 1.41 | 1.22 | 1.05 | 1.01 | 1.01 | 0.1 | 0.1 | 0.08 | 0.08 | 0.07 |
| 2008 | 1.62 | 1.4 | 1.21 | 1.18 | 1.17 | 0.1 | 0.09 | 0.08 | 0.07 | 0.07 |
| 2007 | 1.45 | 1.26 | 1.09 | 1.06 | 1.05 | 0.09 | 0.09 | 0.08 | 0.07 | 0.07 |
| 2006 | 1.17 | 0.98 | 0.79 | 0.77 | 0.76 | 0.08 | 0.08 | 0.08 | 0.07 | 0.06 |
| 2005 | 1.5 | 1.24 | 1.02 | 0.99 | 0.99 | 0.08 | 0.08 | 0.07 | 0.07 | 0.06 |
| 2004 | 1.29 | 1.07 | 0.82 | 0.8 | 0.79 | 0.08 | 0.07 | 0.07 | 0.06 | 0.06 |
| 2003 | 1.25 | 1.08 | 0.82 | 0.8 | 0.8 | 0.07 | 0.07 | 0.07 | 0.06 | 0.06 |
| 2002 | 0.87 | 0.72 | 0.45 | 0.43 | 0.43 | 0.06 | 0.06 | 0.06 | 0.05 | 0.05 |
| 2001 | 1.12 | 0.94 | 0.68 | 0.65 | 0.65 | 0.06 | 0.05 | 0.06 | 0.05 | 0.05 |
| 2000 | 1.39 | 1.21 | 0.91 | 0.88 | 0.88 | 0.05 | 0.05 | 0.05 | 0.04 | 0.04 |
| 1999 | 1.14 | 1.04 | 0.79 | 0.77 | 0.77 | 0.05 | 0.04 | 0.05 | 0.04 | 0.04 |
| 1998 | 1.19 | 1.1 | 0.87 | 0.85 | 0.84 | 0.05 | 0.04 | 0.05 | 0.04 | 0.04 |
| 1997 | 1.2 | 1.04 | 0.86 | 0.84 | 0.83 | 0.05 | 0.04 | 0.04 | 0.04 | 0.03 |
| 1996 | 1.26 | 1.15 | 0.94 | 0.91 | 0.9 | 0.05 | 0.04 | 0.04 | 0.04 | 0.03 |
| 1995 | 1.09 | 0.98 | 0.81 | 0.79 | 0.78 | 0.05 | 0.04 | 0.04 | 0.04 | 0.03 |
| 1994 | 1.23 | 1.1 | 0.88 | 0.85 | 0.85 | 0.05 | 0.04 | 0.04 | 0.04 | 0.03 |
| 1993 | 1.09 | 0.97 | 0.67 | 0.64 | 0.63 | 0.05 | 0.04 | 0.04 | 0.04 | 0.03 |
| 1992 | 1.14 | 0.97 | 0.66 | 0.63 | 0.62 | 0.05 | 0.04 | 0.05 | 0.04 | 0.03 |
| 1991 | 1.18 | 0.95 | 0.61 | 0.58 | 0.58 | 0.05 | 0.04 | 0.05 | 0.04 | 0.03 |
| 1990 | 1.36 | 1.08 | 0.76 | 0.73 | 0.72 | 0.06 | 0.05 | 0.05 | 0.04 | 0.03 |
| 1989 | 1.09 | 0.84 | 0.56 | 0.53 | 0.52 | 0.06 | 0.04 | 0.04 | 0.04 | 0.03 |
| 1988 | 1.01 | 0.73 | 0.45 | 0.42 | 0.42 | 0.05 | 0.04 | 0.04 | 0.03 | 0.03 |
| 1987 | 0.81 | 0.57 | 0.22 | 0.2 | 0.2 | 0.04 | 0.03 | 0.04 | 0.03 | 0.03 |
| 1986 | 0.94 | 0.53 | 0.27 | 0.24 | 0.23 | 0.05 | 0.03 | 0.04 | 0.03 | 0.02 |
| 1985 | 1.22 | 0.67 | 0.37 | 0.33 | 0.31 | 0.06 | 0.03 | 0.04 | 0.03 | 0.02 |
| 1984 | 1.09 | 0.71 | 0.53 | 0.49 | 0.47 | 0.06 | 0.03 | 0.04 | 0.03 | 0.02 |
| 1983 | 0.98 | 0.66 | 0.46 | 0.43 | 0.4 | 0.06 | 0.03 | 0.04 | 0.03 | 0.02 |
| 1982 | 0.95 | 0.58 | 0.41 | 0.37 | 0.34 | 0.06 | 0.03 | 0.04 | 0.03 | 0.02 |
| 1981 | 0.93 | 0.53 | 0.37 | 0.33 | 0.31 | 0.05 | 0.03 | 0.04 | 0.03 | 0.02 |
| 1980 | 0.78 | 0.39 | 0.26 | 0.22 | 0.2 | 0.05 | 0.03 | 0.04 | 0.03 | 0.02 |
| 1979 | 0.88 | 0.41 | 0.27 | 0.25 | 0.23 | 0.05 | 0.03 | 0.03 | 0.03 | 0.02 |
| 1978 | 0.85 | 0.42 | 0.29 | 0.27 | 0.23 | 0.06 | 0.03 | 0.03 | 0.03 | 0.02 |
| 1977 | 0.72 | 0.37 | 0.27 | 0.23 | 0.22 | 0.04 | 0.03 | 0.03 | 0.03 | 0.02 |
| 1976 | 0.66 | 0.31 | 0.21 | 0.19 | 0.18 | 0.05 | 0.04 | 0.04 | 0.03 | 0.02 |
| 1975 | 0.79 | 0.28 | 0.18 | 0.16 | 0.14 | 0.06 | 0.05 | 0.05 | 0.04 | 0.03 |
| 1974 | 1.12 | 0.34 | 0.25 | 0.23 | 0.21 | 0.05 | 0.04 | 0.04 | 0.04 | 0.02 |
| 1973 | 1.03 | 0.36 | 0.27 | 0.25 | 0.23 | 0.05 | 0.04 | 0.04 | 0.04 | 0.02 |
| 1972 | 0.84 | 0.29 | 0.19 | 0.17 | 0.15 | 0.06 | 0.04 | 0.05 | 0.04 | 0.03 |
| 1971 | 0.86 | 0.3 | 0.2 | 0.18 | 0.15 | 0.07 | 0.05 | 0.06 | 0.05 | 0.03 |
| 1970 | 0.84 | 0.31 | 0.18 | 0.16 | 0.14 | 0.06 | 0.05 | 0.05 | 0.05 | 0.03 |
| 1969 | 0.87 | 0.27 | 0.16 | 0.14 | 0.12 | 0.07 | 0.05 | 0.06 | 0.05 | 0.03 |
| 1968 | 0.89 | 0.29 | 0.16 | 0.14 | 0.12 | 0.07 | 0.05 | 0.06 | 0.05 | 0.04 |
| 1967 | 0.91 | 0.33 | 0.17 | 0.14 | 0.12 | 0.08 | 0.06 | 0.07 | 0.06 | 0.03 |
| 1966 | 0.88 | 0.31 | 0.17 | 0.13 | 0.11 | 0.09 | 0.06 | 0.07 | 0.06 | 0.04 |
| 1965 | 0.8 | 0.22 | 0.13 | 0.1 | 0.08 | 0.07 | 0.05 | 0.07 | 0.05 | 0.04 |
| 1964 | 0.74 | 0.22 | 0.15 | 0.13 | 0.11 | 0.06 | 0.04 | 0.06 | 0.04 | 0.03 |
| 1963 | 0.66 | 0.22 | 0.15 | 0.12 | 0.1 | 0.07 | 0.05 | 0.06 | 0.04 | 0.03 |
| 1962 | 0.62 | 0.21 | 0.14 | 0.12 | 0.1 | 0.06 | 0.04 | 0.07 | 0.04 | 0.03 |
| 1961 | 0.58 | 0.2 | 0.15 | 0.12 | 0.11 | 0.06 | 0.04 | 0.05 | 0.04 | 0.03 |


Comments