Abstract
In terms of wool production, data for 2022 shows that China has the largest production with 356kt. Historical trends show that Australia and New Zealand are also important producers, with Australia in particular known for producing high-quality Merino wool. However, China’s production has increased rapidly in recent years, and its presence in the global market is growing. Wool production varies by region, with Australia and New Zealand relying on large-scale livestock farming on vast pastures, while China has a more diversified agricultural landscape. On the other hand, compared to cotton, wool production is highly dependent on climate and land conditions, meaning that regional characteristics are more pronounced. Cotton is primarily produced in warm climates through large-scale farming, whereas wool requires the right climate and large areas of grassland. The increase in China’s wool production can be attributed to growing domestic demand and improvements in production technology.
Wool production (worldwide)
Looking back at wool production data from 1961 to 2022, Australia’s peak in 1990 of 1.1Mt stands out. During this time, Australia was the world’s largest wool producer and dominated the production of high quality Merino wool. However, production has declined significantly in the following decades, falling to a level equivalent to 29.8% of its peak in 2022. Factors behind this decline include increased agricultural efficiency, rising feed costs and the effects of climate change. In recent years, China and New Zealand have played important roles in wool production, with China experiencing rapid growth. This is changing the wool market map, but Australian wool production still has a strong reputation for quality. It is also notable that global wool production is on the decline, which is having an impact on prices and market trends.
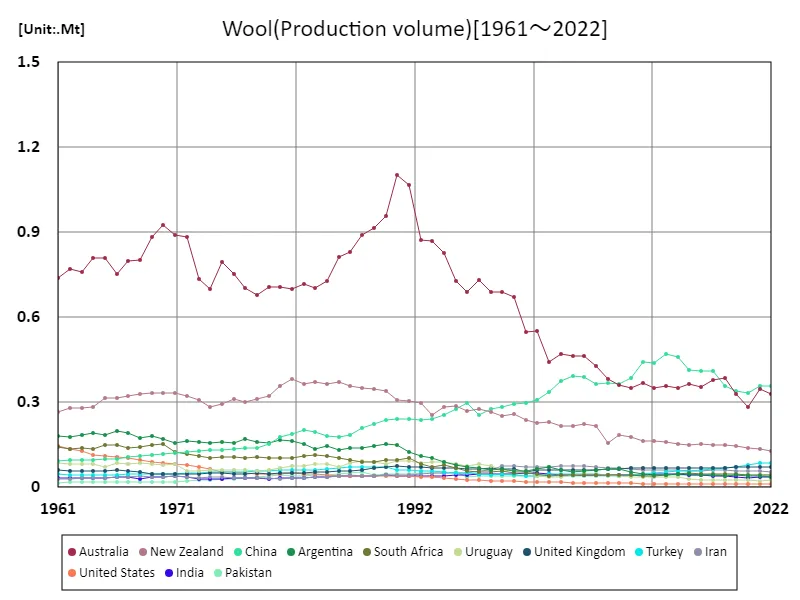
The maximum is 1.1Mt[1990] of Australia, and the current value is about 29.8%
Wool production (latest year, world wide)
Wool production data for 2022 shows that China will be the largest producer with 356kt, with an overall total of 1.76Mt and an average of 24.4kt. In recent years, China has rapidly expanded its wool production due to increasing domestic demand and improving production technologies. China’s rise has seen it assume an important position second only to the traditional major producers Australia and New Zealand. Australia was once the world’s largest producer, but production is now declining and its overall share is shrinking. New Zealand has also maintained stable production, but the scale of growth has not been as rapid as China’s. Overall, wool production varies greatly from region to region and is primarily dependent on climate and pasture conditions. Furthermore, wool market trends are also influenced by external factors such as the trend for eco-fashion and competition from synthetic fibres, so future developments will require close monitoring.
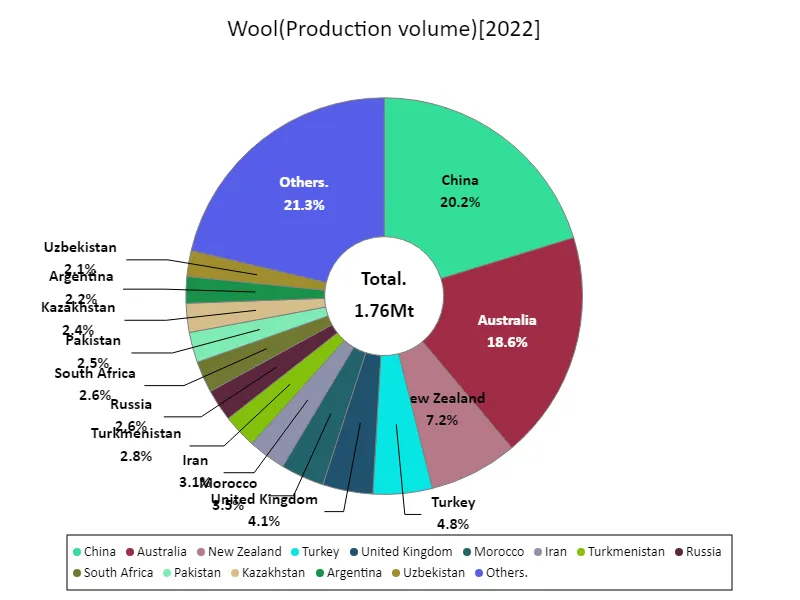
The maximum is 356kt of China, the average is 24.4kt, and the total is 1.76Mt
Cotton production (worldwide)
Cotton production data for 2021 positions China as the largest producer with 7.62 Mt. In cotton production, China leads the world due to its size and improved production technology, reflecting past trends. In the past, India and the United States were also seen as major producers, but China’s rapid growth is due to increasing domestic demand and the establishment of an efficient production system. The United States and India remain important producers, with the United States in particular known for producing high-quality cotton, but in recent years China has come to dominate the market due to its overwhelming production. Cotton production relies primarily on warm climatic conditions, so the selection of production sites and technological innovation directly affect production volume. Additionally, the cotton industry is also undergoing change as environmental concerns and sustainability become more important. These factors are shaping trends in the cotton market, which will continue to be influenced by national production strategies and shifts in international demand.
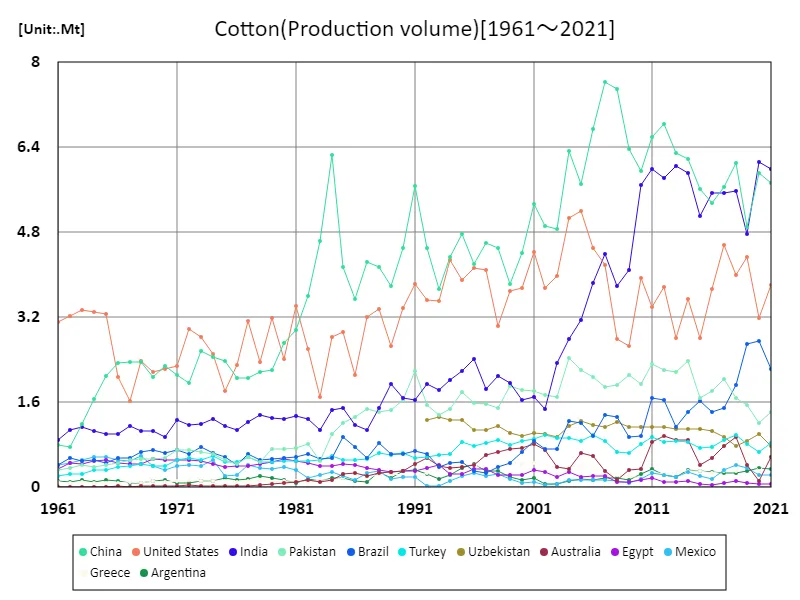
The maximum is 7.62Mt[2007] of China, and the current value is about 75.2%
Cotton production (latest year, world wide)
Cotton production data for 2021 shows that India was the largest producer with 5.99 Mt, with overall production at 25.4 Mt and an average of 288 kt. Cotton production in India has been historically important and is supported by vast cultivated areas and stable climatic conditions. Over the past few decades, India has increased production through technological innovation and improved agricultural policies, giving it greater influence in global markets. Meanwhile, the United States and China are also major producers, and the United States in particular is known for producing high-quality cotton, but India is showing notable growth. Cotton production is primarily dependent on warm climates, with different cultivation methods and techniques being adopted in different regions. In recent years, sustainability and environmental awareness have become important themes, and there is a demand for advances in agricultural technology and cost reductions. Overall, India’s growing cotton production reflects shifts in international demand and improvements in production techniques, a trend that is likely to continue to have a significant impact on the market.
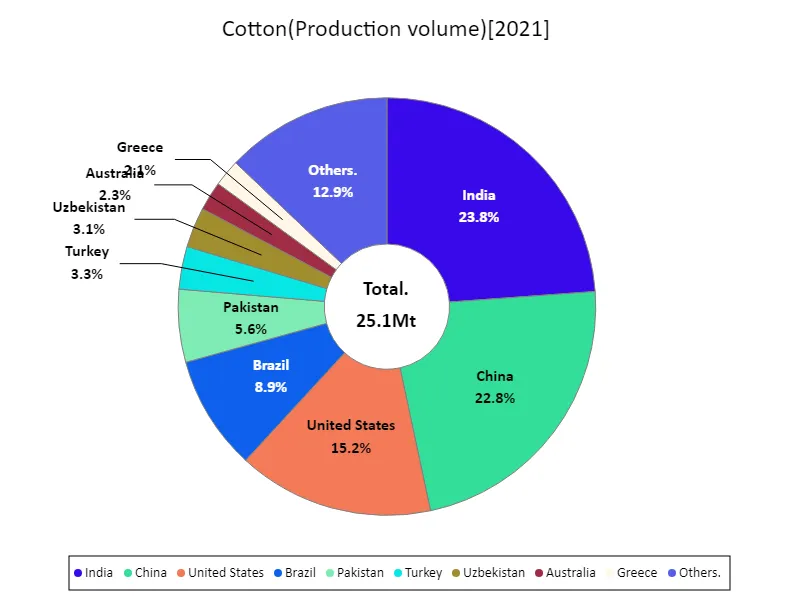
The maximum is 5.99Mt of India, the average is 289kt, and the total is 25.1Mt
Main data
| Production(Wool, Production volume) [Mt] | ||||||||||
|---|---|---|---|---|---|---|---|---|---|---|
| World | Asia | Upper-middle-income countries | High-income countries | Oceania | Eastern Asia | China | Lower-middle-income countries | Australia | Land Locked Developing Countries | |
| 2022 | 1.76 | 0.86 | 0.76 | 0.59 | 0.45 | 0.37 | 0.36 | 0.35 | 0.33 | 0.21 |
| 2021 | 1.81 | 0.87 | 0.77 | 0.64 | 0.48 | 0.37 | 0.36 | 0.35 | 0.35 | 0.21 |
| 2020 | 1.73 | 0.83 | 0.74 | 0.58 | 0.42 | 0.35 | 0.33 | 0.35 | 0.28 | 0.21 |
| 2019 | 1.77 | 0.83 | 0.74 | 0.61 | 0.47 | 0.36 | 0.34 | 0.36 | 0.33 | 0.2 |
| 2018 | 1.86 | 0.85 | 0.76 | 0.67 | 0.53 | 0.37 | 0.36 | 0.36 | 0.39 | 0.2 |
| 2017 | 1.99 | 0.9 | 0.81 | 0.76 | 0.53 | 0.43 | 0.41 | 0.37 | 0.38 | 0.2 |
| 2016 | 1.98 | 0.91 | 0.82 | 0.74 | 0.51 | 0.43 | 0.41 | 0.37 | 0.35 | 0.21 |
| 2015 | 1.98 | 0.9 | 0.82 | 0.75 | 0.51 | 0.43 | 0.41 | 0.36 | 0.36 | 0.2 |
| 2014 | 2.03 | 0.95 | 0.86 | 0.74 | 0.5 | 0.48 | 0.46 | 0.37 | 0.35 | 0.2 |
| 2013 | 2.05 | 0.96 | 0.87 | 0.77 | 0.52 | 0.49 | 0.47 | 0.36 | 0.36 | 0.19 |
| 2012 | 2.02 | 0.92 | 0.83 | 0.78 | 0.52 | 0.45 | 0.44 | 0.35 | 0.35 | 0.2 |
| 2011 | 2.09 | 0.92 | 0.83 | 0.8 | 0.53 | 0.46 | 0.44 | 0.35 | 0.37 | 0.19 |
| 2010 | 2.02 | 0.85 | 0.78 | 0.79 | 0.53 | 0.4 | 0.39 | 0.34 | 0.35 | 0.19 |
| 2009 | 2.04 | 0.82 | 0.76 | 0.82 | 0.55 | 0.39 | 0.36 | 0.35 | 0.36 | 0.2 |
| 2008 | 2.05 | 0.84 | 0.77 | 0.82 | 0.54 | 0.39 | 0.37 | 0.34 | 0.38 | 0.19 |
| 2007 | 2.16 | 0.85 | 0.76 | 0.93 | 0.65 | 0.38 | 0.36 | 0.34 | 0.43 | 0.18 |
| 2006 | 2.2 | 0.86 | 0.77 | 0.97 | 0.69 | 0.4 | 0.39 | 0.34 | 0.46 | 0.17 |
| 2005 | 2.18 | 0.86 | 0.77 | 0.95 | 0.68 | 0.41 | 0.39 | 0.33 | 0.46 | 0.17 |
| 2004 | 2.15 | 0.82 | 0.75 | 0.96 | 0.69 | 0.39 | 0.37 | 0.33 | 0.47 | 0.16 |
| 2003 | 2.09 | 0.77 | 0.71 | 0.94 | 0.67 | 0.35 | 0.34 | 0.32 | 0.44 | 0.16 |
| 2002 | 2.16 | 0.73 | 0.67 | 1.06 | 0.78 | 0.32 | 0.31 | 0.32 | 0.55 | 0.15 |
| 2001 | 2.16 | 0.72 | 0.65 | 1.08 | 0.78 | 0.32 | 0.3 | 0.32 | 0.55 | 0.16 |
| 2000 | 2.32 | 0.72 | 0.64 | 1.24 | 0.93 | 0.31 | 0.29 | 0.32 | 0.67 | 0.16 |
| 1999 | 2.32 | 0.7 | 0.65 | 1.25 | 0.94 | 0.3 | 0.28 | 0.31 | 0.69 | 0.16 |
| 1998 | 2.34 | 0.68 | 0.64 | 1.29 | 0.96 | 0.3 | 0.28 | 0.3 | 0.69 | 0.15 |
| 1997 | 2.4 | 0.66 | 0.65 | 1.35 | 1.01 | 0.27 | 0.26 | 0.3 | 0.73 | 0.16 |
| 1996 | 2.42 | 0.7 | 0.72 | 1.3 | 0.96 | 0.32 | 0.3 | 0.3 | 0.69 | 0.17 |
| 1995 | 2.57 | 0.73 | 0.77 | 1.38 | 1.02 | 0.3 | 0.28 | 0.33 | 0.73 | 0.2 |
| 1994 | 2.73 | 0.73 | 0.81 | 1.48 | 1.11 | 0.27 | 0.25 | 0.34 | 0.83 | 0.22 |
| 1993 | 2.81 | 0.74 | 0.87 | 1.5 | 1.12 | 0.26 | 0.24 | 0.35 | 0.87 | 0.25 |
| 1992 | 2.92 | 0.76 | 0.92 | 1.55 | 1.17 | 0.26 | 0.24 | 0.35 | 0.87 | 0.25 |
| 1991 | 3.22 | 0.56 | 1.1 | 1.78 | 1.37 | 0.26 | 0.24 | 0.25 | 1.07 | 0.05 |
| 1990 | 3.35 | 0.56 | 1.17 | 1.84 | 1.41 | 0.26 | 0.24 | 0.26 | 1.1 | 0.05 |
| 1989 | 3.22 | 0.56 | 1.17 | 1.72 | 1.3 | 0.26 | 0.24 | 0.25 | 0.96 | 0.05 |
| 1988 | 3.15 | 0.53 | 1.15 | 1.68 | 1.26 | 0.24 | 0.22 | 0.24 | 0.92 | 0.05 |
| 1987 | 3.08 | 0.52 | 1.11 | 1.66 | 1.24 | 0.23 | 0.21 | 0.25 | 0.89 | 0.04 |
| 1986 | 3.02 | 0.49 | 1.11 | 1.59 | 1.19 | 0.2 | 0.19 | 0.24 | 0.83 | 0.04 |
| 1985 | 2.95 | 0.48 | 1.07 | 1.58 | 1.19 | 0.2 | 0.18 | 0.24 | 0.81 | 0.05 |
| 1984 | 2.9 | 0.48 | 1.11 | 1.49 | 1.09 | 0.2 | 0.18 | 0.22 | 0.73 | 0.05 |
| 1983 | 2.87 | 0.49 | 1.11 | 1.47 | 1.07 | 0.21 | 0.19 | 0.21 | 0.7 | 0.05 |
| 1982 | 2.86 | 0.49 | 1.12 | 1.46 | 1.08 | 0.22 | 0.2 | 0.2 | 0.72 | 0.06 |
| 1981 | 2.85 | 0.46 | 1.12 | 1.46 | 1.08 | 0.21 | 0.19 | 0.2 | 0.7 | 0.06 |
| 1980 | 2.79 | 0.44 | 1.09 | 1.43 | 1.07 | 0.2 | 0.18 | 0.19 | 0.71 | 0.06 |
| 1979 | 2.73 | 0.41 | 1.08 | 1.39 | 1.03 | 0.17 | 0.15 | 0.19 | 0.71 | 0.06 |
| 1978 | 2.65 | 0.39 | 1.06 | 1.34 | 0.99 | 0.16 | 0.14 | 0.19 | 0.68 | 0.06 |
| 1977 | 2.67 | 0.39 | 1.07 | 1.35 | 1.01 | 0.16 | 0.14 | 0.18 | 0.7 | 0.06 |
| 1976 | 2.69 | 0.38 | 1.03 | 1.41 | 1.07 | 0.15 | 0.14 | 0.19 | 0.75 | 0.06 |
| 1975 | 2.74 | 0.38 | 1.06 | 1.42 | 1.09 | 0.15 | 0.13 | 0.18 | 0.79 | 0.06 |
| 1974 | 2.63 | 0.37 | 1.05 | 1.34 | 0.99 | 0.15 | 0.13 | 0.18 | 0.7 | 0.06 |
| 1973 | 2.66 | 0.36 | 1.02 | 1.4 | 1.04 | 0.15 | 0.13 | 0.18 | 0.74 | 0.05 |
| 1972 | 2.81 | 0.36 | 1.01 | 1.56 | 1.2 | 0.14 | 0.13 | 0.18 | 0.88 | 0.05 |
| 1971 | 2.87 | 0.36 | 1.02 | 1.61 | 1.22 | 0.14 | 0.12 | 0.18 | 0.89 | 0.06 |
| 1970 | 2.93 | 0.35 | 1.04 | 1.65 | 1.26 | 0.14 | 0.12 | 0.17 | 0.93 | 0.06 |
| 1969 | 2.88 | 0.35 | 1.01 | 1.62 | 1.22 | 0.13 | 0.11 | 0.17 | 0.88 | 0.06 |
| 1968 | 2.82 | 0.34 | 1.02 | 1.56 | 1.13 | 0.13 | 0.11 | 0.17 | 0.8 | 0.06 |
| 1967 | 2.8 | 0.34 | 1.01 | 1.56 | 1.12 | 0.13 | 0.11 | 0.17 | 0.8 | 0.06 |
| 1966 | 2.74 | 0.33 | 0.99 | 1.52 | 1.07 | 0.12 | 0.1 | 0.17 | 0.75 | 0.06 |
| 1965 | 2.73 | 0.32 | 0.96 | 1.56 | 1.12 | 0.12 | 0.1 | 0.16 | 0.81 | 0.06 |
| 1964 | 2.68 | 0.32 | 0.93 | 1.54 | 1.09 | 0.12 | 0.1 | 0.15 | 0.81 | 0.05 |
| 1963 | 2.65 | 0.31 | 0.95 | 1.49 | 1.04 | 0.11 | 0.1 | 0.15 | 0.76 | 0.05 |
| 1962 | 2.65 | 0.3 | 0.94 | 1.52 | 1.05 | 0.11 | 0.1 | 0.15 | 0.77 | 0.05 |
| 1961 | 2.62 | 0.3 | 0.95 | 1.48 | 1 | 0.11 | 0.09 | 0.14 | 0.74 | 0.05 |


Comments