
Abstract
In 2022, China led global vegetable production with 1.43 million tons, continuing a long-standing trend of dominance. Over the past decades, China’s agricultural sector has significantly expanded due to favorable policies, large-scale land cultivation, and technological advancements. China’s vast population and demand for diverse vegetables further drive this growth. Additionally, the focus on self-sufficiency in food production and export potential has shaped its agricultural strategies. Other major producers like India and the U.S. also contribute substantially but lag behind China in vegetable output.
Vegetable production (worldwide)
From 1961 to 2022, China has been the global leader in vegetable production, reaching a peak of 1.46 million tons in 2021, with 2022 at 97.8% of this peak. This trend highlights China’s consistent growth in vegetable output, driven by agricultural reforms, technological advancements, and its large, diverse population. The expansion of vegetable farming has been supported by government policies aimed at ensuring food security and boosting exports. While other countries like India and the U.S. also contribute significantly, China’s dominance remains unmatched, reflecting both internal demand and global agricultural leadership.
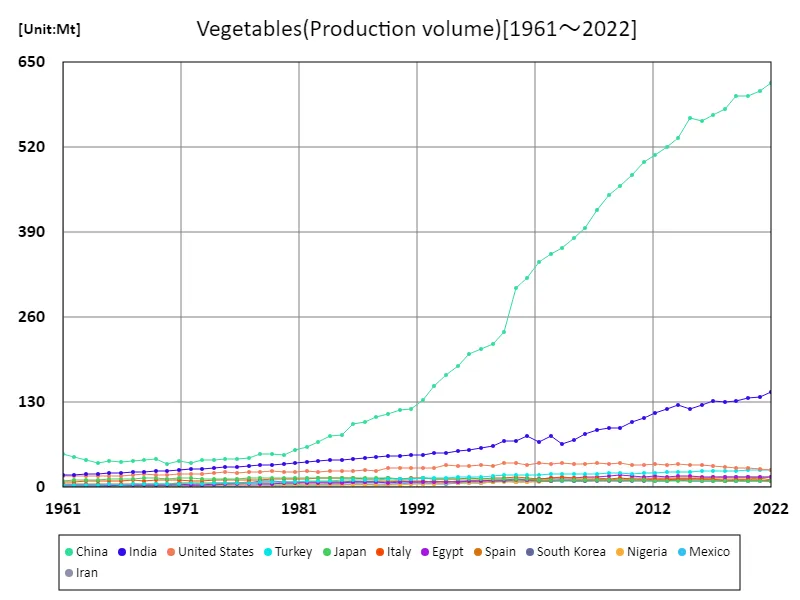
The maximum is the latest one, 619Mt of China
Vegetable production (latest year, countries around the world)
As of 2022, China remains the global leader in vegetable crop production, reaching 1.43 million tons. This output reflects the country’s dominant role in global agriculture, driven by large-scale cultivation, advanced farming techniques, and government support for food security. With an average of 41.3 million tons and a total of 7.94 million tons globally, vegetable production has seen consistent growth over the decades. China’s agricultural sector continues to expand, driven by both domestic demand and export potential. Other major producers, such as India and the U.S., also contribute significantly but trail behind China.
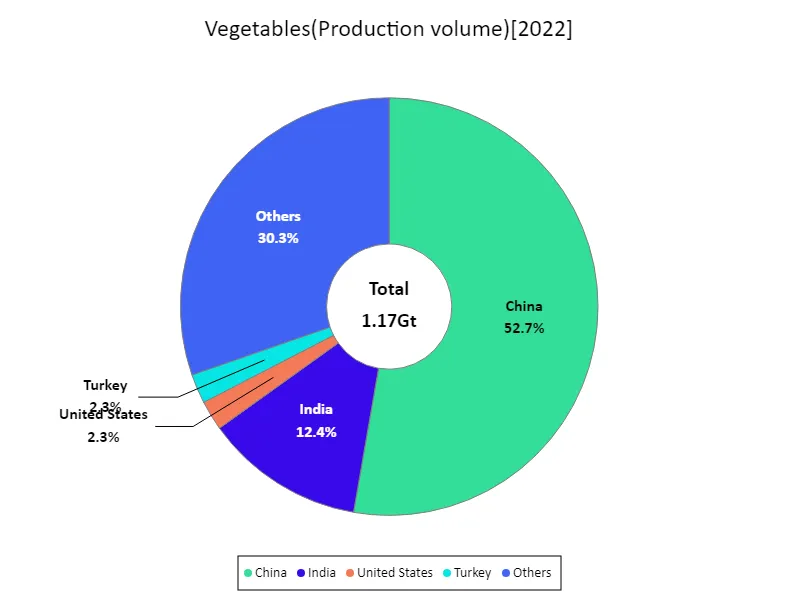
全体の最大はChinaの619Mtで、平均は6.11Mt、合計は1.17Gt
Vegetable production (continent)
In 2022, Asia reached its highest vegetable crop production value of 4.72 million tons, underscoring the region’s dominant role in global agriculture. Driven by countries like China and India, Asia has seen consistent growth in vegetable output, fueled by favorable climates, large populations, and government policies supporting food security and agricultural development. The region’s expansion in vegetable farming aligns with rising domestic demand and growing export potential. While other regions also contribute, Asia’s leadership in vegetable production continues to shape global agricultural trends.
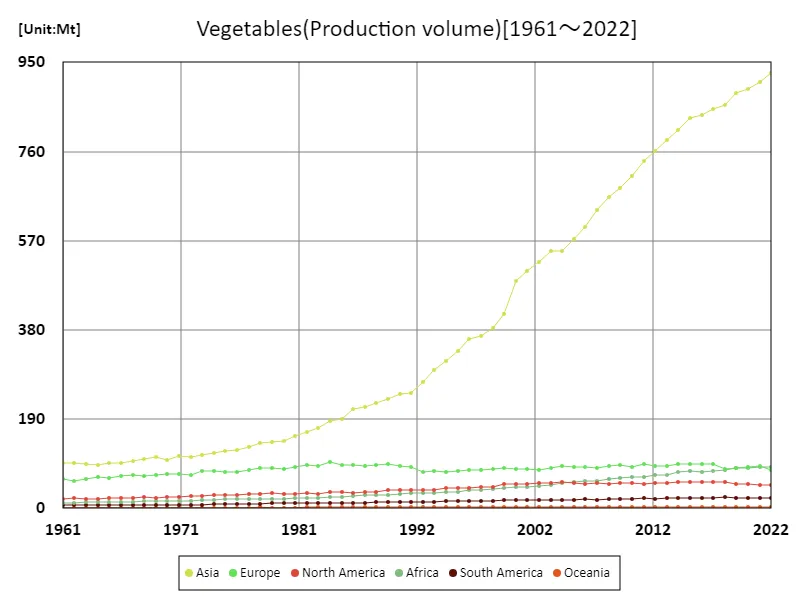
The maximum is the latest one, 927Mt of Asia
Vegetable production (latest year, continent)
In 2022, Asia led global vegetable crop production with a peak of 4.72 million tons, contributing significantly to the total global output of 7.98 million tons. The region’s average production stood at 1.33 million tons, reflecting its central role in global agriculture. Asia’s growth is driven by countries like China and India, where large-scale farming, favorable climates, and increasing demand for vegetables support expansion. This trend highlights Asia’s agricultural dominance, driven by both domestic consumption and export opportunities, shaping global vegetable production patterns.
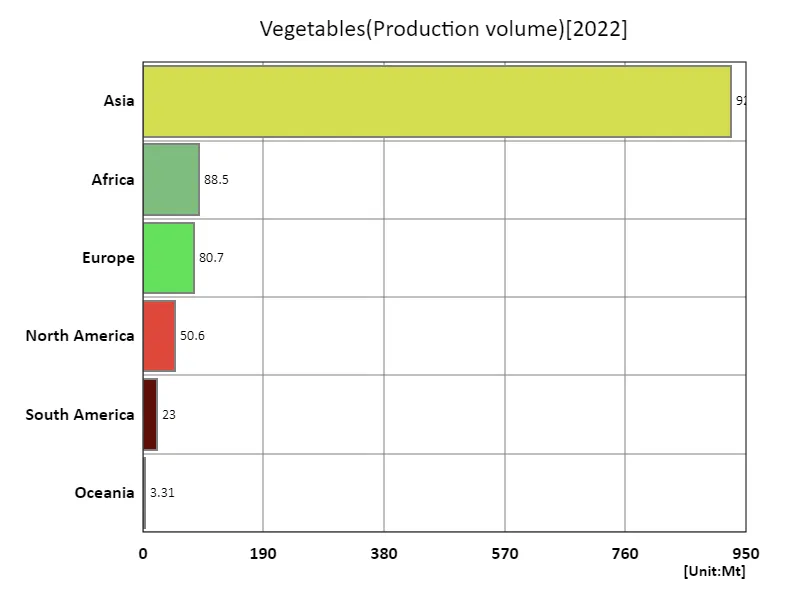
The maximum is 927Mt of Asia, the average is 196Mt, and the total is 1.17Gt
Main data
| Production(Vegetables, Production volume, t) [Gt] | ||||||||||
|---|---|---|---|---|---|---|---|---|---|---|
| World | Asia | Upper-middle-income countries | Eastern Asia | China | Lower-middle-income countries | Southern Asia | India | High-income countries | Net Food Importing Developing Countries | |
| 2022 | 1.17 | 0.93 | 0.73 | 0.64 | 0.62 | 0.3 | 0.18 | 0.15 | 0.12 | 0.09 |
| 2021 | 1.16 | 0.91 | 0.72 | 0.63 | 0.61 | 0.29 | 0.17 | 0.14 | 0.12 | 0.09 |
| 2020 | 1.15 | 0.89 | 0.71 | 0.62 | 0.6 | 0.28 | 0.17 | 0.14 | 0.12 | 0.09 |
| 2019 | 1.14 | 0.88 | 0.71 | 0.62 | 0.6 | 0.28 | 0.16 | 0.13 | 0.12 | 0.09 |
| 2018 | 1.11 | 0.86 | 0.69 | 0.6 | 0.58 | 0.27 | 0.16 | 0.13 | 0.12 | 0.09 |
| 2017 | 1.11 | 0.85 | 0.68 | 0.59 | 0.57 | 0.27 | 0.16 | 0.13 | 0.13 | 0.09 |
| 2016 | 1.09 | 0.84 | 0.67 | 0.58 | 0.56 | 0.27 | 0.16 | 0.13 | 0.13 | 0.08 |
| 2015 | 1.09 | 0.83 | 0.67 | 0.59 | 0.56 | 0.26 | 0.15 | 0.12 | 0.13 | 0.08 |
| 2014 | 1.06 | 0.81 | 0.64 | 0.56 | 0.53 | 0.27 | 0.15 | 0.13 | 0.13 | 0.08 |
| 2013 | 1.02 | 0.78 | 0.62 | 0.54 | 0.52 | 0.25 | 0.15 | 0.12 | 0.13 | 0.08 |
| 2012 | 1 | 0.76 | 0.61 | 0.53 | 0.51 | 0.24 | 0.14 | 0.11 | 0.13 | 0.08 |
| 2011 | 0.98 | 0.74 | 0.6 | 0.52 | 0.5 | 0.23 | 0.13 | 0.11 | 0.13 | 0.07 |
| 2010 | 0.94 | 0.71 | 0.57 | 0.5 | 0.48 | 0.22 | 0.13 | 0.1 | 0.13 | 0.07 |
| 2009 | 0.92 | 0.68 | 0.56 | 0.49 | 0.46 | 0.2 | 0.12 | 0.09 | 0.14 | 0.07 |
| 2008 | 0.89 | 0.66 | 0.54 | 0.47 | 0.45 | 0.2 | 0.11 | 0.09 | 0.13 | 0.07 |
| 2007 | 0.86 | 0.64 | 0.51 | 0.45 | 0.42 | 0.19 | 0.11 | 0.09 | 0.13 | 0.07 |
| 2006 | 0.82 | 0.6 | 0.49 | 0.42 | 0.4 | 0.19 | 0.11 | 0.08 | 0.13 | 0.07 |
| 2005 | 0.79 | 0.57 | 0.47 | 0.41 | 0.38 | 0.17 | 0.09 | 0.07 | 0.13 | 0.06 |
| 2004 | 0.77 | 0.55 | 0.45 | 0.39 | 0.37 | 0.16 | 0.09 | 0.07 | 0.14 | 0.06 |
| 2003 | 0.76 | 0.55 | 0.44 | 0.38 | 0.36 | 0.17 | 0.1 | 0.08 | 0.13 | 0.06 |
| 2002 | 0.73 | 0.52 | 0.43 | 0.37 | 0.34 | 0.15 | 0.09 | 0.07 | 0.13 | 0.05 |
| 2001 | 0.71 | 0.51 | 0.4 | 0.35 | 0.32 | 0.16 | 0.1 | 0.08 | 0.13 | 0.05 |
| 2000 | 0.69 | 0.49 | 0.38 | 0.33 | 0.31 | 0.15 | 0.09 | 0.07 | 0.14 | 0.05 |
| 1999 | 0.62 | 0.41 | 0.32 | 0.26 | 0.24 | 0.15 | 0.09 | 0.07 | 0.14 | 0.05 |
| 1998 | 0.57 | 0.38 | 0.29 | 0.24 | 0.22 | 0.14 | 0.08 | 0.06 | 0.13 | 0.05 |
| 1997 | 0.55 | 0.37 | 0.28 | 0.24 | 0.21 | 0.13 | 0.08 | 0.06 | 0.13 | 0.04 |
| 1996 | 0.54 | 0.36 | 0.27 | 0.23 | 0.2 | 0.13 | 0.07 | 0.06 | 0.13 | 0.04 |
| 1995 | 0.51 | 0.34 | 0.25 | 0.21 | 0.19 | 0.12 | 0.07 | 0.06 | 0.13 | 0.04 |
| 1994 | 0.49 | 0.31 | 0.23 | 0.2 | 0.17 | 0.12 | 0.07 | 0.05 | 0.13 | 0.04 |
| 1993 | 0.46 | 0.29 | 0.21 | 0.18 | 0.16 | 0.11 | 0.07 | 0.05 | 0.12 | 0.04 |
| 1992 | 0.43 | 0.27 | 0.19 | 0.16 | 0.13 | 0.11 | 0.06 | 0.05 | 0.12 | 0.04 |
| 1991 | 0.42 | 0.25 | 0.19 | 0.15 | 0.12 | 0.1 | 0.06 | 0.05 | 0.12 | 0.03 |
| 1990 | 0.42 | 0.24 | 0.19 | 0.14 | 0.12 | 0.09 | 0.06 | 0.05 | 0.12 | 0.03 |
| 1989 | 0.41 | 0.23 | 0.18 | 0.14 | 0.11 | 0.09 | 0.06 | 0.05 | 0.12 | 0.03 |
| 1988 | 0.39 | 0.22 | 0.18 | 0.13 | 0.11 | 0.09 | 0.06 | 0.05 | 0.12 | 0.03 |
| 1987 | 0.38 | 0.22 | 0.17 | 0.13 | 0.1 | 0.09 | 0.06 | 0.05 | 0.11 | 0.03 |
| 1986 | 0.38 | 0.21 | 0.17 | 0.12 | 0.1 | 0.08 | 0.05 | 0.04 | 0.11 | 0.03 |
| 1985 | 0.36 | 0.19 | 0.15 | 0.11 | 0.08 | 0.08 | 0.05 | 0.04 | 0.12 | 0.03 |
| 1984 | 0.35 | 0.18 | 0.15 | 0.1 | 0.08 | 0.08 | 0.05 | 0.04 | 0.12 | 0.03 |
| 1983 | 0.33 | 0.17 | 0.13 | 0.09 | 0.07 | 0.07 | 0.05 | 0.04 | 0.11 | 0.03 |
| 1982 | 0.32 | 0.16 | 0.13 | 0.09 | 0.06 | 0.07 | 0.05 | 0.04 | 0.11 | 0.02 |
| 1981 | 0.3 | 0.15 | 0.12 | 0.08 | 0.06 | 0.07 | 0.04 | 0.04 | 0.11 | 0.02 |
| 1980 | 0.29 | 0.14 | 0.11 | 0.07 | 0.05 | 0.07 | 0.04 | 0.04 | 0.11 | 0.02 |
| 1979 | 0.29 | 0.14 | 0.11 | 0.08 | 0.05 | 0.06 | 0.04 | 0.03 | 0.11 | 0.02 |
| 1978 | 0.29 | 0.14 | 0.11 | 0.08 | 0.05 | 0.06 | 0.04 | 0.03 | 0.11 | 0.02 |
| 1977 | 0.27 | 0.13 | 0.1 | 0.07 | 0.05 | 0.06 | 0.04 | 0.03 | 0.1 | 0.02 |
| 1976 | 0.26 | 0.13 | 0.1 | 0.07 | 0.04 | 0.06 | 0.04 | 0.03 | 0.1 | 0.02 |
| 1975 | 0.26 | 0.12 | 0.09 | 0.06 | 0.04 | 0.06 | 0.04 | 0.03 | 0.1 | 0.02 |
| 1974 | 0.25 | 0.12 | 0.09 | 0.06 | 0.04 | 0.05 | 0.03 | 0.03 | 0.1 | 0.02 |
| 1973 | 0.25 | 0.11 | 0.09 | 0.06 | 0.04 | 0.05 | 0.03 | 0.03 | 0.09 | 0.02 |
| 1972 | 0.23 | 0.11 | 0.08 | 0.06 | 0.04 | 0.05 | 0.03 | 0.03 | 0.09 | 0.02 |
| 1971 | 0.23 | 0.11 | 0.09 | 0.06 | 0.04 | 0.05 | 0.03 | 0.03 | 0.09 | 0.02 |
| 1970 | 0.22 | 0.1 | 0.08 | 0.05 | 0.04 | 0.05 | 0.03 | 0.03 | 0.09 | 0.02 |
| 1969 | 0.23 | 0.11 | 0.09 | 0.06 | 0.04 | 0.05 | 0.03 | 0.02 | 0.09 | 0.02 |
| 1968 | 0.22 | 0.11 | 0.08 | 0.06 | 0.04 | 0.05 | 0.03 | 0.02 | 0.09 | 0.02 |
| 1967 | 0.22 | 0.1 | 0.08 | 0.06 | 0.04 | 0.04 | 0.03 | 0.02 | 0.08 | 0.02 |
| 1966 | 0.21 | 0.1 | 0.08 | 0.06 | 0.04 | 0.04 | 0.03 | 0.02 | 0.08 | 0.02 |
| 1965 | 0.2 | 0.1 | 0.08 | 0.06 | 0.04 | 0.04 | 0.02 | 0.02 | 0.08 | 0.01 |
| 1964 | 0.2 | 0.09 | 0.08 | 0.05 | 0.04 | 0.04 | 0.02 | 0.02 | 0.08 | 0.01 |
| 1963 | 0.2 | 0.09 | 0.08 | 0.06 | 0.04 | 0.04 | 0.02 | 0.02 | 0.08 | 0.01 |
| 1962 | 0.2 | 0.1 | 0.08 | 0.06 | 0.05 | 0.04 | 0.02 | 0.02 | 0.07 | 0.01 |
| 1961 | 0.2 | 0.1 | 0.08 | 0.06 | 0.05 | 0.03 | 0.02 | 0.02 | 0.07 | 0.01 |


Comments