Abstract
Onion production has seen significant fluctuations globally, influenced by climatic conditions, agricultural practices, and market demand. Historically, countries like China and India have dominated the market, but recent trends show South Korea emerging as a key player, achieving an impressive yield of 67.7 tons per hectare in 2022. This increase is attributed to advancements in farming techniques, including improved seed varieties and efficient irrigation methods. Additionally, South Korea’s focus on quality control and sustainable practices has enhanced its competitiveness. As global demand for onions continues to rise, the emphasis on innovation and sustainability in production will likely shape future trends in this vital sector.
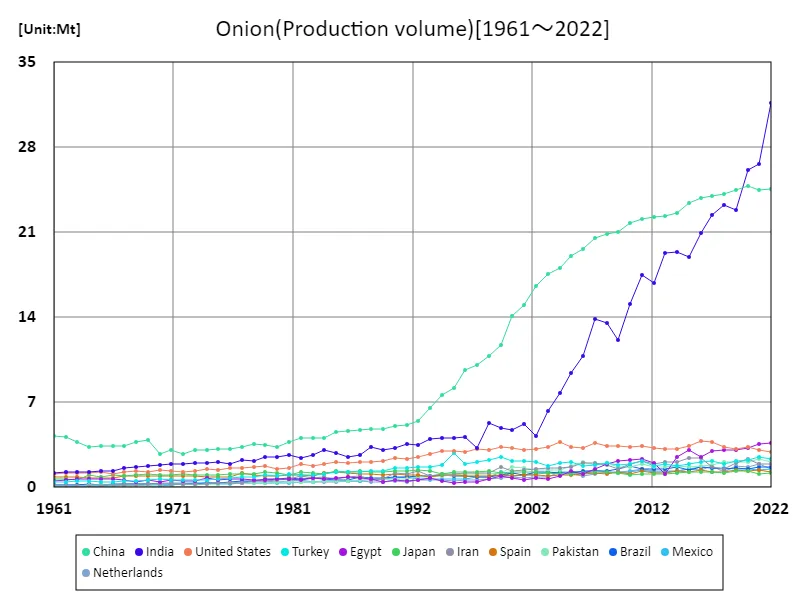
Onion production (worldwide)
Onion production has evolved significantly from 1961 to 2022, marked by innovations in agricultural practices and fluctuating yields. South Korea has emerged as a leader in onion cultivation, achieving its peak yield of 85.4 tons per hectare in 2021, reflecting a commitment to advanced farming techniques, including precision agriculture and hybrid seed varieties. As of 2022, South Korea’s yield is at 79.3% of this peak, indicating a robust yet slightly declining trend. Global onion production has also been influenced by factors such as climate change, market dynamics, and export opportunities. The increasing focus on sustainable practices and crop resilience is expected to shape future trends in onion agriculture worldwide.
The maximum is the latest one, 31.7Mt of India
Onion production (latest year, world)
Onion production in global agriculture has shown notable advancements, with South Korea leading at a remarkable yield of 67.7 tons per hectare in 2022. This figure highlights the country’s effective agricultural practices and commitment to innovation. In contrast, the global average yield stands at 23.9 tons per hectare, indicating a significant disparity in production efficiency. The total production volume of 3.3 million tons showcases the onion’s importance in food systems worldwide. Trends indicate a growing emphasis on enhancing yield through technology, sustainable farming methods, and improved seed varieties, as producers strive to meet rising global demand while addressing challenges such as climate change and resource scarcity.
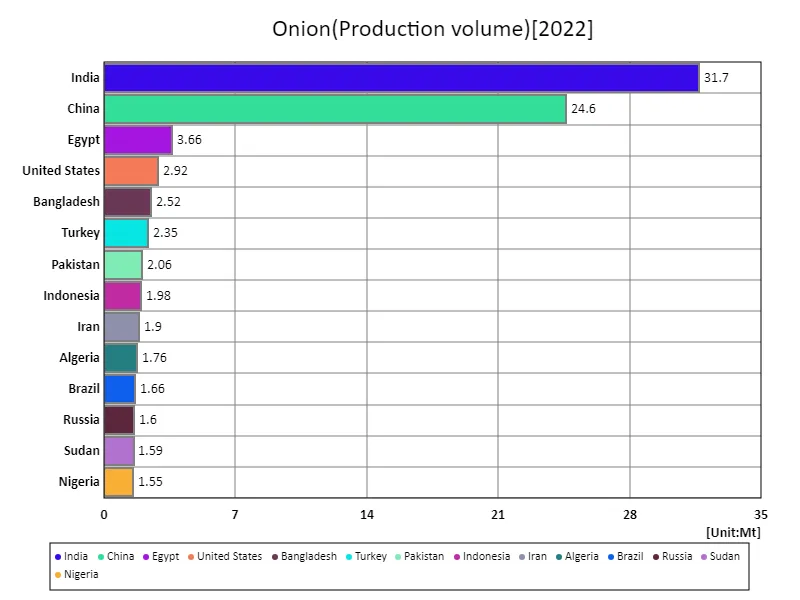
The maximum is 31.7Mt of India, the average is 774kt, and the total is 111Mt
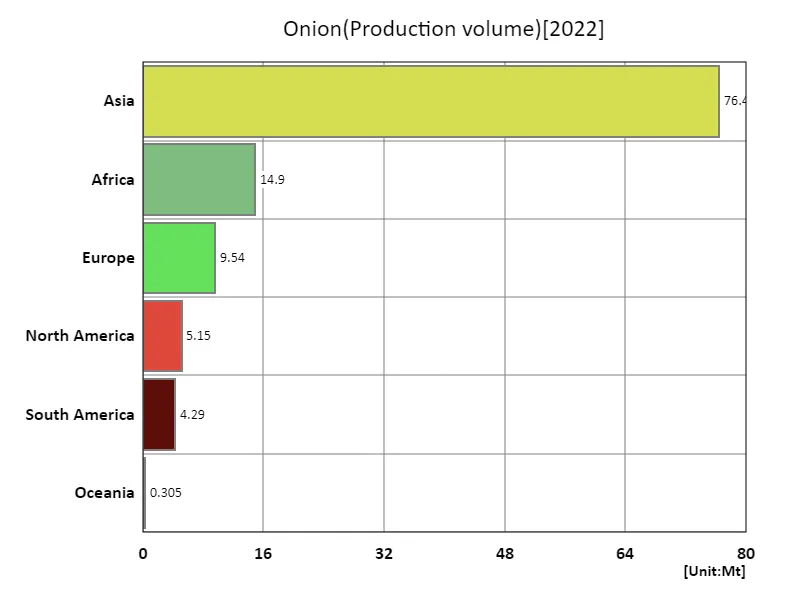
Onion production (continent)
Onion production has experienced notable developments globally, with Oceania achieving the highest yield at 57.7 tons per hectare in 2022. This indicates a growing proficiency in agricultural practices within the region, driven by advances in technology and effective resource management. Overall, onion cultivation trends reflect a shift towards higher efficiency, with many countries adopting improved farming techniques and hybrid varieties. As the global demand for onions continues to rise, producers are increasingly focusing on sustainability and climate resilience to ensure consistent supply. The emphasis on quality and productivity suggests a positive trajectory for onion agriculture in the coming years, positioning it as a vital crop in global food security.
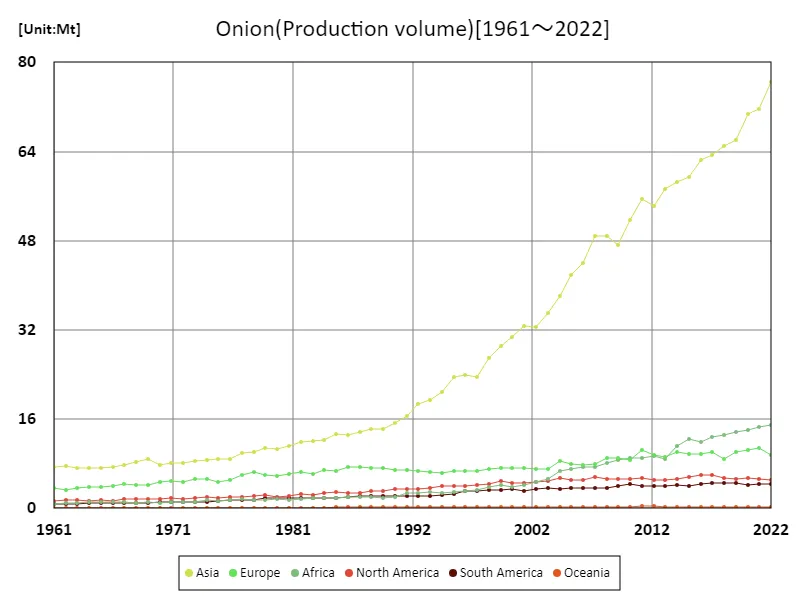
The maximum is the latest one, 76.4Mt of Asia
Onion production (latest year, continent)
Onion production in global agriculture has shown significant variability, with Oceania leading at a yield of 54.5 tons per hectare in 2022. This high yield reflects the region’s adoption of advanced farming practices and climate-specific cultivation techniques. The global average yield stands at 30.7 tons per hectare, highlighting opportunities for improvement in less productive areas. With a total production volume of 184 million tons, onions remain a staple crop critical for food security worldwide. Current trends indicate a growing focus on sustainability, technology adoption, and resilience to climate change, as producers aim to enhance yields and meet increasing consumer demand for this essential vegetable.
The maximum is 76.4Mt of Asia, the average is 18.4Mt, and the total is 111Mt
Main data
| Production(Onion, Production volume, t) [Mt] | ||||||||||
|---|---|---|---|---|---|---|---|---|---|---|
| World | Asia | Lower-middle-income countries | Upper-middle-income countries | Southern Asia | India | Eastern Asia | China | Net Food Importing Developing Countries | Africa | |
| 2022 | 110.62 | 76.43 | 52.54 | 39.16 | 38.77 | 31.69 | 27.12 | 24.61 | 17.57 | 14.9 |
| 2021 | 106.75 | 71.7 | 47.6 | 39.06 | 33.79 | 26.64 | 27.27 | 24.49 | 17.4 | 14.52 |
| 2020 | 105.11 | 70.66 | 46.62 | 39.08 | 32.97 | 26.09 | 27.44 | 24.82 | 16.36 | 14.08 |
| 2019 | 100.08 | 66.14 | 42.31 | 38.58 | 29.11 | 22.82 | 27.53 | 24.5 | 15.86 | 13.72 |
| 2018 | 97.41 | 65.04 | 42.12 | 37.79 | 28.89 | 23.26 | 26.95 | 24.18 | 15.32 | 13.22 |
| 2017 | 97.08 | 63.39 | 40.4 | 38.15 | 28.15 | 22.43 | 26.5 | 24.03 | 14.98 | 12.75 |
| 2016 | 94.84 | 62.45 | 39.13 | 37.4 | 27.07 | 20.93 | 26.43 | 23.79 | 14.03 | 11.93 |
| 2015 | 91.57 | 59.47 | 37.73 | 36.55 | 25.06 | 18.93 | 25.89 | 23.44 | 14.75 | 12.4 |
| 2014 | 89.45 | 58.56 | 36.67 | 35.51 | 24.96 | 19.4 | 25.45 | 22.59 | 13.54 | 11.18 |
| 2013 | 84.77 | 57.31 | 34.31 | 34.73 | 24.53 | 19.3 | 24.81 | 22.35 | 11.28 | 8.9 |
| 2012 | 82.56 | 54.18 | 32.28 | 34.56 | 22.01 | 16.81 | 24.63 | 22.24 | 11.84 | 9.3 |
| 2011 | 84.67 | 55.5 | 33.04 | 35.02 | 23.08 | 17.51 | 24.74 | 22.06 | 12.19 | 8.99 |
| 2010 | 79.14 | 51.63 | 29.77 | 33.88 | 20.05 | 15.12 | 24.29 | 21.75 | 11.43 | 9.08 |
| 2009 | 74.37 | 47.21 | 25.96 | 32.59 | 16.59 | 12.16 | 23.66 | 21.05 | 10.96 | 8.64 |
| 2008 | 75.01 | 48.84 | 27.51 | 32.41 | 18.79 | 13.57 | 23.22 | 20.82 | 10.86 | 8.1 |
| 2007 | 73.79 | 48.86 | 26.97 | 31.5 | 19.16 | 13.9 | 23.13 | 20.57 | 10.22 | 7.49 |
| 2006 | 68.17 | 44.05 | 23.38 | 30.05 | 16.26 | 10.85 | 21.74 | 19.6 | 10.28 | 7.38 |
| 2005 | 65.76 | 41.81 | 21.11 | 29.64 | 14.03 | 9.43 | 21.25 | 19.05 | 9.63 | 7.11 |
| 2004 | 62.45 | 38.09 | 18.14 | 28.47 | 11.66 | 7.76 | 20.21 | 18.05 | 8.41 | 6.69 |
| 2003 | 56.29 | 35.1 | 15.06 | 27.5 | 9.99 | 6.27 | 19.54 | 17.54 | 7.32 | 5.33 |
| 2002 | 52.75 | 32.54 | 12.75 | 26.49 | 7.86 | 4.21 | 18.84 | 16.54 | 6.82 | 4.75 |
| 2001 | 52.03 | 32.72 | 13.74 | 24.96 | 8.98 | 5.25 | 17.44 | 15.02 | 6.36 | 4.18 |
| 2000 | 49.96 | 30.67 | 12.94 | 23.87 | 8.5 | 4.72 | 16.31 | 14.1 | 6.04 | 3.74 |
| 1999 | 49.04 | 29.04 | 13.2 | 22.43 | 8.56 | 4.9 | 13.95 | 11.73 | 5.76 | 4.2 |
| 1998 | 45.68 | 26.93 | 12.35 | 20.47 | 8.44 | 5.33 | 13.15 | 10.84 | 5.37 | 3.9 |
| 1997 | 40.98 | 23.51 | 9.67 | 19.08 | 6.36 | 3.2 | 12.12 | 10.04 | 4.66 | 3.36 |
| 1996 | 41.05 | 23.96 | 10.54 | 18.3 | 7.36 | 4.18 | 11.57 | 9.64 | 4.35 | 3.08 |
| 1995 | 39.81 | 23.49 | 10.27 | 17.01 | 7.16 | 4.08 | 10.53 | 8.2 | 4.05 | 2.89 |
| 1994 | 36.44 | 20.81 | 10.01 | 15.01 | 7.03 | 4.04 | 9.36 | 7.63 | 4.04 | 2.82 |
| 1993 | 34.8 | 19.35 | 9.9 | 13.48 | 6.8 | 4.01 | 8.53 | 6.53 | 4.15 | 2.97 |
| 1992 | 34.02 | 18.72 | 10.03 | 12.84 | 6.62 | 3.49 | 7.72 | 5.43 | 3.97 | 2.71 |
| 1991 | 32.03 | 16.55 | 8.12 | 13.41 | 6.42 | 3.58 | 7.06 | 5.14 | 3.88 | 2.82 |
| 1990 | 30.1 | 15.3 | 7.18 | 13.31 | 5.36 | 3.23 | 6.84 | 5.03 | 2.99 | 2.09 |
| 1989 | 28.87 | 14.22 | 6.43 | 12.88 | 4.68 | 3.07 | 6.73 | 4.82 | 2.81 | 1.88 |
| 1988 | 28.9 | 14.21 | 6.69 | 12.95 | 4.79 | 3.35 | 6.67 | 4.82 | 2.79 | 1.97 |
| 1987 | 28.37 | 13.77 | 6.39 | 12.68 | 4.39 | 2.7 | 6.63 | 4.73 | 2.78 | 2.01 |
| 1986 | 27.45 | 13.19 | 6.15 | 12.42 | 4.07 | 2.53 | 6.33 | 4.63 | 2.82 | 2.06 |
| 1985 | 26.8 | 13.34 | 6.13 | 11.47 | 4.28 | 2.86 | 6.37 | 4.53 | 2.58 | 1.87 |
| 1984 | 25.68 | 12.32 | 6.39 | 10.73 | 4.62 | 3.1 | 5.37 | 4.04 | 2.44 | 1.81 |
| 1983 | 24.37 | 12.08 | 5.78 | 10.34 | 4.15 | 2.7 | 5.78 | 4.02 | 2.49 | 1.78 |
| 1982 | 24.63 | 11.94 | 5.61 | 10.33 | 4.04 | 2.43 | 5.78 | 4.04 | 2.36 | 1.66 |
| 1981 | 23 | 11.23 | 5.36 | 9.82 | 3.93 | 2.65 | 5.13 | 3.77 | 2.15 | 1.57 |
| 1980 | 22 | 10.57 | 5.31 | 9.22 | 3.78 | 2.5 | 4.74 | 3.28 | 2.32 | 1.6 |
| 1979 | 22.58 | 10.83 | 4.97 | 9.53 | 3.61 | 2.5 | 5.15 | 3.47 | 2.13 | 1.5 |
| 1978 | 21.86 | 10.1 | 4.69 | 9.17 | 3.24 | 2.2 | 4.85 | 3.54 | 2.04 | 1.45 |
| 1977 | 21 | 9.84 | 4.71 | 8.38 | 3.15 | 2.23 | 4.75 | 3.35 | 2.13 | 1.58 |
| 1976 | 19.08 | 8.93 | 4.24 | 8.02 | 2.82 | 1.95 | 4.43 | 3.16 | 2.07 | 1.53 |
| 1975 | 18.35 | 8.86 | 4.28 | 7.62 | 2.93 | 2.1 | 4.3 | 3.16 | 1.87 | 1.37 |
| 1974 | 18.79 | 8.72 | 4.19 | 7.69 | 2.75 | 2 | 4.24 | 3.07 | 1.91 | 1.42 |
| 1973 | 17.83 | 8.43 | 3.89 | 7.52 | 2.68 | 1.98 | 4.14 | 3.03 | 1.62 | 1.16 |
| 1972 | 16.79 | 8.11 | 3.77 | 6.68 | 2.63 | 1.92 | 4.02 | 2.78 | 1.64 | 1.06 |
| 1971 | 17.17 | 8.19 | 3.81 | 6.86 | 2.62 | 1.9 | 4.2 | 3.05 | 1.76 | 1.17 |
| 1970 | 16.4 | 7.81 | 3.53 | 6.55 | 2.51 | 1.8 | 3.8 | 2.73 | 1.61 | 0.99 |
| 1969 | 16.82 | 8.81 | 3.55 | 7.22 | 2.45 | 1.75 | 5.1 | 3.88 | 1.62 | 1.08 |
| 1968 | 16.13 | 8.27 | 3.27 | 6.87 | 2.33 | 1.7 | 4.84 | 3.73 | 1.48 | 0.91 |
| 1967 | 15.91 | 7.85 | 3.34 | 6.59 | 2.24 | 1.63 | 4.44 | 3.42 | 1.62 | 1.05 |
| 1966 | 15.02 | 7.41 | 3.03 | 6.41 | 1.89 | 1.35 | 4.47 | 3.37 | 1.59 | 1.11 |
| 1965 | 14.61 | 7.25 | 2.95 | 6.13 | 1.8 | 1.32 | 4.34 | 3.42 | 1.56 | 1.09 |
| 1964 | 14.36 | 7.17 | 2.85 | 6.04 | 1.72 | 1.29 | 4.32 | 3.29 | 1.48 | 1.05 |
| 1963 | 14.22 | 7.14 | 2.82 | 6.22 | 1.68 | 1.26 | 4.34 | 3.69 | 1.41 | 1.03 |
| 1962 | 14.01 | 7.51 | 2.65 | 6.49 | 1.61 | 1.23 | 4.87 | 4.12 | 1.25 | 0.94 |
| 1961 | 13.91 | 7.4 | 2.49 | 6.73 | 1.58 | 1.2 | 4.89 | 4.21 | 1.14 | 0.86 |

Comments